Results of the 1989 Spanish Congress election
 |
Main: 1989 Spanish general election | |||
|---|---|---|---|---|
| 29 October 1989 | ||||
 | ||||
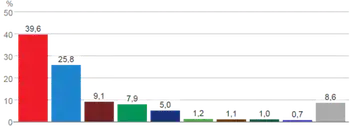 | ||||
Party | Votes | % | Seats | |
| PSOE | 8,115,568 | 39.6% | 175 | |
| PP | 5,285,972 | 25.8% | 107 | |
| IU | 1,858,588 | 9.1% | 17 | |
| CDS | 1,617,716 | 7.9% | 14 | |
| CiU | 1,032,243 | 5.0% | 18 | |
| EAJ/PNV | 254,681 | 1.2% | 5 | |
| HB | 217,278 | 1.1% | 4 | |
| PA | 212,687 | 1.0% | 2 | |
| UV | 144,924 | 0.7% | 2 | |
| Others | 1,754,025 | 8.6% | 6 | |
Total | 20,493,682 | 100.0% | 350 | |
This article presents the results breakdown of the election to the Congress of Deputies held in Spain on 29 October 1989. The following tables show detailed results in each of the country's 17 autonomous communities and in the autonomous cities of Ceuta and Melilla, as well as a summary of constituency and regional results.[a][1]
Nationwide
 | ||||||
| Parties and alliances | Popular vote | Seats | ||||
|---|---|---|---|---|---|---|
| Votes | % | ±pp | Total | +/− | ||
| Spanish Socialist Workers' Party (PSOE)1 | 8,115,568 | 39.60 | −4.46 | 175 | −9 | |
| People's Party (PP)1 2 | 5,285,972 | 25.79 | −0.18 | 107 | +2 | |
| United Left (IU) | 1,858,588 | 9.07 | +4.44 | 17 | +10 | |
| Democratic and Social Centre (CDS) | 1,617,716 | 7.89 | −1.33 | 14 | −5 | |
| Convergence and Union (CiU) | 1,032,243 | 5.04 | +0.02 | 18 | ±0 | |
| Basque Nationalist Party (EAJ/PNV) | 254,681 | 1.24 | −0.29 | 5 | −1 | |
| Ruiz-Mateos Group (Ruiz-Mateos) | 219,883 | 1.07 | New | 0 | ±0 | |
| Popular Unity (HB) | 217,278 | 1.06 | −0.09 | 4 | −1 | |
| Andalusian Party (PA) | 212,687 | 1.04 | +0.57 | 2 | +2 | |
| Green List (LV) | 158,034 | 0.77 | +0.61 | 0 | ±0 | |
| Ecologist Party of the Basque Country (PEE–(LV)) | 931 | 0.00 | New | 0 | ±0 | |
| Valencian Union (UV) | 144,924 | 0.71 | New | 2 | +1 | |
| Basque Solidarity (EA) | 136,955 | 0.67 | New | 2 | +2 | |
| The Ecologist Greens (LVE) | 136,335 | 0.67 | New | 0 | ±0 | |
| Basque Country Left (EE) | 105,238 | 0.51 | −0.02 | 2 | ±0 | |
| Workers' Party of Spain–Communist Unity (PTE–UC)3 | 86,257 | 0.42 | −0.72 | 0 | ±0 | |
| Republican Left of Catalonia (ERC) | 84,756 | 0.41 | −0.01 | 0 | ±0 | |
| Workers' Socialist Party (PST) | 81,218 | 0.40 | +0.01 | 0 | ±0 | |
| Regionalist Aragonese Party (PAR) | 71,733 | 0.35 | −0.01 | 1 | ±0 | |
| Canarian Independent Groups (AIC) | 64,767 | 0.32 | −0.01 | 1 | ±0 | |
| Communist Party of the Peoples of Spain (PCPE) | 62,664 | 0.31 | New | 0 | ±0 | |
| Galician Nationalist Bloc (BNG) | 47,763 | 0.23 | +0.10 | 0 | ±0 | |
| Galician Coalition (CG) | 45,821 | 0.22 | −0.18 | 0 | −1 | |
| Valencian People's Union (UPV) | 40,767 | 0.20 | ±0.00 | 0 | ±0 | |
| Galician Socialist Party–Galician Left (PSG–EG) | 34,131 | 0.17 | −0.06 | 0 | ±0 | |
| Green Alternative–Ecologist Movement of Catalonia (AV–MEC)4 | 25,978 | 0.13 | −0.02 | 0 | ±0 | |
| Spanish Phalanx of the CNSO (FE–JONS) | 24,025 | 0.12 | −0.10 | 0 | ±0 | |
| Canarian Nationalist Assembly (ACN)5 | 21,539 | 0.11 | −0.07 | 0 | ±0 | |
| Spanish Vertex Ecological Development Revindication (VERDE) | 21,235 | 0.10 | −0.04 | 0 | ±0 | |
| Social Democratic Coalition (CSD)6 | 17,095 | 0.08 | +0.06 | 0 | ±0 | |
| Humanist Party (PH) | 15,936 | 0.08 | New | 0 | ±0 | |
| Galician Nationalist Party–Galicianist Party (PNG–PG) | 14,411 | 0.07 | New | 0 | ±0 | |
| Alliance for the Republic (AxR)7 | 12,807 | 0.06 | −0.05 | 0 | ±0 | |
| United Extremadura (EU) | 10,984 | 0.05 | −0.03 | 0 | ±0 | |
| Nationalist Left (PSM–ENE) | 7,989 | 0.04 | ±0.00 | 0 | ±0 | |
| Revolutionary Workers' Party of Spain (PORE) | 7,906 | 0.04 | +0.01 | 0 | ±0 | |
| Independents of Gran Canaria (IGC) | 6,371 | 0.03 | New | 0 | ±0 | |
| Asturianist Party (PAS) | 5,414 | 0.03 | New | 0 | ±0 | |
| Centrist Unity–Democratic Spanish Party (PED) | 4,942 | 0.02 | +0.01 | 0 | ±0 | |
| Galician People's Front (FPG) | 3,657 | 0.02 | New | 0 | ±0 | |
| Regional Party of Madrid (PAM) | 3,396 | 0.02 | New | 0 | ±0 | |
| Group of Madrid Radicals (GRM) | 3,330 | 0.02 | New | 0 | ±0 | |
| Asturian Nationalist Unity (UNA) | 3,218 | 0.02 | New | 0 | ±0 | |
| Aragonese Union (UA–CHA) | 3,156 | 0.02 | New | 0 | ±0 | |
| Valencian Nationalist Left–Valencian Regional Union (ENV–URV) | 2,988 | 0.01 | ±0.00 | 0 | ±0 | |
| Regionalist Party of the Leonese Country (PREPAL) | 2,962 | 0.01 | ±0.00 | 0 | ±0 | |
| Balearic Union (UB) | 2,883 | 0.01 | New | 0 | ±0 | |
| United Ceuta (CEU) | 2,760 | 0.01 | New | 0 | ±0 | |
| 7 Green Stars (SEV) | 1,411 | 0.01 | New | 0 | ±0 | |
| Green Movement (MV) | 1,368 | 0.01 | New | 0 | ±0 | |
| Independent Citizen Group (ACI) | 1,359 | 0.01 | New | 0 | ±0 | |
| Nationalist Party of Castile and León (PANCAL) | 1,199 | 0.01 | ±0.00 | 0 | ±0 | |
| Cantonalist Party of the Alicantine Country (Alicantón) | 1,041 | 0.01 | New | 0 | ±0 | |
| Spanish Democratic Republican Action (ARDE) | 975 | 0.00 | New | 0 | ±0 | |
| Radicals for Cantabria (RxC) | 904 | 0.00 | New | 0 | ±0 | |
| Independent Spanish Phalanx (FEI) | 827 | 0.00 | New | 0 | ±0 | |
| Lanzarote Assembly (Tagoror) | 472 | 0.00 | New | 0 | ±0 | |
| Regionalist Party of Guadalajara (PRGU) | 426 | 0.00 | New | 0 | ±0 | |
| Balearic Radical Party (PRB) | 398 | 0.00 | New | 0 | ±0 | |
| Spanish Nationalist Party of Melilla (PNEM) | 301 | 0.00 | New | 0 | ±0 | |
| Proverist Party (PPr) | 245 | 0.00 | ±0.00 | 0 | ±0 | |
| Revolutionary Communist League–Communist Movement (LCR–MC)8 | 0 | 0.00 | ±0.00 | 0 | ±0 | |
| Communist Party of Spain (Marxist–Leninist) (PCE (m–l))9 | 0 | 0.00 | −0.14 | 0 | ±0 | |
| Blank ballots | 141,795 | 0.69 | +0.09 | |||
| Total | 20,493,682 | 350 | ±0 | |||
| Valid votes | 20,493,682 | 99.26 | +0.83 | |||
| Invalid votes | 152,683 | 0.74 | −0.83 | |||
| Votes cast / turnout | 20,646,365 | 69.74 | −0.75 | |||
| Abstentions | 8,957,690 | 30.26 | +0.75 | |||
| Registered voters | 29,604,055 | |||||
| Sources[2][3][4][5][6][7][8] | ||||||
Footnotes:
| ||||||
Summary
Constituencies

| Constituency | PSOE | PP | IU | CDS | CiU | PNV | HB | PA | UV | EA | EE | PAR | AIC | |||||||||||||
|---|---|---|---|---|---|---|---|---|---|---|---|---|---|---|---|---|---|---|---|---|---|---|---|---|---|---|
| % | S | % | S | % | S | % | S | % | S | % | S | % | S | % | S | % | S | % | S | % | S | % | S | % | S | |
| Álava | 25.9 | 2 | 14.1 | 1 | 3.1 | − | 6.7 | − | 16.9 | 1 | 11.6 | − | 8.5 | − | 8.7 | − | ||||||||||
| Albacete | 49.7 | 3 | 30.8 | 1 | 8.4 | − | 7.4 | − | ||||||||||||||||||
| Alicante | 43.8 | 5 | 29.4 | 3 | 9.0 | 1 | 10.0 | 1 | 0.6 | − | ||||||||||||||||
| Almería | 52.7 | 4 | 23.4 | 1 | 8.5 | − | 8.9 | − | 2.3 | − | ||||||||||||||||
| Asturias | 40.6 | 4 | 26.5 | 3 | 15.6 | 1 | 12.5 | 1 | ||||||||||||||||||
| Ávila | 27.8 | 1 | 32.8 | 1 | 4.4 | − | 31.5 | 1 | ||||||||||||||||||
| Badajoz | 54.8 | 4 | 23.5 | 2 | 8.0 | − | 10.0 | − | ||||||||||||||||||
| Balearics | 34.5 | 3 | 40.7 | 3 | 5.1 | − | 9.2 | − | ||||||||||||||||||
| Barcelona | 37.0 | 14 | 10.5 | 3 | 8.2 | 3 | 4.5 | 1 | 30.4 | 11 | ||||||||||||||||
| Biscay | 20.8 | 2 | 9.7 | 1 | 3.6 | − | 3.4 | − | 27.9 | 3 | 15.0 | 2 | 7.9 | 1 | 7.9 | 1 | ||||||||||
| Burgos | 32.3 | 2 | 43.5 | 2 | 7.9 | − | 10.8 | − | ||||||||||||||||||
| Cáceres | 52.6 | 3 | 27.2 | 2 | 5.1 | − | 8.8 | − | ||||||||||||||||||
| Cádiz | 51.9 | 6 | 16.3 | 1 | 9.6 | 1 | 4.2 | − | 11.3 | 1 | ||||||||||||||||
| Cantabria | 40.1 | 3 | 38.4 | 2 | 6.4 | − | 9.7 | − | ||||||||||||||||||
| Castellón | 41.7 | 3 | 33.9 | 2 | 5.5 | − | 8.8 | − | 1.3 | − | ||||||||||||||||
| Ceuta | 37.7 | 1 | 34.3 | − | 8.2 | − | ||||||||||||||||||||
| Ciudad Real | 52.4 | 3 | 30.0 | 2 | 6.3 | − | 7.9 | − | ||||||||||||||||||
| Córdoba | 49.4 | 5 | 18.2 | 1 | 18.3 | 1 | 5.0 | − | 5.9 | − | ||||||||||||||||
| Cuenca | 45.9 | 2 | 39.0 | 1 | 4.3 | − | 7.2 | − | ||||||||||||||||||
| Gerona | 28.9 | 2 | 7.9 | − | 3.9 | − | 3.0 | − | 46.9 | 3 | ||||||||||||||||
| Granada | 50.0 | 4 | 24.6 | 2 | 11.5 | 1 | 6.0 | − | 2.6 | − | ||||||||||||||||
| Guadalajara | 36.5 | 1 | 42.8 | 2 | 8.4 | − | 7.6 | − | ||||||||||||||||||
| Guipúzcoa | 19.8 | 2 | 7.0 | − | 2.0 | − | 2.2 | − | 16.2 | 1 | 22.0 | 2 | 17.9 | 1 | 10.4 | 1 | ||||||||||
| Huelva | 58.5 | 4 | 19.6 | 1 | 7.7 | − | 4.7 | − | 5.0 | − | ||||||||||||||||
| Huesca | 40.5 | 2 | 25.5 | 1 | 7.7 | − | 8.5 | − | 12.1 | − | ||||||||||||||||
| Jaén | 54.1 | 4 | 24.3 | 2 | 11.5 | − | 4.8 | − | 2.5 | − | ||||||||||||||||
| La Coruña | 36.8 | 4 | 35.8 | 4 | 3.9 | − | 9.0 | 1 | ||||||||||||||||||
| La Rioja | 39.7 | 2 | 41.1 | 2 | 6.4 | − | 7.2 | − | ||||||||||||||||||
| Las Palmas | 32.0 | 3 | 20.7 | 2 | 10.1 | − | 24.3 | 2 | 1.8 | − | ||||||||||||||||
| León | 39.9 | 3 | 38.4 | 2 | 6.3 | − | 10.1 | − | ||||||||||||||||||
| Lérida | 28.6 | 2 | 12.4 | − | 3.7 | − | 4.0 | − | 41.8 | 2 | ||||||||||||||||
| Lugo | 31.4 | 2 | 45.8 | 3 | 2.0 | − | 6.1 | − | ||||||||||||||||||
| Madrid | 33.5 | 12 | 34.2 | 12 | 15.4 | 5 | 11.0 | 4 | ||||||||||||||||||
| Málaga | 51.6 | 7 | 19.5 | 2 | 13.6 | 1 | 5.6 | − | 5.1 | − | ||||||||||||||||
| Melilla | 38.5 | − | 55.7 | 1 | 1.8 | − | ||||||||||||||||||||
| Murcia | 46.1 | 5 | 30.0 | 3 | 9.2 | − | 10.4 | 1 | ||||||||||||||||||
| Navarre | 31.2 | 2 | 33.2 | 3 | 5.7 | − | 7.0 | − | 0.9 | − | 11.0 | − | 4.8 | − | 2.9 | − | ||||||||||
| Orense | 35.4 | 2 | 40.7 | 3 | 2.0 | − | 5.6 | − | ||||||||||||||||||
| Palencia | 36.6 | 1 | 44.5 | 2 | 5.8 | − | 8.6 | − | ||||||||||||||||||
| Pontevedra | 32.9 | 4 | 39.0 | 4 | 3.7 | − | 8.1 | − | ||||||||||||||||||
| Salamanca | 37.0 | 2 | 40.7 | 2 | 5.7 | − | 12.5 | − | ||||||||||||||||||
| Santa Cruz de Tenerife | 40.6 | 4 | 17.9 | 1 | 5.6 | − | 10.1 | 1 | 18.5 | 1 | ||||||||||||||||
| Segovia | 30.7 | 1 | 39.9 | 2 | 7.1 | − | 16.5 | − | ||||||||||||||||||
| Seville | 54.2 | 8 | 19.0 | 2 | 11.5 | 1 | 2.3 | − | 9.0 | 1 | ||||||||||||||||
| Soria | 33.0 | 1 | 47.9 | 2 | 5.1 | − | 9.4 | − | ||||||||||||||||||
| Tarragona | 34.2 | 2 | 13.1 | 1 | 5.3 | − | 4.0 | − | 34.1 | 2 | ||||||||||||||||
| Teruel | 40.1 | 2 | 32.9 | 1 | 4.3 | − | 8.7 | − | 10.6 | − | ||||||||||||||||
| Toledo | 47.0 | 3 | 34.4 | 2 | 7.3 | − | 8.0 | − | ||||||||||||||||||
| Valencia | 40.1 | 8 | 24.2 | 4 | 9.9 | 1 | 6.5 | 1 | 11.5 | 2 | ||||||||||||||||
| Valladolid | 35.9 | 2 | 38.1 | 3 | 9.5 | − | 11.4 | − | ||||||||||||||||||
| Zamora | 37.9 | 1 | 42.7 | 2 | 4.0 | − | 11.5 | − | ||||||||||||||||||
| Zaragoza | 38.0 | 3 | 27.5 | 2 | 11.3 | 1 | 7.2 | − | 10.6 | 1 | ||||||||||||||||
| Total | 39.6 | 175 | 25.8 | 107 | 9.1 | 17 | 7.9 | 14 | 5.0 | 18 | 1.2 | 5 | 1.1 | 4 | 1.0 | 2 | 0.7 | 2 | 0.7 | 2 | 0.5 | 2 | 0.4 | 1 | 0.3 | 1 |
Regions

| Region | PSOE | PP | IU | CDS | CiU | PNV | HB | PA | UV | EA | EE | PAR | AIC | |||||||||||||
|---|---|---|---|---|---|---|---|---|---|---|---|---|---|---|---|---|---|---|---|---|---|---|---|---|---|---|
| % | S | % | S | % | S | % | S | % | S | % | S | % | S | % | S | % | S | % | S | % | S | % | S | % | S | |
| Andalusia | 52.5 | 42 | 20.2 | 12 | 12.0 | 5 | 4.7 | − | 6.2 | 2 | ||||||||||||||||
| Aragon | 38.7 | 7 | 27.8 | 4 | 9.7 | 1 | 7.6 | − | 10.9 | 1 | ||||||||||||||||
| Asturias | 40.6 | 4 | 26.5 | 3 | 15.6 | 1 | 12.5 | 1 | ||||||||||||||||||
| Balearics | 34.5 | 3 | 40.7 | 3 | 5.1 | − | 9.2 | − | ||||||||||||||||||
| Basque Country | 21.1 | 6 | 9.4 | 2 | 3.0 | − | 3.5 | − | 22.8 | 5 | 16.9 | 4 | 11.2 | 2 | 8.8 | 2 | ||||||||||
| Canary Islands | 36.1 | 7 | 19.4 | 3 | 8.0 | − | 17.6 | 3 | 9.7 | 1 | ||||||||||||||||
| Cantabria | 40.1 | 3 | 38.4 | 2 | 6.4 | − | 9.7 | − | ||||||||||||||||||
| Castile and León | 35.6 | 14 | 40.2 | 18 | 6.7 | − | 12.8 | 1 | ||||||||||||||||||
| Castilla–La Mancha | 48.0 | 12 | 33.8 | 8 | 7.0 | − | 7.7 | − | ||||||||||||||||||
| Catalonia | 35.6 | 20 | 10.6 | 4 | 7.3 | 3 | 4.3 | 1 | 32.7 | 18 | ||||||||||||||||
| Ceuta | 37.7 | 1 | 34.3 | − | 8.2 | − | ||||||||||||||||||||
| Extremadura | 53.9 | 7 | 25.0 | 4 | 6.9 | − | 9.5 | − | ||||||||||||||||||
| Galicia | 34.6 | 12 | 39.0 | 14 | 3.3 | − | 7.8 | 1 | ||||||||||||||||||
| La Rioja | 39.7 | 2 | 41.1 | 2 | 6.4 | − | 7.2 | − | ||||||||||||||||||
| Madrid | 33.5 | 12 | 34.2 | 12 | 15.4 | 5 | 11.0 | 4 | ||||||||||||||||||
| Melilla | 38.5 | − | 55.7 | 1 | 1.8 | − | ||||||||||||||||||||
| Murcia | 46.1 | 5 | 30.0 | 3 | 9.2 | − | 10.4 | 1 | ||||||||||||||||||
| Navarre | 31.2 | 2 | 33.2 | 3 | 5.7 | − | 7.0 | − | 0.9 | − | 11.0 | − | 4.8 | − | 2.9 | − | ||||||||||
| Valencian Community | 41.5 | 16 | 27.0 | 9 | 9.1 | 2 | 7.8 | 2 | 4.6 | 2 | ||||||||||||||||
| Total | 39.6 | 175 | 25.8 | 107 | 9.1 | 17 | 7.9 | 14 | 5.0 | 18 | 1.2 | 5 | 1.1 | 4 | 1.0 | 2 | 0.7 | 2 | 0.7 | 2 | 0.5 | 2 | 0.4 | 1 | 0.3 | 1 |
Autonomous communities
Andalusia
| Parties and alliances | Popular vote | Seats | ||||
|---|---|---|---|---|---|---|
| Votes | % | ±pp | Total | +/− | ||
| Spanish Socialist Workers' Party of Andalusia (PSOE–A) | 1,793,717 | 52.55 | −4.52 | 42 | ±0 | |
| People's Party (PP)1 | 688,625 | 20.17 | −2.51 | 12 | −3 | |
| United Left–Assembly for Andalusia (IU–CA) | 408,733 | 11.97 | +3.87 | 5 | +2 | |
| Andalusian Party (PA) | 212,687 | 6.23 | +3.44 | 2 | +2 | |
| Democratic and Social Centre (CDS) | 159,433 | 4.67 | −0.97 | 0 | ±0 | |
| Ruiz-Mateos Group (Ruiz-Mateos) | 51,616 | 1.51 | New | 0 | ±0 | |
| The Greens–Green List (LV–LV) | 22,244 | 0.65 | New | 0 | ±0 | |
| Workers' Party of Spain–Communist Unity (PTE–UC)2 | 17,720 | 0.52 | −0.60 | 0 | ±0 | |
| The Ecologist Greens (LVE) | 15,724 | 0.46 | New | 0 | ±0 | |
| Workers' Socialist Party (PST) | 10,856 | 0.32 | +0.13 | 0 | ±0 | |
| Communist Party of the Andalusian People (PCPA) | 6,578 | 0.19 | New | 0 | ±0 | |
| Spanish Phalanx of the CNSO (FE–JONS) | 3,413 | 0.10 | −0.07 | 0 | ±0 | |
| Humanist Party (PH) | 2,110 | 0.06 | New | 0 | ±0 | |
| Alliance for the Republic (AxR)3 | 1,878 | 0.06 | −0.01 | 0 | ±0 | |
| Spanish Vertex Ecological Development Revindication (VERDE) | 1,436 | 0.04 | ±0.00 | 0 | ±0 | |
| Centrist Unity–Democratic Spanish Party (PED) | 1,257 | 0.04 | New | 0 | ±0 | |
| Proverist Party (PPr) | 245 | 0.01 | New | 0 | ±0 | |
| Communist Party of Spain (Marxist–Leninist) (PCE (m–l))4 | 0 | 0.00 | −0.12 | 0 | ±0 | |
| Blank ballots | 15,374 | 0.45 | +0.01 | |||
| Total | 3,413,646 | 61 | +1 | |||
| Valid votes | 3,413,646 | 99.30 | +0.65 | |||
| Invalid votes | 24,108 | 0.70 | −0.65 | |||
| Votes cast / turnout | 3,437,754 | 69.33 | −1.44 | |||
| Abstentions | 1,521,041 | 30.67 | +1.44 | |||
| Registered voters | 4,958,795 | |||||
| Sources[2][3] | ||||||
Footnotes:
| ||||||
Aragon
| Parties and alliances | Popular vote | Seats | ||||
|---|---|---|---|---|---|---|
| Votes | % | ±pp | Total | +/− | ||
| Spanish Socialist Workers' Party (PSOE) | 255,342 | 38.72 | −4.71 | 7 | −1 | |
| People's Party (PP)1 | 183,361 | 27.81 | +1.66 | 4 | ±0 | |
| Regionalist Aragonese Party (PAR) | 71,733 | 10.88 | −0.14 | 1 | ±0 | |
| United Left (IU) | 64,200 | 9.74 | +6.35 | 1 | +1 | |
| Democratic and Social Centre (CDS) | 50,160 | 7.61 | −3.57 | 0 | −1 | |
| Ruiz-Mateos Group (Ruiz-Mateos) | 6,872 | 1.04 | New | 0 | ±0 | |
| The Ecologist Greens (LVE) | 4,735 | 0.72 | New | 0 | ±0 | |
| Workers' Socialist Party (PST) | 4,053 | 0.61 | +0.16 | 0 | ±0 | |
| Aragonese Union (UA–CHA) | 3,156 | 0.48 | New | 0 | ±0 | |
| The Greens–Green List (LV–LV) | 2,974 | 0.45 | New | 0 | ±0 | |
| Workers' Party of Spain–Communist Unity (PTE–UC)2 | 2,834 | 0.43 | −0.87 | 0 | ±0 | |
| Social Democratic Coalition (CSD) | 1,849 | 0.28 | New | 0 | ±0 | |
| Communist Party of the Peoples of Spain (PCPE) | 898 | 0.14 | New | 0 | ±0 | |
| Spanish Phalanx of the CNSO (FE–JONS) | 710 | 0.11 | −0.09 | 0 | ±0 | |
| Humanist Party (PH) | 553 | 0.08 | New | 0 | ±0 | |
| Alliance for the Republic (AxR)3 | 435 | 0.07 | −0.08 | 0 | ±0 | |
| Communist Party of Spain (Marxist–Leninist) (PCE (m–l))4 | 0 | 0.00 | −0.16 | 0 | ±0 | |
| Blank ballots | 5,588 | 0.85 | +0.04 | |||
| Total | 659,453 | 13 | −1 | |||
| Valid votes | 659,453 | 99.26 | +1.34 | |||
| Invalid votes | 4,913 | 0.74 | −1.34 | |||
| Votes cast / turnout | 664,366 | 70.21 | −0.38 | |||
| Abstentions | 281,955 | 29.79 | +0.38 | |||
| Registered voters | 946,321 | |||||
| Sources[2][3] | ||||||
Footnotes:
| ||||||
Asturias
| Parties and alliances | Popular vote | Seats | ||||
|---|---|---|---|---|---|---|
| Votes | % | ±pp | Total | +/− | ||
| Spanish Socialist Workers' Party (PSOE) | 248,584 | 40.56 | −5.43 | 4 | −1 | |
| People's Party (PP)1 | 162,590 | 26.53 | −0.69 | 3 | +1 | |
| United Left (IU) | 95,494 | 15.58 | +6.37 | 1 | ±0 | |
| Democratic and Social Centre (CDS) | 76,643 | 12.51 | −0.65 | 1 | ±0 | |
| The Greens–Green List (LV–LV) | 4,352 | 0.71 | New | 0 | ±0 | |
| Asturianist Party (PAS) | 3,526 | 0.58 | New | 0 | ±0 | |
| Ruiz-Mateos Group (Ruiz-Mateos) | 3,424 | 0.56 | New | 0 | ±0 | |
| The Ecologist Greens (LVE) | 3,340 | 0.55 | New | 0 | ±0 | |
| Asturian Nationalist Unity (UNA) | 3,218 | 0.53 | New | 0 | ±0 | |
| Workers' Socialist Party (PST) | 2,861 | 0.47 | −0.14 | 0 | ±0 | |
| Workers' Party of Spain–Communist Unity (PTE–UC)2 | 1,854 | 0.30 | −1.28 | 0 | ±0 | |
| Communist Party of the Peoples of Spain (PCPE) | 1,604 | 0.26 | New | 0 | ±0 | |
| Spanish Phalanx of the CNSO (FE–JONS) | 751 | 0.12 | −0.13 | 0 | ±0 | |
| Alliance for the Republic (AxR)3 | 469 | 0.08 | −0.07 | 0 | ±0 | |
| Humanist Party (PH) | 406 | 0.07 | New | 0 | ±0 | |
| Communist Party of Spain (Marxist–Leninist) (PCE (m–l))4 | 0 | 0.00 | −0.12 | 0 | ±0 | |
| Blank ballots | 3,728 | 0.61 | +0.04 | |||
| Total | 612,844 | 9 | ±0 | |||
| Valid votes | 612,844 | 99.21 | +0.98 | |||
| Invalid votes | 4,853 | 0.79 | −0.98 | |||
| Votes cast / turnout | 617,697 | 68.90 | +1.08 | |||
| Abstentions | 278,788 | 31.10 | −1.08 | |||
| Registered voters | 896,485 | |||||
| Sources[2][3] | ||||||
Footnotes:
| ||||||
Balearics
| Parties and alliances | Popular vote | Seats | ||||
|---|---|---|---|---|---|---|
| Votes | % | ±pp | Total | +/− | ||
| People's Party (PP)1 | 140,163 | 40.66 | +6.35 | 3 | ±0 | |
| Spanish Socialist Workers' Party (PSOE) | 118,833 | 34.48 | −5.80 | 3 | ±0 | |
| Democratic and Social Centre (CDS) | 31,671 | 9.19 | −2.10 | 0 | ±0 | |
| United Left (IU) | 17,555 | 5.09 | +2.76 | 0 | ±0 | |
| The Greens–Green List (EV–LV) | 8,762 | 2.54 | New | 0 | ±0 | |
| Ruiz-Mateos Group (Ruiz-Mateos) | 8,709 | 2.53 | New | 0 | ±0 | |
| Nationalist Left (PSM–ENE) | 7,989 | 2.32 | +0.11 | 0 | ±0 | |
| Balearic Union (UB) | 2,883 | 0.84 | New | 0 | ±0 | |
| Workers' Socialist Party (PST) | 1,621 | 0.47 | New | 0 | ±0 | |
| Communist Party of the Peoples of Spain (PCPE) | 1,050 | 0.30 | New | 0 | ±0 | |
| Workers' Party of Spain–Communist Unity (PTE–UC)2 | 772 | 0.22 | −0.28 | 0 | ±0 | |
| Spanish Phalanx of the CNSO (FE–JONS) | 541 | 0.16 | −0.15 | 0 | ±0 | |
| Revolutionary Workers' Party of Spain (PORE) | 431 | 0.13 | −0.05 | 0 | ±0 | |
| Balearic Radical Party (PRB) | 398 | 0.12 | New | 0 | ±0 | |
| Alliance for the Republic (AxR)3 | 327 | 0.09 | −0.08 | 0 | ±0 | |
| Social Democratic Coalition (CSD) | 0 | 0.00 | New | 0 | ±0 | |
| Blank ballots | 2,976 | 0.86 | +0.14 | |||
| Total | 344,681 | 6 | ±0 | |||
| Valid votes | 344,681 | 98.83 | +1.01 | |||
| Invalid votes | 4,098 | 1.17 | −1.01 | |||
| Votes cast / turnout | 348,779 | 63.54 | −2.48 | |||
| Abstentions | 200,160 | 36.46 | +2.48 | |||
| Registered voters | 548,939 | |||||
| Sources[2][3] | ||||||
Footnotes:
| ||||||
Basque Country
| Parties and alliances | Popular vote | Seats | ||||
|---|---|---|---|---|---|---|
| Votes | % | ±pp | Total | +/− | ||
| Basque Nationalist Party (EAJ/PNV) | 252,119 | 22.78 | −5.04 | 5 | −1 | |
| Socialist Party of the Basque Country (PSE–PSOE) | 233,650 | 21.11 | −5.18 | 6 | −1 | |
| Popular Unity (HB) | 186,646 | 16.86 | −0.83 | 4 | ±0 | |
| Basque Solidarity (EA) | 123,613 | 11.17 | New | 2 | +2 | |
| People's Party (PP)1 | 103,697 | 9.37 | −1.13 | 2 | ±0 | |
| Basque Country Left (EE) | 97,289 | 8.79 | −0.29 | 2 | ±0 | |
| Democratic and Social Centre (CDS) | 38,313 | 3.46 | −1.54 | 0 | ±0 | |
| United Left (IU/EB) | 33,323 | 3.01 | +1.76 | 0 | ±0 | |
| The Ecologist Greens (LVE) | 9,820 | 0.89 | New | 0 | ±0 | |
| Ruiz-Mateos Group (Ruiz-Mateos) | 7,765 | 0.70 | New | 0 | ±0 | |
| Workers' Party of the Basque Country–Basque Country Workers (PTE–EL)2 | 4,714 | 0.43 | −0.51 | 0 | ±0 | |
| Workers' Socialist Party (PST) | 3,388 | 0.31 | −0.08 | 0 | ±0 | |
| Communist Party of the Peoples of Spain (PCPE) | 1,047 | 0.09 | New | 0 | ±0 | |
| Ecologist Party of the Basque Country–Green List (PEE–(LV)) | 931 | 0.08 | New | 0 | ±0 | |
| Humanist Party (PH) | 882 | 0.08 | New | 0 | ±0 | |
| Revolutionary Workers' Party of Spain (PORE) | 863 | 0.08 | New | 0 | ±0 | |
| Spanish Phalanx of the CNSO (FE–JONS) | 753 | 0.07 | ±0.00 | 0 | ±0 | |
| Alliance for the Republic (AxR)3 | 664 | 0.06 | −0.07 | 0 | ±0 | |
| Communist Party of Spain (Marxist–Leninist) (PCE (m–l))4 | 0 | 0.00 | −0.13 | 0 | ±0 | |
| Revolutionary Communist League–Communist Movement (LKI–EMK)5 | 0 | 0.00 | ±0.00 | 0 | ±0 | |
| Blank ballots | 7,464 | 0.67 | +0.16 | |||
| Total | 1,106,941 | 21 | ±0 | |||
| Valid votes | 1,106,941 | 99.17 | +0.82 | |||
| Invalid votes | 9,247 | 0.83 | −0.82 | |||
| Votes cast / turnout | 1,116,188 | 66.90 | −0.68 | |||
| Abstentions | 552,220 | 33.10 | +0.68 | |||
| Registered voters | 1,668,408 | |||||
| Sources[2][3] | ||||||
Footnotes:
| ||||||
Canary Islands
| Parties and alliances | Popular vote | Seats | ||||
|---|---|---|---|---|---|---|
| Votes | % | ±pp | Total | +/− | ||
| Spanish Socialist Workers' Party (PSOE) | 242,035 | 36.10 | +0.04 | 7 | +1 | |
| People's Party (PP)1 | 130,043 | 19.39 | −3.91 | 3 | ±0 | |
| Democratic and Social Centre (CDS) | 117,897 | 17.58 | +0.68 | 3 | ±0 | |
| Canarian Independent Groups (AIC) | 64,767 | 9.66 | −0.16 | 1 | ±0 | |
| United Left–United Canarian Left (IU–ICU) | 53,364 | 7.96 | +3.65 | 0 | ±0 | |
| Canarian Nationalist Assembly (ACN)2 | 21,539 | 3.21 | −2.31 | 0 | ±0 | |
| Ruiz-Mateos Group (Ruiz-Mateos) | 10,117 | 1.51 | New | 0 | ±0 | |
| Independents of Gran Canaria (IGC) | 6,371 | 0.95 | New | 0 | ±0 | |
| The Greens–Green List (LV–LV) | 6,138 | 0.92 | +0.70 | 0 | ±0 | |
| The Ecologist Greens (LVE) | 4,693 | 0.70 | New | 0 | ±0 | |
| Workers' Socialist Party (PST) | 3,513 | 0.52 | −0.25 | 0 | ±0 | |
| Workers' Party of Spain–Communist Unity (PTE–UC) | 1,654 | 0.25 | New | 0 | ±0 | |
| Communist Party of the Canarian People (PCPC) | 1,500 | 0.22 | New | 0 | ±0 | |
| Seven Green Stars (SEV) | 1,411 | 0.21 | New | 0 | ±0 | |
| Humanist Party (PH) | 910 | 0.14 | New | 0 | ±0 | |
| Spanish Phalanx of the CNSO (FE–JONS) | 767 | 0.11 | −0.11 | 0 | ±0 | |
| Lanzarote Assembly (Tagoror) | 472 | 0.07 | New | 0 | ±0 | |
| Communist Party of Spain (Marxist–Leninist) (PCE (m–l))3 | 0 | 0.00 | −0.14 | 0 | ±0 | |
| Blank ballots | 3,348 | 0.50 | +0.12 | |||
| Total | 670,539 | 14 | +1 | |||
| Valid votes | 670,539 | 99.08 | +1.10 | |||
| Invalid votes | 6,207 | 0.92 | −1.10 | |||
| Votes cast / turnout | 676,746 | 62.15 | −6.13 | |||
| Abstentions | 412,187 | 37.85 | +6.13 | |||
| Registered voters | 1,088,933 | |||||
| Sources[2][3] | ||||||
Footnotes:
| ||||||
Cantabria
| Parties and alliances | Popular vote | Seats | ||||
|---|---|---|---|---|---|---|
| Votes | % | ±pp | Total | +/− | ||
| Spanish Socialist Workers' Party (PSOE) | 119,352 | 40.07 | −4.26 | 3 | ±0 | |
| People's Party (PP)1 | 114,403 | 38.41 | +4.35 | 2 | ±0 | |
| Democratic and Social Centre (CDS) | 28,976 | 9.73 | −3.23 | 0 | ±0 | |
| United Left (IU) | 19,058 | 6.40 | +3.31 | 0 | ±0 | |
| The Ecologist Greens (LVE) | 2,481 | 0.83 | New | 0 | ±0 | |
| Ruiz-Mateos Group (Ruiz-Mateos) | 2,208 | 0.74 | New | 0 | ±0 | |
| The Greens (LV) | 1,860 | 0.62 | New | 0 | ±0 | |
| Workers' Socialist Party (PST) | 1,727 | 0.58 | −0.01 | 0 | ±0 | |
| Workers' Party of Spain–Communist Unity (PTE–UC)2 | 1,291 | 0.43 | −0.83 | 0 | ±0 | |
| Communist Party of the Peoples of Spain (PCPE) | 1,132 | 0.38 | New | 0 | ±0 | |
| Radicals for Cantabria (RxC) | 904 | 0.30 | New | 0 | ±0 | |
| Spanish Phalanx of the CNSO (FE–JONS) | 868 | 0.29 | −0.23 | 0 | ±0 | |
| Humanist Party (PH) | 347 | 0.12 | New | 0 | ±0 | |
| Alliance for the Republic (AxR)3 | 256 | 0.09 | −0.18 | 0 | ±0 | |
| Asturianist Party (PAS) | 186 | 0.06 | New | 0 | ±0 | |
| Blank ballots | 2,824 | 0.95 | +0.14 | |||
| Total | 297,873 | 5 | ±0 | |||
| Valid votes | 297,873 | 98.92 | +0.99 | |||
| Invalid votes | 3,245 | 1.08 | −0.99 | |||
| Votes cast / turnout | 301,118 | 74.28 | +0.85 | |||
| Abstentions | 104,263 | 25.72 | −0.85 | |||
| Registered voters | 405,381 | |||||
| Sources[2][3] | ||||||
Footnotes:
| ||||||
Castile and León
| Parties and alliances | Popular vote | Seats | ||||
|---|---|---|---|---|---|---|
| Votes | % | ±pp | Total | +/− | ||
| People's Party (PP)1 | 597,206 | 40.25 | +4.43 | 18 | +4 | |
| Spanish Socialist Workers' Party (PSOE) | 527,551 | 35.55 | −3.24 | 14 | −2 | |
| Democratic and Social Centre (CDS) | 189,194 | 12.75 | −4.71 | 1 | −3 | |
| United Left (IU) | 98,699 | 6.65 | +4.15 | 0 | ±0 | |
| The Ecologist Greens (LVE) | 12,348 | 0.83 | New | 0 | ±0 | |
| Ruiz-Mateos Group (Ruiz-Mateos) | 9,684 | 0.65 | New | 0 | ±0 | |
| The Greens–Green List (LV–LV) | 8,597 | 0.58 | New | 0 | ±0 | |
| Workers' Socialist Party (PST) | 7,971 | 0.54 | +0.02 | 0 | ±0 | |
| Workers' Party of Spain–Communist Unity (PTE–UC)2 | 5,355 | 0.36 | −0.73 | 0 | ±0 | |
| Regionalist Party of the Leonese Country (PREPAL) | 2,962 | 0.20 | +0.03 | 0 | ±0 | |
| Communist Party of the Peoples of Spain (PCPE) | 2,697 | 0.18 | New | 0 | ±0 | |
| Spanish Phalanx of the CNSO (FE–JONS) | 2,172 | 0.15 | −0.14 | 0 | ±0 | |
| Humanist Party (PH) | 1,763 | 0.12 | New | 0 | ±0 | |
| Alliance for the Republic (AxR)3 | 1,369 | 0.09 | −0.02 | 0 | ±0 | |
| Nationalist Party of Castile and León (PANCAL) | 1,199 | 0.08 | −0.01 | 0 | ±0 | |
| Centrist Unity–Democratic Spanish Party (PED) | 285 | 0.02 | New | 0 | ±0 | |
| Communist Party of Spain (Marxist–Leninist) (PCE (m–l))4 | 0 | 0.00 | −0.20 | 0 | ±0 | |
| Blank ballots | 14,783 | 1.00 | +0.10 | |||
| Total | 1,483,835 | 33 | −1 | |||
| Valid votes | 1,483,835 | 98.90 | +0.90 | |||
| Invalid votes | 16,461 | 1.10 | −0.90 | |||
| Votes cast / turnout | 1,500,296 | 73.35 | +0.54 | |||
| Abstentions | 545,217 | 26.65 | −0.54 | |||
| Registered voters | 2,045,513 | |||||
| Sources[2][3] | ||||||
Footnotes:
| ||||||
Castilla–La Mancha
| Parties and alliances | Popular vote | Seats | ||||
|---|---|---|---|---|---|---|
| Votes | % | ±pp | Total | +/− | ||
| Spanish Socialist Workers' Party (PSOE) | 466,964 | 47.96 | +0.17 | 12 | ±0 | |
| People's Party (PP)1 | 328,714 | 33.76 | −1.05 | 8 | ±0 | |
| Democratic and Social Centre (CDS) | 75,298 | 7.73 | −1.99 | 0 | ±0 | |
| United Left (IU) | 67,727 | 6.96 | +2.88 | 0 | ±0 | |
| Ruiz-Mateos Group (Ruiz-Mateos) | 6,856 | 0.70 | New | 0 | ±0 | |
| The Ecologist Greens (LVE) | 4,791 | 0.49 | New | 0 | ±0 | |
| The Greens–Green List (LV–LV) | 4,634 | 0.48 | New | 0 | ±0 | |
| Workers' Socialist Party (PST) | 3,573 | 0.37 | +0.06 | 0 | ±0 | |
| Workers' Party of Spain–Communist Unity (PTE–UC)2 | 2,681 | 0.28 | −0.50 | 0 | ±0 | |
| Communist Party of the Peoples of Spain (PCPE) | 1,500 | 0.15 | New | 0 | ±0 | |
| Spanish Phalanx of the CNSO (FE–JONS) | 1,297 | 0.13 | −0.35 | 0 | ±0 | |
| Spanish Vertex Ecological Development Revindication (VERDE) | 1,143 | 0.12 | New | 0 | ±0 | |
| Humanist Party (PH) | 709 | 0.07 | New | 0 | ±0 | |
| Centrist Unity–Democratic Spanish Party (PED) | 681 | 0.07 | New | 0 | ±0 | |
| Alliance for the Republic (AxR)3 | 560 | 0.06 | −0.05 | 0 | ±0 | |
| Regionalist Party of Guadalajara (PRGU) | 426 | 0.04 | New | 0 | ±0 | |
| Communist Party of Spain (Marxist–Leninist) (PCE (m–l))4 | 0 | 0.00 | −0.15 | 0 | ±0 | |
| Blank ballots | 6,105 | 0.63 | +0.02 | |||
| Total | 973,659 | 20 | ±0 | |||
| Valid votes | 973,659 | 99.16 | +0.60 | |||
| Invalid votes | 8,209 | 0.84 | −0.60 | |||
| Votes cast / turnout | 981,868 | 76.44 | +1.35 | |||
| Abstentions | 302,642 | 23.56 | −1.35 | |||
| Registered voters | 1,284,510 | |||||
| Sources[2][3] | ||||||
Footnotes:
| ||||||
Catalonia
| Parties and alliances | Popular vote | Seats | ||||
|---|---|---|---|---|---|---|
| Votes | % | ±pp | Total | +/− | ||
| Socialists' Party of Catalonia (PSC–PSOE) | 1,123,975 | 35.59 | −5.41 | 20 | −1 | |
| Convergence and Union (CiU) | 1,032,243 | 32.68 | +0.68 | 18 | ±0 | |
| People's Party (PP)1 | 336,015 | 10.64 | −0.76 | 4 | −2 | |
| Initiative for Catalonia (IC)2 | 231,452 | 7.33 | +3.42 | 3 | +2 | |
| Democratic and Social Centre (CDS) | 136,518 | 4.32 | +0.20 | 1 | ±0 | |
| Republican Left of Catalonia (ERC) | 84,756 | 2.68 | +0.01 | 0 | ±0 | |
| Ruiz-Mateos Group (Ruiz-Mateos) | 37,942 | 1.20 | New | 0 | ±0 | |
| Party of the Communists of Catalonia (PCC) | 31,966 | 1.01 | −0.59 | 0 | ±0 | |
| Green Alternative–Ecologist Movement of Catalonia (AV–MEC)3 | 25,978 | 0.82 | +0.10 | 0 | ±0 | |
| The Ecologist Greens (EVE) | 24,406 | 0.77 | New | 0 | ±0 | |
| The Greens–Green List (EV–LV) | 19,444 | 0.62 | New | 0 | ±0 | |
| Workers' Party of Spain–Communist Unity (PTE–UC)4 | 13,137 | 0.42 | −0.15 | 0 | ±0 | |
| Workers' Socialist Party (PST) | 12,322 | 0.39 | +0.03 | 0 | ±0 | |
| Ecologist Party of Catalonia–VERDE (PEC–VERDE) | 10,054 | 0.32 | −0.05 | 0 | ±0 | |
| Social Democratic Coalition (CSD)5 | 6,435 | 0.20 | +0.05 | 0 | ±0 | |
| Revolutionary Workers' Party of Spain (PORE) | 3,022 | 0.10 | +0.02 | 0 | ±0 | |
| Humanist Party of Catalonia (PHC) | 2,653 | 0.08 | New | 0 | ±0 | |
| Spanish Phalanx of the CNSO (FE–JONS) | 2,506 | 0.08 | −0.03 | 0 | ±0 | |
| Centrist Unity–Democratic Spanish Party (PED) | 1,662 | 0.05 | +0.01 | 0 | ±0 | |
| Alliance for the Republic (AxR)6 | 1,619 | 0.05 | −0.06 | 0 | ±0 | |
| Valencian Nationalist Left–Valencian Regional Union (ENV–URV) | 890 | 0.03 | New | 0 | ±0 | |
| Communist Party of Spain (Marxist–Leninist) (PCE (m–l))7 | 0 | 0.00 | −0.11 | 0 | ±0 | |
| Blank ballots | 19,252 | 0.61 | +0.19 | |||
| Total | 3,158,247 | 46 | −1 | |||
| Valid votes | 3,158,247 | 99.44 | +0.29 | |||
| Invalid votes | 17,660 | 0.56 | −0.29 | |||
| Votes cast / turnout | 3,175,907 | 67.62 | −1.33 | |||
| Abstentions | 1,521,105 | 32.38 | +1.33 | |||
| Registered voters | 4,697,012 | |||||
| Sources[2][3] | ||||||
Footnotes:
| ||||||
Extremadura
| Parties and alliances | Popular vote | Seats | ||||
|---|---|---|---|---|---|---|
| Votes | % | ±pp | Total | +/− | ||
| Spanish Socialist Workers' Party (PSOE) | 330,869 | 53.90 | −1.98 | 7 | ±0 | |
| People's Party (PP)1 | 153,261 | 24.97 | −1.76 | 4 | ±0 | |
| Democratic and Social Centre (CDS) | 58,443 | 9.52 | +1.48 | 0 | ±0 | |
| United Left (IU) | 42,166 | 6.87 | +2.97 | 0 | ±0 | |
| United Extremadura (EU) | 10,984 | 1.79 | −0.88 | 0 | ±0 | |
| Ruiz-Mateos Group (Ruiz-Mateos) | 3,618 | 0.59 | New | 0 | ±0 | |
| The Ecologist Greens (LVE) | 2,196 | 0.36 | New | 0 | ±0 | |
| Workers' Socialist Party (PST) | 1,944 | 0.32 | +0.01 | 0 | ±0 | |
| The Greens–Green List (LV–LV) | 1,652 | 0.27 | New | 0 | ±0 | |
| Workers' Party of Spain–Communist Unity (PTE–UC)2 | 1,650 | 0.27 | −0.44 | 0 | ±0 | |
| Communist Party of the Peoples of Spain (PCPE) | 1,542 | 0.25 | New | 0 | ±0 | |
| Spanish Vertex Ecological Development Revindication (VERDE) | 1,211 | 0.20 | New | 0 | ±0 | |
| Spanish Phalanx of the CNSO (FE–JONS) | 796 | 0.13 | +0.04 | 0 | ±0 | |
| Humanist Party (PH) | 318 | 0.05 | New | 0 | ±0 | |
| Alliance for the Republic (AxR)3 | 266 | 0.04 | −0.07 | 0 | ±0 | |
| Blank ballots | 2,885 | 0.47 | −0.05 | |||
| Total | 613,801 | 11 | ±0 | |||
| Valid votes | 613,801 | 99.28 | +0.52 | |||
| Invalid votes | 4,464 | 0.72 | −0.52 | |||
| Votes cast / turnout | 618,265 | 75.57 | +1.99 | |||
| Abstentions | 199,878 | 24.43 | −1.99 | |||
| Registered voters | 818,143 | |||||
| Sources[2][3] | ||||||
Footnotes:
| ||||||
Galicia
| Parties and alliances | Popular vote | Seats | ||||
|---|---|---|---|---|---|---|
| Votes | % | ±pp | Total | +/− | ||
| People's Party (PP)1 | 519,168 | 39.02 | −0.17 | 14 | +1 | |
| Socialists' Party of Galicia (PSdeG–PSOE) | 459,750 | 34.56 | −1.20 | 12 | +1 | |
| Democratic and Social Centre (CDS) | 103,762 | 7.80 | −0.77 | 1 | −1 | |
| Galician Nationalist Bloc (BNG) | 47,763 | 3.59 | +1.48 | 0 | ±0 | |
| Galician Coalition (CG) | 45,821 | 3.44 | −2.80 | 0 | −1 | |
| United Left (EU) | 43,645 | 3.28 | +2.14 | 0 | ±0 | |
| Galician Socialist Party–Galician Left (PSG–EG) | 34,131 | 2.57 | −0.99 | 0 | ±0 | |
| Galician Nationalist Party–Galicianist Party (PNG–PG) | 14,411 | 1.08 | New | 0 | ±0 | |
| Ruiz-Mateos Group (Ruiz-Mateos) | 13,060 | 0.98 | New | 0 | ±0 | |
| Workers' Socialist Party (PST) | 6,980 | 0.52 | −0.12 | 0 | ±0 | |
| The Ecologist Greens (LVE) | 6,549 | 0.49 | New | 0 | ±0 | |
| The Greens–Green List (LV–LV) | 5,793 | 0.44 | New | 0 | ±0 | |
| Workers' Party of Spain–Communist Unity (PTE–UC)2 | 5,280 | 0.40 | −0.54 | 0 | ±0 | |
| Galician People's Front (FPG) | 3,657 | 0.27 | New | 0 | ±0 | |
| Communist Party of the Galician People (PCPG) | 1,801 | 0.14 | New | 0 | ±0 | |
| Spanish Vertex Ecological Development Revindication (VERDE) | 1,539 | 0.12 | +0.01 | 0 | ±0 | |
| Revolutionary Workers' Party of Spain (PORE) | 1,503 | 0.11 | New | 0 | ±0 | |
| Humanist Party (PH) | 1,482 | 0.11 | New | 0 | ±0 | |
| Spanish Phalanx of the CNSO (FE–JONS) | 1,429 | 0.11 | −0.07 | 0 | ±0 | |
| Asturianist Party (PAS) | 935 | 0.07 | New | 0 | ±0 | |
| Alliance for the Republic (AxR)3 | 590 | 0.04 | −0.04 | 0 | ±0 | |
| Communist Party of Spain (Marxist–Leninist) (PCE (m–l))4 | 0 | 0.00 | −0.17 | 0 | ±0 | |
| Blank ballots | 11,339 | 0.85 | +0.30 | |||
| Total | 1,330,388 | 27 | ±0 | |||
| Valid votes | 1,330,388 | 98.87 | +0.24 | |||
| Invalid votes | 15,265 | 1.13 | −0.24 | |||
| Votes cast / turnout | 1,345,653 | 60.13 | +2.24 | |||
| Abstentions | 892,320 | 39.87 | −2.24 | |||
| Registered voters | 2,237,973 | |||||
| Sources[2][3] | ||||||
Footnotes:
| ||||||
La Rioja
| Parties and alliances | Popular vote | Seats | ||||
|---|---|---|---|---|---|---|
| Votes | % | ±pp | Total | +/− | ||
| People's Party (PP)1 | 60,737 | 41.09 | +1.87 | 2 | ±0 | |
| Spanish Socialist Workers' Party (PSOE) | 58,678 | 39.70 | −4.22 | 2 | ±0 | |
| Democratic and Social Centre (CDS) | 10,620 | 7.18 | −2.90 | 0 | ±0 | |
| United Left (IU) | 9,495 | 6.42 | +4.42 | 0 | ±0 | |
| The Ecologist Greens (LVE) | 1,893 | 1.28 | New | 0 | ±0 | |
| Ruiz-Mateos Group (Ruiz-Mateos) | 1,823 | 1.23 | New | 0 | ±0 | |
| Workers' Socialist Party (PST) | 848 | 0.57 | New | 0 | ±0 | |
| Social Democratic Coalition (CSD) | 769 | 0.52 | New | 0 | ±0 | |
| Workers' Party of Spain–Communist Unity (PTE–UC)2 | 679 | 0.46 | −0.57 | 0 | ±0 | |
| Communist Party of the Peoples of Spain (PCPE) | 271 | 0.18 | New | 0 | ±0 | |
| Spanish Phalanx of the CNSO (FE–JONS) | 220 | 0.15 | −0.10 | 0 | ±0 | |
| Blank ballots | 1,775 | 1.20 | +0.28 | |||
| Total | 147,808 | 4 | ±0 | |||
| Valid votes | 147,808 | 99.11 | +1.07 | |||
| Invalid votes | 1,326 | 0.89 | −1.07 | |||
| Votes cast / turnout | 149,134 | 72.04 | −2.27 | |||
| Abstentions | 57,875 | 27.96 | +2.27 | |||
| Registered voters | 207,009 | |||||
| Sources[2][3] | ||||||
Footnotes:
| ||||||
Madrid
| Parties and alliances | Popular vote | Seats | ||||
|---|---|---|---|---|---|---|
| Votes | % | ±pp | Total | +/− | ||
| People's Party (PP)1 | 919,357 | 34.22 | +2.25 | 12 | +1 | |
| Spanish Socialist Workers' Party (PSOE) | 899,723 | 33.49 | −7.32 | 12 | −3 | |
| United Left (IU) | 414,392 | 15.42 | +9.39 | 5 | +3 | |
| Democratic and Social Centre (CDS) | 295,189 | 10.99 | −2.95 | 4 | −1 | |
| The Greens–Green List (LV–LV) | 30,495 | 1.14 | +0.42 | 0 | ±0 | |
| Ruiz-Mateos Group (Ruiz-Mateos) | 25,539 | 0.95 | New | 0 | ±0 | |
| The Ecologist Greens (LVE) | 23,996 | 0.89 | New | 0 | ±0 | |
| Workers' Party of Spain–Communist Unity (PTE–UC)2 | 11,621 | 0.43 | −2.04 | 0 | ±0 | |
| Workers' Socialist Party (PST) | 8,427 | 0.31 | −0.13 | 0 | ±0 | |
| Spanish Vertex Ecological Development Revindication (VERDE) | 4,963 | 0.18 | −0.10 | 0 | ±0 | |
| Spanish Phalanx of the CNSO (FE–JONS) | 3,657 | 0.14 | −0.16 | 0 | ±0 | |
| Regional Party of Madrid (PAM) | 3,396 | 0.13 | New | 0 | ±0 | |
| Group of Madrid Radicals (GRM) | 3,330 | 0.12 | New | 0 | ±0 | |
| Communist Party of the Peoples of Spain (PCPE) | 3,002 | 0.11 | New | 0 | ±0 | |
| Humanist Party (PH) | 1,973 | 0.07 | New | 0 | ±0 | |
| Liberal and Social Democratic Coalition (CSD y L) | 1,888 | 0.07 | New | 0 | ±0 | |
| Revolutionary Workers' Party of Spain (PORE) | 1,847 | 0.07 | −0.01 | 0 | ±0 | |
| Alliance for the Republic (AxR)3 | 1,632 | 0.06 | ±0.00 | 0 | ±0 | |
| Independent Citizen Group (ACI) | 1,359 | 0.05 | New | 0 | ±0 | |
| Centrist Unity–Democratic Spanish Party (PED) | 1,057 | 0.04 | New | 0 | ±0 | |
| Spanish Democratic Republican Action (ARDE) | 975 | 0.04 | New | 0 | ±0 | |
| Independent Spanish Phalanx (FEI) | 827 | 0.03 | New | 0 | ±0 | |
| Asturianist Party (PAS) | 767 | 0.03 | New | 0 | ±0 | |
| Communist Party of Spain (Marxist–Leninist) (PCE (m–l))4 | 0 | 0.00 | −0.08 | 0 | ±0 | |
| Blank ballots | 27,303 | 1.02 | +0.06 | |||
| Total | 2,686,715 | 33 | ±0 | |||
| Valid votes | 2,686,715 | 99.47 | +1.18 | |||
| Invalid votes | 14,227 | 0.53 | −1.18 | |||
| Votes cast / turnout | 2,700,942 | 72.72 | −1.18 | |||
| Abstentions | 1,012,999 | 27.28 | +1.18 | |||
| Registered voters | 3,713,941 | |||||
| Sources[2][3] | ||||||
Footnotes:
| ||||||
Murcia
| Parties and alliances | Popular vote | Seats | ||||
|---|---|---|---|---|---|---|
| Votes | % | ±pp | Total | +/− | ||
| Spanish Socialist Workers' Party (PSOE) | 256,107 | 46.06 | −2.79 | 5 | ±0 | |
| People's Party (PP)1 | 166,712 | 29.98 | −4.35 | 3 | ±0 | |
| Democratic and Social Centre (CDS) | 57,634 | 10.36 | +2.02 | 1 | +1 | |
| United Left (IU) | 51,105 | 9.19 | +4.67 | 0 | ±0 | |
| Ruiz-Mateos Group (Ruiz-Mateos) | 6,253 | 1.12 | New | 0 | ±0 | |
| The Ecologist Greens (LVE) | 3,905 | 0.70 | New | 0 | ±0 | |
| The Greens–Green List (LV–LV) | 3,589 | 0.65 | New | 0 | ±0 | |
| Workers' Socialist Party (PST) | 2,963 | 0.53 | +0.16 | 0 | ±0 | |
| Communist Party of the Peoples of Spain (PCPE) | 1,602 | 0.29 | New | 0 | ±0 | |
| Workers' Party of Spain–Communist Unity (PTE–UC)2 | 1,557 | 0.28 | −0.28 | 0 | ±0 | |
| Spanish Phalanx of the CNSO (FE–JONS) | 836 | 0.15 | −0.13 | 0 | ±0 | |
| Humanist Party (PH) | 633 | 0.11 | New | 0 | ±0 | |
| Alliance for the Republic (AxR)3 | 547 | 0.10 | −0.06 | 0 | ±0 | |
| Blank ballots | 2,640 | 0.47 | −0.02 | |||
| Total | 556,083 | 9 | +1 | |||
| Valid votes | 556,083 | 99.33 | +0.82 | |||
| Invalid votes | 3,741 | 0.67 | −0.82 | |||
| Votes cast / turnout | 559,824 | 74.25 | −0.41 | |||
| Abstentions | 194,156 | 25.75 | +0.41 | |||
| Registered voters | 753,980 | |||||
| Sources[2][3] | ||||||
Footnotes:
| ||||||
Navarre
| Parties and alliances | Popular vote | Seats | ||||
|---|---|---|---|---|---|---|
| Votes | % | ±pp | Total | +/− | ||
| Navarrese People's Union–People's Party (UPN–PP)1 | 92,216 | 33.18 | +3.55 | 3 | +1 | |
| Spanish Socialist Workers' Party (PSOE) | 86,677 | 31.19 | −4.33 | 2 | ±0 | |
| Popular Unity (HB) | 30,632 | 11.02 | −2.89 | 0 | −1 | |
| Democratic and Social Centre (CDS) | 19,538 | 7.03 | −2.53 | 0 | ±0 | |
| United Left (IU) | 15,979 | 5.75 | +4.20 | 0 | ±0 | |
| Basque Solidarity (EA) | 13,342 | 4.80 | New | 0 | ±0 | |
| Basque Country Left (EE) | 7,949 | 2.86 | +0.06 | 0 | ±0 | |
| Nationalists of Navarre (PNV–NV) | 2,562 | 0.92 | −0.89 | 0 | ±0 | |
| Ruiz-Mateos Group (Ruiz-Mateos) | 1,867 | 0.67 | New | 0 | ±0 | |
| Social Democratic Coalition (CSD) | 1,541 | 0.55 | New | 0 | ±0 | |
| Workers' Socialist Party (PST) | 1,105 | 0.40 | −0.04 | 0 | ±0 | |
| Workers' Party of Spain–Communist Unity (PTE–UC)2 | 510 | 0.18 | −0.39 | 0 | ±0 | |
| Communist Party of the Peoples of Spain (PCPE) | 333 | 0.12 | New | 0 | ±0 | |
| Alliance for the Republic (AxR)3 | 275 | 0.10 | −0.03 | 0 | ±0 | |
| Revolutionary Workers' Party of Spain (PORE) | 240 | 0.09 | New | 0 | ±0 | |
| Spanish Phalanx of the CNSO (FE–JONS) | 211 | 0.08 | New | 0 | ±0 | |
| Communist Party of Spain (Marxist–Leninist) (PCE (m–l))4 | 0 | 0.00 | −0.16 | 0 | ±0 | |
| Revolutionary Communist League–Communist Movement (LKI–EMK)5 | 0 | 0.00 | ±0.00 | 0 | ±0 | |
| Blank ballots | 2,960 | 1.06 | +0.07 | |||
| Total | 277,937 | 5 | ±0 | |||
| Valid votes | 277,937 | 99.21 | +1.19 | |||
| Invalid votes | 2,213 | 0.79 | −1.19 | |||
| Votes cast / turnout | 280,150 | 68.54 | −1.26 | |||
| Abstentions | 128,568 | 31.46 | +1.26 | |||
| Registered voters | 408,718 | |||||
| Sources[2][3] | ||||||
Footnotes:
| ||||||
Valencian Community
| Parties and alliances | Popular vote | Seats | ||||
|---|---|---|---|---|---|---|
| Votes | % | ±pp | Total | +/− | ||
| Spanish Socialist Workers' Party (PSOE) | 878,377 | 41.46 | −6.03 | 16 | −2 | |
| People's Party (PP)1 | 572,101 | 27.00 | −1.84 | 9 | −1 | |
| United Left–United Left of the Valencian Country (IU–EU) | 192,201 | 9.07 | +4.37 | 2 | +2 | |
| Democratic and Social Centre (CDS) | 166,231 | 7.85 | −0.93 | 2 | ±0 | |
| Valencian Union (UV) | 144,924 | 6.84 | +3.76 | 2 | +1 | |
| Valencian People's Union (UPV) | 40,767 | 1.92 | ±0.00 | 0 | ±0 | |
| The Greens–Green List (LV–LV) | 35,813 | 1.69 | +1.12 | 0 | ±0 | |
| Ruiz-Mateos Group (Ruiz-Mateos) | 21,925 | 1.03 | New | 0 | ±0 | |
| The Ecologist Greens (LVE) | 15,458 | 0.73 | New | 0 | ±0 | |
| Workers' Party of Spain–Communist Unity (PTE–UC)2 | 12,948 | 0.61 | −0.83 | 0 | ±0 | |
| Workers' Socialist Party (PST) | 6,786 | 0.32 | −0.09 | 0 | ±0 | |
| Social Democratic Coalition (CSD) | 4,613 | 0.22 | New | 0 | ±0 | |
| Communist Party of the Peoples of Spain (PCPE) | 4,026 | 0.19 | New | 0 | ±0 | |
| Spanish Phalanx of the CNSO (FE–JONS) | 3,098 | 0.15 | −0.09 | 0 | ±0 | |
| Valencian Nationalist Left–Valencian Regional Union (ENV–URV) | 2,098 | 0.10 | ±0.00 | 0 | ±0 | |
| Alliance for the Republic (AxR)3 | 1,920 | 0.09 | −0.02 | 0 | ±0 | |
| Green Movement (MV) | 1,368 | 0.06 | New | 0 | ±0 | |
| Humanist Party (PH) | 1,197 | 0.06 | New | 0 | ±0 | |
| Cantonalist Party of the Alicantine Country (Alicantón) | 1,041 | 0.05 | New | 0 | ±0 | |
| Spanish Vertex Ecological Development Revindication (VERDE) | 889 | 0.04 | −0.10 | 0 | ±0 | |
| Communist Party of Spain (Marxist–Leninist) (PCE (m–l))4 | 0 | 0.00 | −0.15 | 0 | ±0 | |
| Blank ballots | 11,024 | 0.52 | +0.04 | |||
| Total | 2,118,805 | 31 | ±0 | |||
| Valid votes | 2,118,805 | 99.43 | +1.59 | |||
| Invalid votes | 12,108 | 0.57 | −1.59 | |||
| Votes cast / turnout | 2,130,913 | 74.80 | −1.60 | |||
| Abstentions | 717,743 | 25.20 | +1.60 | |||
| Registered voters | 2,848,656 | |||||
| Sources[2][3] | ||||||
Footnotes:
| ||||||
Autonomous cities
Ceuta
| Parties and alliances | Popular vote | Seats | ||||
|---|---|---|---|---|---|---|
| Votes | % | ±pp | Total | +/− | ||
| Spanish Socialist Workers' Party (PSOE) | 8,643 | 37.71 | −7.52 | 1 | ±0 | |
| People's Party (PP)1 | 7,855 | 34.27 | −2.07 | 0 | ±0 | |
| United Ceuta (CEU) | 2,760 | 12.04 | New | 0 | ±0 | |
| Democratic and Social Centre (CDS) | 1,880 | 8.20 | +0.23 | 0 | ±0 | |
| The Greens–Green List (LV–LV) | 756 | 3.30 | New | 0 | ±0 | |
| Ruiz-Mateos Group (Ruiz-Mateos) | 605 | 2.64 | New | 0 | ±0 | |
| Workers' Socialist Party (PST) | 150 | 0.65 | +0.17 | 0 | ±0 | |
| Blank ballots | 270 | 1.18 | +0.62 | |||
| Total | 22,919 | 1 | ±0 | |||
| Valid votes | 22,919 | 99.08 | +0.42 | |||
| Invalid votes | 212 | 0.92 | −0.42 | |||
| Votes cast / turnout | 23,131 | 55.94 | −0.76 | |||
| Abstentions | 18,222 | 44.06 | +0.76 | |||
| Registered voters | 41,353 | |||||
| Sources[2][3] | ||||||
Footnotes:
| ||||||
Melilla
The results of the 1989 general election in Melilla were declared void by the Spanish Supreme Court because of perceived irregularities in the ballot counting process and the initial vote tally awarding the district's only seat to the Spanish Socialist Workers' Party being extremely close. A by-election was held on 25 March 1990, in which the district's seat was won by the People's Party by a wide margin, preventing the PSOE from commanding an overall majority in the Congress of Deputies.[9][10]
- Rerun vote
| Parties and alliances | Popular vote | Seats | ||||
|---|---|---|---|---|---|---|
| Votes | % | ±pp | Total | +/− | ||
| People's Party (PP) | 9,748 | 55.68 | +16.28 | 1 | +1 | |
| Spanish Socialist Workers' Party (PSOE) | 6,741 | 38.50 | −3.50 | 0 | −1 | |
| Democratic and Social Centre (CDS) | 316 | 1.80 | −6.64 | 0 | ±0 | |
| Spanish Nationalist Party of Melilla (PNEM) | 301 | 1.72 | −5.34 | 0 | ±0 | |
| Workers' Socialist Party (PST) | 130 | 0.74 | +0.07 | 0 | ±0 | |
| Communist Party of the Peoples of Spain (PCPE) | 115 | 0.66 | −0.39 | 0 | ±0 | |
| Blank ballots | 157 | 0.90 | −0.49 | |||
| Total | 17,508 | 1 | ±0 | |||
| Valid votes | 17,508 | 99.29 | +0.57 | |||
| Invalid votes | 126 | 0.71 | −0.57 | |||
| Votes cast / turnout | 17,634 | 51.89 | −6.06 | |||
| Abstentions | 16,351 | 48.11 | +6.06 | |||
| Registered voters | 33,985 | |||||
| Sources[2][3] | ||||||
- Annulled vote
| Parties and alliances | Popular vote | Seats | ||||
|---|---|---|---|---|---|---|
| Votes | % | ±pp | Total | +/− | ||
| Spanish Socialist Workers' Party (PSOE) | 8,178 | 42.00 | +6.35 | 1 | +1 | |
| People's Party (PP)1 | 7,671 | 39.40 | −6.54 | 0 | −1 | |
| Democratic and Social Centre (CDS) | 1,644 | 8.44 | −2.78 | 0 | ±0 | |
| Spanish Nationalist Party of Melilla (PNEM) | 1,374 | 7.06 | New | 0 | ±0 | |
| Communist Party of the Peoples of Spain (PCPE) | 204 | 1.05 | New | 0 | ±0 | |
| Workers' Socialist Party (PST) | 131 | 0.67 | New | 0 | ±0 | |
| Blank ballots | 270 | 1.39 | −0.07 | |||
| Total | 19,472 | 1 | ±0 | |||
| Valid votes | 19,472 | 98.72 | −0.16 | |||
| Invalid votes | 253 | 1.28 | +0.16 | |||
| Votes cast / turnout | 19,725 | 57.95 | −2.03 | |||
| Abstentions | 14,314 | 42.05 | +2.03 | |||
| Registered voters | 34,039 | |||||
| Sources[2][3][11] | ||||||
Footnotes:
| ||||||
Notes
- ↑ The autonomous cities of Ceuta and Melilla would not be constituted as independent administrative entities until 1995.
References
- ↑ "Resultados de Congreso 29 de octubre de 1989". elDiario.es (in Spanish). Retrieved 26 July 2025.
- 1 2 3 4 5 6 7 8 9 10 11 12 13 14 15 16 17 18 19 20 21 "Elecciones celebradas. Resultados electorales" (in Spanish). Ministry of the Interior. Retrieved 15 April 2022.
- 1 2 3 4 5 6 7 8 9 10 11 12 13 14 15 16 17 18 19 20 21 Lozano, Carles. "Elecciones Generales 29 de octubre de 1989". Historia Electoral.com (in Spanish). Retrieved 25 August 2025.
- ↑ "Resumen de los resultados de las Elecciones para el Congreso de los Diputados convocadas por Real Decreto 1047/1989, de 1 de septiembre, y celebradas el 29 de octubre de 1989, según los datos que figuran en las actas de escrutinio general remitidas por cada una de las Juntas Electorales Provinciales" (PDF). Official State Gazette (in Spanish) (294): 38218–38242. 8 December 1989. ISSN 0212-033X. Retrieved 19 October 2025.
- ↑ "Corrección de errores del resumen de los resultados de las elecciones al Congreso de los Diputados, convocadas por Real Decreto 1047/1989, de 1 de septiembre, y celebradas el 29 de octubre de 1989, según los datos que figuran en las actas de escrutinio general remitidas por cada una de las Juntas Electorales Provinciales" (PDF). Official State Gazette (in Spanish) (306): 39793–39799. 22 December 1989. ISSN 0212-033X. Retrieved 19 October 2025.
- ↑ "Corrección de errores del resumen de los resultados de las Elecciones al Congreso de los Diputados convocadas por Real Decreto 1047/1989, de 1 de septiembre, y celebradas el 29 de octubre de 1989, según los datos que figuran en las actas de escrutinio general remitidas por cada una de las Juntas Electorales Provinciales" (PDF). Official State Gazette (in Spanish) (18): 1906. 20 January 1990. ISSN 0212-033X. Retrieved 19 October 2025.
- ↑ "Resultados de las elecciones al Congreso de los Diputados y al Senado celebradas el 29 de octubre de 1989, en las circunscripciones de Murcia y Pontevedra, así como los del acto de votación para ambas Cámaras celebrado en Melilla el 25 de marzo de 1990" (PDF). Official State Gazette (in Spanish) (125): 14457–14458. 25 May 1990. ISSN 0212-033X. Retrieved 19 October 2025.
- ↑ "Cuadros-resumen de resultados de las Elecciones al Congreso de los Diputados celebradas el 29 de octubre de 1989, así como del acto de votación para ambas Cámaras celebrado en Melilla el 25 de marzo de 1990" (PDF). Official State Gazette (in Spanish) (148): 17476–17483. 21 June 1990. ISSN 0212-033X. Retrieved 19 October 2025.
- ↑ De la Cuadra, Bonifacio (20 February 1990). "Melilla repetirá las elecciones legislativas". El País (in Spanish). Madrid. Retrieved 8 March 2017.
- ↑ Grijelmo, Álex (26 March 1990). "La derecha agrupó sus votos para vencer al PSOE". El País (in Spanish). Melilla. Retrieved 9 March 2017.
- ↑ "1989 general election" (in Spanish). La Vanguardia. 31 October 1989. Retrieved 24 September 2017.
| General elections |
| ||||||
|---|---|---|---|---|---|---|---|
| Presidential elections | |||||||
| European elections | |||||||
| Local elections |
| ||||||
| Regional elections | |||||||
| Referendums | |||||||
| |||||||