2020 Washington Secretary of State election
 | |||||||||||||||||
November 3, 2020
| |||||||||||||||||
| |||||||||||||||||
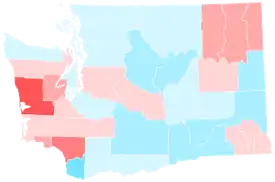
   Wyman: 40–50% 50–60% 60–70% 70–80% 80–90% >90% Tarleton: 40–50% 50–60% 60–70% 70–80% 80–90% >90% Tie: 40–50% 50% No data | |||||||||||||||||
| |||||||||||||||||


| Elections in Washington (state) |
|---|
 |
The 2020 Washington Secretary of State election was held on November 3, 2020. Incumbent Republican Kim Wyman won reelection over Democratic nominee Gael Tarleton, the two having received the most votes in an August 2020 primary election.[1] Wyman became the only Republican to hold statewide office in Washington and the entire West Coast.[2] As of 2026, this was the last time a Republican won a statewide election in Washington.
Primary election
Endorsements
Kim Wyman (R)
- Statewide officials
- Bruce Chapman, former secretary of state of Washington (1975–1981)[3]
- Ralph Munro, former secretary of state of Washington (1981–2001)[3]
- Sam Reed, former secretary of state of Washington (2001–2013)[3]
Newspapers
Gael Tarleton (D)
- U.S. senators
- Maria Cantwell, Washington (2001–present)[3]
- Patty Murray, Washington (1993–present)[3]
- Statewide officials
- Bob Ferguson, attorney general of Washington (2013–2025)[5]
- Jay Inslee, governor of Washington (2013–2025)[3]
| No. | Date | Host | Moderator | Link | Republican | Democratic | Progressive | Independent |
|---|---|---|---|---|---|---|---|---|
| Key: P Participant A Absent N Not invited I Invited W Withdrawn |
||||||||
| Kim Wyman | Gael Tarleton | Gentry Lange | Ed Minger | |||||
| 1 | Jul. 20, 2020 | KSPS League of Women Voters of Washington The Spokesman-Review |
Kristi Gorenson | YouTube | P | P | P | P |
Results

Wyman
- 50–60%
- 60–70%
- 70–80%
- 80–90%
Tarleton
- 40–50%
- 50–60%
- 60–70%

Wyman
- 50–60%
- 60–70%
Tarleton
- 40–50%
- 50–60%
- 60–70%
| Party | Candidate | Votes | % | |
|---|---|---|---|---|
| Republican | Kim Wyman (incumbent) | 1,238,455 | 50.89% | |
| Democratic | Gael Tarleton | 1,053,584 | 43.29% | |
| Independent | Ed Minger | 87,982 | 3.62% | |
| Progressive | Gentry Lange | 51,826 | 2.13% | |
| Write-in | 1,919 | 0.08% | ||
| Total votes | 2,433,766 | 100.00% | ||
By county
| County[7] | Kim Wyman
Republican |
Gael Tarleton
Democratic |
Various candidates
Other parties |
Margin | Total votes | ||||
|---|---|---|---|---|---|---|---|---|---|
| # | % | # | % | # | % | # | % | ||
| Adams | 2,640 | 78.22% | 590 | 17.48% | 145 | 4.30% | 2,050 | 60.74% | 3,375 |
| Asotin | 4,451 | 65.85% | 1,910 | 28.26% | 398 | 5.89% | 2,541 | 37.59% | 6,759 |
| Benton | 41,594 | 68.07% | 15,922 | 26.06% | 3,592 | 5.88% | 25,672 | 42.01% | 61,108 |
| Chelan | 18,239 | 66.24% | 7,902 | 28.70% | 1,395 | 5.07% | 10,337 | 37.54% | 27,536 |
| Clallam | 17,138 | 53.71% | 12,892 | 40.40% | 1,881 | 5.89% | 4,246 | 13.31% | 31,911 |
| Clark | 79,412 | 53.12% | 60,747 | 40.64% | 9,334 | 6.24% | 18,665 | 12.49% | 149,493 |
| Columbia | 1,252 | 76.25% | 320 | 19.49% | 70 | 4.26% | 932 | 56.76% | 1,642 |
| Cowlitz | 22,095 | 61.30% | 11,362 | 31.52% | 2,585 | 7.17% | 10,733 | 29.78% | 36,042 |
| Douglas | 9,656 | 72.68% | 2,980 | 22.43% | 649 | 4.89% | 6,676 | 50.25% | 13,285 |
| Ferry | 2,111 | 67.49% | 850 | 27.17% | 167 | 5.34% | 1,261 | 40.31% | 3,128 |
| Franklin | 12,414 | 67.78% | 4,892 | 26.71% | 1,009 | 5.51% | 7,522 | 41.07% | 18,315 |
| Garfield | 778 | 78.74% | 163 | 16.50% | 47 | 4.76% | 615 | 62.25% | 988 |
| Grant | 16,490 | 75.09% | 4,214 | 19.19% | 1,256 | 5.72% | 12,276 | 55.90% | 21,960 |
| Grays Harbor | 14,445 | 60.32% | 7,888 | 32.94% | 1,613 | 6.74% | 6,557 | 27.38% | 23,946 |
| Island | 18,497 | 51.86% | 15,183 | 42.57% | 1,989 | 5.58% | 3,314 | 9.29% | 35,669 |
| Jefferson | 6,464 | 37.80% | 9,597 | 56.12% | 1,041 | 6.09% | -3,133 | -18.32% | 17,102 |
| King | 273,994 | 37.42% | 422,227 | 57.67% | 35,942 | 4.91% | -148,233 | -20.25% | 732,163 |
| Kitsap | 48,724 | 50.82% | 40,893 | 42.65% | 6,258 | 6.53% | 7,831 | 8.17% | 95,875 |
| Kittitas | 10,384 | 65.27% | 4,534 | 28.50% | 992 | 6.24% | 5,850 | 36.77% | 15,910 |
| Klickitat | 4,924 | 59.63% | 2,831 | 34.29% | 502 | 6.08% | 2,093 | 25.35% | 8,257 |
| Lewis | 22,192 | 73.90% | 6,119 | 20.38% | 1,717 | 5.72% | 16,073 | 53.53% | 30,028 |
| Lincoln | 3,818 | 80.58% | 736 | 15.53% | 184 | 3.88% | 3,082 | 65.05% | 4,738 |
| Mason | 14,399 | 60.94% | 7,567 | 32.02% | 1,663 | 7.04% | 6,832 | 28.91% | 23,629 |
| Okanogan | 8,452 | 62.55% | 4,330 | 32.05% | 730 | 5.40% | 4,122 | 30.51% | 13,512 |
| Pacific | 4,993 | 54.56% | 3,586 | 39.19% | 572 | 6.25% | 1,407 | 15.38% | 9,151 |
| Pend Oreille | 3,682 | 69.60% | 1,279 | 24.18% | 329 | 6.22% | 2,403 | 45.43% | 5,290 |
| Pierce | 148,111 | 55.34% | 101,989 | 38.11% | 17,537 | 6.55% | 46,122 | 17.23% | 267,637 |
| San Juan | 2,872 | 32.24% | 5,525 | 62.02% | 511 | 5.74% | -2,653 | -29.78% | 8,908 |
| Skagit | 25,636 | 55.66% | 17,797 | 38.64% | 2,625 | 5.70% | 7,839 | 17.02% | 46,058 |
| Skamania | 2,386 | 57.26% | 1,530 | 36.72% | 251 | 6.02% | 856 | 20.54% | 4,167 |
| Snohomish | 130,108 | 51.03% | 107,388 | 42.12% | 17,464 | 6.85% | 22,720 | 8.91% | 254,960 |
| Spokane | 95,637 | 58.40% | 58,530 | 35.74% | 9,586 | 5.85% | 37,107 | 22.66% | 163,753 |
| Stevens | 13,550 | 74.25% | 3,678 | 20.15% | 1,021 | 5.59% | 9,872 | 54.10% | 18,249 |
| Thurston | 61,034 | 58.03% | 37,716 | 35.86% | 6,435 | 6.12% | 23,318 | 22.17% | 105,185 |
| Wahkiakum | 1,200 | 60.70% | 654 | 33.08% | 123 | 6.22% | 546 | 27.62% | 1,977 |
| Walla Walla | 12,027 | 61.55% | 6,303 | 32.26% | 1,210 | 6.19% | 5,724 | 29.29% | 19,540 |
| Whatcom | 42,486 | 46.82% | 42,742 | 47.10% | 5,513 | 6.08% | -256 | -0.28% | 90,741 |
| Whitman | 6,273 | 56.18% | 4,095 | 36.68% | 797 | 7.14% | 2,178 | 19.51% | 11,165 |
| Yakima | 33,897 | 66.97% | 14,123 | 27.90% | 2,594 | 5.13% | 19,774 | 39.07% | 50,614 |
| Totals | 1,238,455 | 50.89% | 1,053,584 | 43.29% | 141,727 | 5.82% | 184,871 | 7.60% | 2,433,766 |


By congressional district
| District[8] | Wyman | Tarleton | Representative |
|---|---|---|---|
| 1st | 53% | 42% | Suzan DelBene |
| 2nd | 46% | 47% | Rick Larsen |
| 3rd | 58% | 36% | Jaime Herrera Beutler |
| 4th | 69% | 26% | Dan Newhouse |
| 5th | 61% | 33% | Cathy McMorris Rodgers |
| 6th | 51% | 43% | Derek Kilmer |
| 7th | 28% | 67% | Pramila Jayapal |
| 8th | 59% | 35% | Kim Schrier |
| 9th | 38% | 57% | Adam Smith |
| 10th | 56% | 37% | Denny Heck |
General election
Predictions
| Source | Ranking | As of |
|---|---|---|
| The Cook Political Report[9] | Lean R | June 25, 2020 |
Debate
| No. | Date | Host | Moderator | Link | Republican | Democratic |
|---|---|---|---|---|---|---|
| Key: P Participant A Absent N Not invited I Invited W Withdrawn |
||||||
| Kim Wyman | Gael Tarleton | |||||
| 1 | Sep. 19, 2020 | League of Women Voters of Washington The Spokesman-Review |
Jim Camden | YouTube | P | P |
Polling
Graphical summary
| Poll source | Date(s) administered |
Sample size[a] |
Margin of error |
Kim Wyman (R) |
Gael Tarleton (D) |
Undecided |
|---|---|---|---|---|---|---|
| Public Policy Polling[10] | October 14–15, 2020 | 610 (LV) | ± 4% | 49% | 43% | 8% |
| SurveyUSA[11] | October 8–10, 2020 | 591 (LV) | ± 5.2% | 45% | 40% | 14% |
Results
| Party | Candidate | Votes | % | ±% | |
|---|---|---|---|---|---|
| Republican | Kim Wyman (incumbent) | 2,116,141 | 53.61% | –1.13% | |
| Democratic | Gael Tarleton | 1,826,710 | 46.27% | +1.01% | |
| Write-in | 4,666 | 0.12% | N/A | ||
| Total votes | 3,947,517 | 100.00% | N/A | ||
| Republican hold | |||||
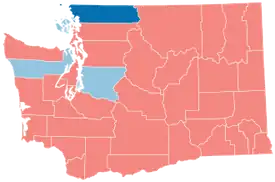
By county
| County[13] | Kim Wyman
Republican |
Gael Tarleton
Democratic |
Write-in
Various |
Margin | Total votes | ||||
|---|---|---|---|---|---|---|---|---|---|
| # | % | # | % | # | % | # | % | ||
| Adams | 4,188 | 73.73% | 1,473 | 25.93% | 19 | 0.33% | 2,715 | 47.80% | 5,680 |
| Asotin | 7,935 | 68.70% | 3,587 | 31.06% | 28 | 0.24% | 4,348 | 37.65% | 11,550 |
| Benton | 69,494 | 69.99% | 29,698 | 29.91% | 106 | 0.11% | 39,796 | 40.08% | 99,298 |
| Chelan | 27,338 | 65.19% | 14,565 | 34.73% | 33 | 0.08% | 12,773 | 30.46% | 41,936 |
| Clallam | 27,675 | 57.77% | 20,181 | 42.13% | 50 | 0.10% | 7,494 | 15.64% | 47,906 |
| Clark | 148,502 | 56.58% | 113,626 | 43.29% | 329 | 0.13% | 34,876 | 13.29% | 262,457 |
| Columbia | 1,880 | 78.11% | 525 | 21.81% | 2 | 0.08% | 1,355 | 56.29% | 2,407 |
| Cowlitz | 37,669 | 65.02% | 20,199 | 34.87% | 64 | 0.11% | 17,470 | 30.16% | 57,932 |
| Douglas | 14,630 | 70.83% | 5,999 | 29.05% | 25 | 0.12% | 8,631 | 41.79% | 20,654 |
| Ferry | 2,949 | 70.16% | 1,246 | 29.65% | 8 | 0.19% | 1,703 | 40.52% | 4,203 |
| Franklin | 20,478 | 64.74% | 11,115 | 35.14% | 36 | 0.11% | 9,363 | 29.60% | 31,629 |
| Garfield | 1,113 | 78.55% | 301 | 21.24% | 3 | 0.21% | 812 | 57.30% | 1,417 |
| Grant | 26,794 | 73.15% | 9,764 | 26.66% | 70 | 0.19% | 17,030 | 46.49% | 36,628 |
| Grays Harbor | 23,509 | 62.82% | 13,854 | 37.02% | 57 | 0.15% | 9,655 | 25.80% | 37,420 |
| Island | 29,295 | 56.06% | 22,895 | 43.82% | 63 | 0.12% | 6,400 | 12.25% | 52,253 |
| Jefferson | 10,063 | 41.42% | 14,217 | 58.52% | 14 | 0.06% | -4,154 | -17.10% | 24,294 |
| King | 482,387 | 41.36% | 682,761 | 58.54% | 1,189 | 0.10% | -200,374 | -17.18% | 1,166,337 |
| Kitsap | 83,886 | 54.57% | 69,638 | 45.30% | 205 | 0.13% | 14,248 | 9.27% | 153,729 |
| Kittitas | 17,007 | 66.67% | 8,487 | 33.27% | 17 | 0.07% | 8,520 | 33.40% | 25,511 |
| Klickitat | 8,022 | 61.36% | 5,025 | 38.44% | 26 | 0.20% | 2,997 | 22.93% | 13,073 |
| Lewis | 32,661 | 74.07% | 11,353 | 25.75% | 79 | 0.18% | 21,308 | 48.33% | 44,093 |
| Lincoln | 5,485 | 79.84% | 1,378 | 20.06% | 7 | 0.10% | 4,107 | 59.78% | 6,870 |
| Mason | 22,891 | 63.28% | 13,216 | 36.53% | 69 | 0.19% | 9,675 | 26.74% | 36,176 |
| Okanogan | 12,949 | 62.80% | 7,651 | 37.11% | 18 | 0.09% | 5,298 | 25.70% | 20,618 |
| Pacific | 7,935 | 58.13% | 5,685 | 41.65% | 31 | 0.23% | 2,250 | 16.48% | 13,651 |
| Pend Oreille | 5,992 | 72.48% | 2,261 | 27.35% | 14 | 0.17% | 3,731 | 45.13% | 8,267 |
| Pierce | 257,698 | 57.28% | 191,684 | 42.61% | 498 | 0.11% | 66,014 | 14.67% | 449,880 |
| San Juan | 4,670 | 36.58% | 8,089 | 63.35% | 9 | 0.07% | -3,419 | -26.78% | 12,768 |
| Skagit | 40,861 | 58.09% | 29,398 | 41.79% | 81 | 0.12% | 11,463 | 16.30% | 70,340 |
| Skamania | 4,251 | 60.23% | 2,793 | 39.57% | 14 | 0.20% | 1,458 | 20.66% | 7,058 |
| Snohomish | 230,222 | 54.14% | 194,563 | 45.75% | 464 | 0.11% | 35,659 | 8.39% | 425,249 |
| Spokane | 171,171 | 60.34% | 112,056 | 39.50% | 462 | 0.16% | 59,115 | 20.84% | 283,689 |
| Stevens | 20,963 | 75.83% | 6,656 | 24.08% | 27 | 0.10% | 14,307 | 51.75% | 27,646 |
| Thurston | 97,311 | 59.64% | 65,627 | 40.22% | 224 | 0.14% | 31,684 | 19.42% | 163,162 |
| Wahkiakum | 1,872 | 65.39% | 984 | 34.37% | 7 | 0.24% | 888 | 31.02% | 2,863 |
| Walla Walla | 19,728 | 65.35% | 10,430 | 34.55% | 32 | 0.11% | 9,298 | 30.80% | 30,190 |
| Whatcom | 65,592 | 48.41% | 69,728 | 51.46% | 171 | 0.13% | -4,136 | -3.05% | 135,491 |
| Whitman | 11,290 | 55.58% | 8,994 | 44.28% | 29 | 0.14% | 2,296 | 11.30% | 20,313 |
| Yakima | 57,785 | 62.22% | 35,008 | 37.69% | 86 | 0.09% | 22,777 | 24.52% | 92,879 |
| Totals | 2,116,141 | 53.61% | 1,826,710 | 46.27% | 4,666 | 0.12% | 289,431 | 7.33% | 3,947,517 |
Counties that flipped from Republican to Democratic
- Whatcom (largest city: Bellingham)

By congressional district
Wyman won seven of ten congressional districts, including four that elected Democrats.[14]
| District | Wyman | Tarleton | Representative |
|---|---|---|---|
| 1st | 55% | 45% | Suzan DelBene |
| 2nd | 49% | 51% | Rick Larsen |
| 3rd | 60% | 40% | Jaime Herrera Beutler |
| 4th | 67% | 33% | Dan Newhouse |
| 5th | 63% | 37% | Cathy McMorris Rodgers |
| 6th | 54% | 46% | Derek Kilmer |
| 7th | 32% | 68% | Pramila Jayapal |
| 8th | 61% | 39% | Kim Schrier |
| 9th | 41% | 59% | Adam Smith |
| 10th | 58% | 42% | Denny Heck |
| Marilyn Strickland |
Notes
- ↑ Key:
A – all adults
RV – registered voters
LV – likely voters
V – unclear
References
- ↑ Primary results
- ↑ Santos, Melissa (November 11, 2020). "How Republican Kim Wyman keeps winning in blue Washington state". Cascade PBS. Retrieved September 5, 2024.
- 1 2 3 4 5 6 O'Sullivan, Joseph (December 9, 2019). "Election security is front and center as Washington Secretary of State Kim Wyman and challenger Gael Tarleton face off". The Seattle Times. Archived from the original on August 18, 2025. Retrieved August 24, 2026.
- ↑ Editorial Board, The Seattle Times (July 2, 2020). "The Times recommends: Kim Wyman for Secretary of State". The Seattle Times. Archived from the original on October 20, 2022. Retrieved October 22, 2025.
- ↑ O'Sullivan, Joseph (December 9, 2019). "Seattle state Rep. Gael Tarleton to announce run for Washington secretary of state". The Seattle Times. Archived from the original on July 24, 2025. Retrieved August 24, 2026.
Tarleton starts her campaign with the endorsement of Democratic Attorney General Bob Ferguson.
- ↑ Wyman, Kim (August 21, 2020). "Canvass of the Returns of the Primary Held on August 4, 2020" (PDF). Secretary of State of Washington. Archived (PDF) from the original on March 15, 2025. Retrieved July 15, 2025.
- ↑ Wyman, Kim (August 4, 2020). "Secretary of State - County Results". Secretary of State of Washington. Archived from the original on December 21, 2025. Retrieved August 24, 2026.
- ↑ "Congressional and Legislative District Breakdowns". sos.wa.gov. Archived from the original on March 19, 2025.
- ↑ "An Updated Look at Handicapping the 2020 Secretary of State Elections". The Cook Political Report. Retrieved September 13, 2019.
- ↑ Public Policy Polling
- ↑ SurveyUSA
- ↑ Wyman, Kim (December 1, 2020). "Canvass of the Returns of the General Election Held on November 3, 2020" (PDF). Secretary of State of Washington. Archived (PDF) from the original on June 29, 2025. Retrieved July 15, 2025.
- ↑ Wyman, Kim (November 3, 2020). "Secretary of State - County Results". Secretary of State of Washington. Archived from the original on June 16, 2025. Retrieved August 6, 2025.
- ↑ "2020Gen Results by Congressional District" (PDF). sos.wa.gov. Archived (PDF) from the original on July 22, 2024.