2008 Washington Secretary of State election
 | |||||||||||||||||
November 4, 2008
| |||||||||||||||||
| |||||||||||||||||
  Reed: 50–60% 60–70% 70–80% Osgood: 50–60% | |||||||||||||||||
| |||||||||||||||||


| Elections in Washington (state) |
|---|
 |
The 2008 Washington Secretary of State election was held on Tuesday, November 4, 2008, to elect the Washington Secretary of State, concurrently with the 2008 U.S. presidential election, as well as elections to the U.S. Senate and various state and local elections, including for U.S. House and governor of Washington. Washington is one of two states that holds a top-two primary, meaning that all candidates are listed on the same ballot regardless of party affiliation, and the top two move on to the general election.
Incumbent Republican Secretary of State Sam Reed was re-elected to a third term in office, defeating Democratic challenger Jason Osgood in a landslide.[1] Along with the concurrent attorney general election, this is the last time King County voted Republican in a statewide election against a Democratic opponent.[a]
Candidates
Republican Party
Advanced to general
Democratic Party
Advanced to general
- Jason Osgood, computer programmer[2]
Third-party and independent candidates
Eliminated in primary
Primary election
Endorsements
Newspapers
Results

- 40–50%
- 50–60%
- 60–70%
- 70–80%

- 40–50%
- 50–60%
- 60–70%
| Party | Candidate | Votes | % | |
|---|---|---|---|---|
| Republican | Sam Reed (incumbent) | 816,171 | 59.40 | |
| Democratic | Jason Osgood | 446,222 | 32.48 | |
| Constitution | Marilyn Montgomery | 88,728 | 6.46 | |
| Independent | Mark Greene | 22,800 | 1.66 | |
| Total votes | 1,373,921 | 100.00 | ||
By county
| County[5] | Sam Reed
Republican |
Jason Osgood
Democratic |
Various candidates
Other parties |
Margin | Total votes | ||||
|---|---|---|---|---|---|---|---|---|---|
| # | % | # | % | # | % | # | % | ||
| Adams | 1,896 | 72.84% | 443 | 17.02% | 264 | 10.14% | 1,453 | 55.82% | 2,603 |
| Asotin | 2,999 | 56.86% | 1,675 | 31.76% | 600 | 11.38% | 1,324 | 25.10% | 5,274 |
| Benton | 26,562 | 69.16% | 8,322 | 21.67% | 3,522 | 9.17% | 18,240 | 47.49% | 38,406 |
| Chelan | 11,623 | 68.35% | 3,926 | 23.09% | 1,457 | 8.57% | 7,697 | 45.26% | 17,006 |
| Clallam | 13,117 | 59.69% | 7,066 | 32.15% | 1,793 | 8.16% | 6,051 | 27.53% | 21,976 |
| Clark | 41,605 | 57.14% | 24,568 | 33.74% | 6,645 | 9.13% | 17,037 | 23.40% | 72,818 |
| Columbia | 1,008 | 69.23% | 290 | 19.92% | 158 | 10.85% | 718 | 49.31% | 1,456 |
| Cowlitz | 11,347 | 52.35% | 8,156 | 37.63% | 2,174 | 10.03% | 3,191 | 14.72% | 21,677 |
| Douglas | 5,862 | 69.27% | 1,860 | 21.98% | 740 | 8.74% | 4,002 | 47.29% | 8,462 |
| Ferry | 1,205 | 60.16% | 540 | 26.96% | 258 | 12.88% | 665 | 33.20% | 2,003 |
| Franklin | 7,373 | 67.21% | 2,517 | 22.94% | 1,080 | 9.85% | 4,856 | 44.27% | 10,970 |
| Garfield | 536 | 70.53% | 144 | 18.95% | 80 | 10.53% | 392 | 51.58% | 760 |
| Grant | 9,661 | 65.05% | 3,464 | 23.32% | 1,727 | 11.63% | 6,197 | 41.73% | 14,852 |
| Grays Harbor | 9,713 | 56.71% | 6,002 | 35.04% | 1,414 | 8.26% | 3,711 | 21.67% | 17,129 |
| Island | 14,657 | 60.78% | 7,562 | 31.36% | 1,895 | 7.86% | 7,095 | 29.42% | 24,114 |
| Jefferson | 6,185 | 48.71% | 5,501 | 43.32% | 1,012 | 7.97% | 684 | 5.39% | 12,698 |
| King | 193,398 | 56.58% | 128,284 | 37.53% | 20,127 | 5.89% | 65,114 | 19.05% | 341,809 |
| Kitsap | 38,168 | 58.64% | 21,738 | 33.40% | 5,178 | 7.96% | 16,430 | 25.24% | 65,084 |
| Kittitas | 6,278 | 64.73% | 2,501 | 25.79% | 920 | 9.49% | 3,777 | 38.94% | 9,699 |
| Klickitat | 2,816 | 54.53% | 1,805 | 34.95% | 543 | 10.52% | 1,011 | 19.58% | 5,164 |
| Lewis | 12,803 | 66.57% | 4,270 | 22.20% | 2,160 | 11.23% | 8,533 | 44.37% | 19,233 |
| Lincoln | 2,693 | 70.66% | 712 | 18.68% | 406 | 10.65% | 1,981 | 51.98% | 3,811 |
| Mason | 10,282 | 60.76% | 5,193 | 30.69% | 1,447 | 8.55% | 5,089 | 30.07% | 16,922 |
| Okanogan | 5,352 | 61.90% | 2,352 | 27.20% | 942 | 10.90% | 3,000 | 34.70% | 8,646 |
| Pacific | 3,429 | 51.47% | 2,607 | 39.13% | 626 | 9.40% | 822 | 12.34% | 6,662 |
| Pend Oreille | 2,202 | 58.22% | 1,026 | 27.13% | 554 | 14.65% | 1,176 | 31.09% | 3,782 |
| Pierce | 87,434 | 59.92% | 47,057 | 32.25% | 11,437 | 7.84% | 40,377 | 27.67% | 145,928 |
| San Juan | 3,245 | 49.93% | 2,732 | 42.04% | 522 | 8.03% | 513 | 7.89% | 6,499 |
| Skagit | 17,924 | 60.33% | 9,320 | 31.37% | 2,464 | 8.29% | 8,604 | 28.96% | 29,708 |
| Skamania | 1,293 | 53.19% | 885 | 36.40% | 253 | 10.41% | 408 | 16.78% | 2,431 |
| Snohomish | 80,856 | 57.13% | 48,957 | 34.59% | 11,715 | 8.28% | 31,899 | 22.54% | 141,528 |
| Spokane | 62,025 | 58.27% | 32,514 | 30.55% | 11,900 | 11.18% | 29,511 | 27.73% | 106,439 |
| Stevens | 7,665 | 61.64% | 2,870 | 23.08% | 1,900 | 15.28% | 4,795 | 38.56% | 12,435 |
| Thurston | 43,830 | 67.55% | 16,679 | 25.71% | 4,377 | 6.75% | 27,151 | 41.84% | 64,886 |
| Wahkiakum | 822 | 60.13% | 423 | 30.94% | 122 | 8.92% | 399 | 29.19% | 1,367 |
| Walla Walla | 8,951 | 67.05% | 3,195 | 23.93% | 1,204 | 9.02% | 5,756 | 43.12% | 13,350 |
| Whatcom | 27,304 | 57.59% | 16,705 | 35.24% | 3,400 | 7.17% | 10,599 | 22.36% | 47,409 |
| Whitman | 5,091 | 62.63% | 2,369 | 29.14% | 669 | 8.23% | 2,722 | 33.49% | 8,129 |
| Yakima | 26,961 | 66.09% | 9,992 | 24.49% | 3,843 | 9.42% | 16,969 | 41.59% | 40,796 |
| Totals | 816,171 | 59.40% | 446,222 | 32.48% | 111,528 | 8.12% | 369,949 | 26.93% | 1,373,921 |
By congressional district
| District[6] | Reed | Osgood | Representative |
|---|---|---|---|
| 1st | 58% | 35% | Jay Inslee |
| 2nd | 58% | 34% | Rick Larsen |
| 3rd | 60% | 31% | Brian Baird |
| 4th | 67% | 24% | Doc Hastings |
| 5th | 60% | 29% | Cathy McMorris Rodgers |
| 6th | 58% | 34% | Norm Dicks |
| 7th | 49% | 46% | Jim McDermott |
| 8th | 64% | 30% | Dave Reichert |
| 9th | 61% | 32% | Adam Smith |
General election
Results
| Party | Candidate | Votes | % | ±% | |
|---|---|---|---|---|---|
| Republican | Sam Reed (incumbent) | 1,644,587 | 58.33% | +6.86% | |
| Democratic | Jason Osgood | 1,175,086 | 41.67% | –3.78% | |
| Total votes | 2,819,673 | 100.00% | N/A | ||
| Republican hold | |||||
By county
| County[8] | Sam Reed
Republican |
Jason Osgood
Democratic |
Margin | Total votes | |||
|---|---|---|---|---|---|---|---|
| # | % | # | % | # | % | ||
| Adams | 3,372 | 74.60% | 1,148 | 25.40% | 2,224 | 49.20% | 4,520 |
| Asotin | 5,727 | 62.64% | 3,416 | 37.36% | 2,311 | 25.28% | 9,143 |
| Benton | 49,619 | 71.96% | 19,330 | 28.04% | 30,289 | 43.93% | 68,949 |
| Chelan | 20,913 | 69.70% | 9,093 | 30.30% | 11,820 | 39.39% | 30,006 |
| Clallam | 22,048 | 61.12% | 14,025 | 38.88% | 8,023 | 22.24% | 36,073 |
| Clark | 97,002 | 57.02% | 73,119 | 42.98% | 23,883 | 14.04% | 170,121 |
| Columbia | 1,558 | 75.08% | 517 | 24.92% | 1,041 | 50.17% | 2,075 |
| Cowlitz | 22,850 | 53.90% | 19,543 | 46.10% | 3,307 | 7.80% | 42,393 |
| Douglas | 10,207 | 71.12% | 4,145 | 28.88% | 6,062 | 42.24% | 14,352 |
| Ferry | 2,070 | 63.34% | 1,198 | 36.66% | 872 | 26.68% | 3,268 |
| Franklin | 13,009 | 68.84% | 5,889 | 31.16% | 7,120 | 37.68% | 18,898 |
| Garfield | 964 | 76.57% | 295 | 23.43% | 669 | 53.14% | 1,259 |
| Grant | 17,968 | 68.83% | 8,138 | 31.17% | 9,830 | 37.65% | 26,106 |
| Grays Harbor | 15,940 | 57.67% | 11,698 | 42.33% | 4,242 | 15.35% | 27,638 |
| Island | 24,352 | 62.20% | 14,802 | 37.80% | 9,550 | 24.39% | 39,154 |
| Jefferson | 9,447 | 50.06% | 9,423 | 49.94% | 24 | 0.13% | 18,870 |
| King | 432,277 | 51.88% | 400,964 | 48.12% | 31,313 | 3.76% | 833,241 |
| Kitsap | 68,976 | 58.89% | 48,153 | 41.11% | 20,823 | 17.78% | 117,129 |
| Kittitas | 11,120 | 66.42% | 5,621 | 33.58% | 5,499 | 32.85% | 16,741 |
| Klickitat | 5,402 | 57.09% | 4,060 | 42.91% | 1,342 | 14.18% | 9,462 |
| Lewis | 22,415 | 68.40% | 10,354 | 31.60% | 12,061 | 36.81% | 32,769 |
| Lincoln | 4,147 | 74.64% | 1,409 | 25.36% | 2,738 | 49.28% | 5,556 |
| Mason | 16,933 | 62.55% | 10,140 | 37.45% | 6,793 | 25.09% | 27,073 |
| Okanogan | 9,818 | 62.60% | 5,865 | 37.40% | 3,953 | 25.21% | 15,683 |
| Pacific | 5,423 | 52.96% | 4,817 | 47.04% | 606 | 5.92% | 10,240 |
| Pend Oreille | 4,014 | 65.56% | 2,109 | 34.44% | 1,905 | 31.11% | 6,123 |
| Pierce | 183,413 | 59.80% | 123,283 | 40.20% | 60,130 | 19.61% | 306,696 |
| San Juan | 4,750 | 48.43% | 5,058 | 51.57% | -308 | -3.14% | 9,808 |
| Skagit | 32,077 | 61.18% | 20,355 | 38.82% | 11,722 | 22.36% | 52,432 |
| Skamania | 2,833 | 55.79% | 2,245 | 44.21% | 588 | 11.58% | 5,078 |
| Snohomish | 172,173 | 57.13% | 129,193 | 42.87% | 42,980 | 14.26% | 301,366 |
| Spokane | 129,876 | 62.62% | 77,532 | 37.38% | 52,344 | 25.24% | 207,408 |
| Stevens | 14,077 | 67.30% | 6,839 | 32.70% | 7,238 | 34.61% | 20,916 |
| Thurston | 79,212 | 65.94% | 40,915 | 34.06% | 38,297 | 31.88% | 120,127 |
| Wahkiakum | 1,260 | 59.10% | 872 | 40.90% | 388 | 18.20% | 2,132 |
| Walla Walla | 16,195 | 70.24% | 6,863 | 29.76% | 9,332 | 40.47% | 23,058 |
| Whatcom | 53,006 | 56.49% | 40,820 | 43.51% | 12,186 | 12.99% | 93,826 |
| Whitman | 10,058 | 62.04% | 6,154 | 37.96% | 3,904 | 24.08% | 16,212 |
| Yakima | 48,086 | 65.18% | 25,686 | 34.82% | 22,400 | 30.36% | 73,772 |
| Totals | 1,644,587 | 58.33% | 1,175,086 | 41.67% | 469,501 | 16.65% | 2,819,673 |
Counties that flipped from Democratic to Republican
- Cowlitz (largest city: Longview)
- Jefferson (largest city: Port Townsend)
- King (largest city: Seattle)
- Pacific (largest city: Raymond)

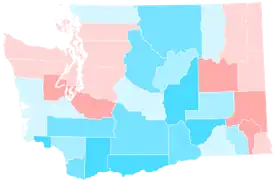

By congressional district
Reed won eight of nine congressional districts, including five that elected Democrats.[9]
| District | Reed | Osgood | Representative |
|---|---|---|---|
| 1st | 57% | 43% | Jay Inslee |
| 2nd | 58% | 42% | Rick Larsen |
| 3rd | 59% | 41% | Brian Baird |
| 4th | 68% | 32% | Doc Hastings |
| 5th | 64% | 36% | Cathy McMorris Rodgers |
| 6th | 58% | 42% | Norm Dicks |
| 7th | 40% | 60% | Jim McDermott |
| 8th | 63% | 37% | Dave Reichert |
| 9th | 59% | 41% | Adam Smith |
References
- ↑ https://www.historylink.org/file/8896
- 1 2 3 4 "2008 Primary Candidates Who Have Filed". eledataweb.votewa.gov. Retrieved October 22, 2025.
- ↑ Editorial Board, The Seattle Times (August 5, 2008). "Easy choice: Reed for secretary of state". The Seattle Times. Retrieved October 22, 2025.
- ↑ Reed, Sam (August 19, 2008). "Secretary of State". Secretary of State of Washington. Archived from the original on September 2, 2025. Retrieved October 22, 2025.
- ↑ Reed, Sam (August 19, 2008). "Secretary of State - County Results". Secretary of State of Washington. Archived from the original on April 30, 2025. Retrieved August 22, 2026.
- ↑ "2008 Primary Data". sos.wa.gov. Archived from the original on June 25, 2025.
- ↑ Reed, Sam (November 4, 2008). "Secretary of State". Secretary of State of Washington. Archived from the original on April 24, 2025. Retrieved October 22, 2025.
- ↑ Reed, Sam (November 4, 2008). "Secretary of State - County Results". Secretary of State of Washington. Archived from the original on March 18, 2025. Retrieved October 22, 2025.
- ↑ "2008 General Data". sos.wa.gov. Archived from the original on May 20, 2024.
Notes
- ↑ The 2016 Washington State Treasurer election was contested between 2 Republicans.