2012 Washington State Auditor election
 | |||||||||||||||||
November 6, 2012
| |||||||||||||||||
| |||||||||||||||||
  Kelley: 50–60% 60–70% 70–80% Watkins: 50–60% 60–70% 70–80% | |||||||||||||||||
| |||||||||||||||||


| Elections in Washington (state) |
|---|
 |
The 2012 Washington State Auditor election was held on November 6, 2012, to elect the Washington State Auditor, concurrently with the 2012 U.S. presidential election, as well as elections to the U.S. Senate and various state and local elections, including for U.S. House and governor of Washington. Washington is one of two states that holds a top-two primary, meaning that all candidates are listed on the same ballot regardless of party affiliation, and the top two move on to the general election.
Five-term incumbent Democratic State Auditor Brian Sonntag retired.[1] Democratic state Representative Troy Kelley defeated Republican James Watkins to succeed Sonntag.[2]
The top-two primary was held on August 7.
Primary election
Democratic Party
Advanced to general
- Troy Kelley, state representative (2007–2013)[3]
Eliminated in primary
- Mark Miloscia, state representative (1999–2013)[4]
- Craig Pridemore, state senator (2005–2013)[5]
Declined
- Brian Sonntag, incumbent state auditor (1993–2013)[1]
Republican Party
Advanced to general
- James Watkins, business consultant and candidate for Washington's 1st congressional district in 2010[6]
Endorsements
Newspapers
- The Seattle Times (co-endorsement with Watkins)[7]
Newspapers
- The Seattle Times (co-endorsement with Kelley)[7]
Statewide officials
- Brian Sonntag, incumbent Washington State Auditor (Democratic)[7]
Results

- 30–40%
- 40–50%
- 50–60%
- 60–70%
- 70–80%

- 30–40%
- 40–50%
- 50–60%
- 60–70%
- 40–50%
| Party | Candidate | Votes | % | |
|---|---|---|---|---|
| Republican | James Watkins | 584,444 | 46.09 | |
| Democratic | Troy Kelley | 291,335 | 22.98 | |
| Democratic | Craig Pridemore | 268,220 | 21.15 | |
| Democratic | Mark Miloscia | 123,936 | 9.77 | |
| Total votes | 1,267,935 | 100.00 | ||
By county
| County[9] | Troy Kelley
Democratic |
James Watkins
Republican |
Craig Pridemore
Democratic |
Mark Miloscia
Democratic |
Margin | Total votes | |||||
|---|---|---|---|---|---|---|---|---|---|---|---|
| # | % | # | % | # | % | # | % | # | % | ||
| Adams | 407 | 16.95% | 1,737 | 72.34% | 167 | 6.96% | 90 | 3.75% | 1,330 | 55.39% | 2,401 |
| Asotin | 1,021 | 22.46% | 2,643 | 58.15% | 578 | 12.72% | 303 | 6.67% | 1,622 | 35.69% | 4,545 |
| Benton | 4,458 | 15.21% | 19,753 | 67.40% | 3,480 | 11.88% | 1,614 | 5.51% | 15,295 | 52.19% | 29,305 |
| Chelan | 2,719 | 17.53% | 10,083 | 65.02% | 1,926 | 12.42% | 780 | 5.03% | 7,364 | 47.49% | 15,508 |
| Clallam | 3,700 | 20.37% | 9,927 | 54.66% | 3,085 | 16.99% | 1,451 | 7.99% | 6,227 | 34.28% | 18,163 |
| Clark | 6,890 | 10.31% | 32,668 | 48.89% | 24,133 | 36.12% | 3,124 | 4.68% | 8,535 | 12.77% | 66,815 |
| Columbia | 141 | 13.70% | 722 | 70.17% | 103 | 10.01% | 63 | 6.12% | 581 | 56.46% | 1,029 |
| Cowlitz | 4,086 | 23.25% | 8,587 | 48.86% | 3,557 | 20.24% | 1,344 | 7.65% | 4,501 | 25.61% | 17,574 |
| Douglas | 1,211 | 17.29% | 4,717 | 67.35% | 717 | 10.24% | 359 | 5.13% | 3,506 | 50.06% | 7,004 |
| Ferry | 298 | 18.72% | 996 | 62.56% | 196 | 12.31% | 102 | 6.41% | 698 | 43.84% | 1,592 |
| Franklin | 1,411 | 16.18% | 5,988 | 68.65% | 891 | 10.21% | 433 | 4.96% | 4,577 | 52.47% | 8,723 |
| Garfield | 92 | 16.43% | 400 | 71.43% | 38 | 6.79% | 30 | 5.36% | 308 | 55.00% | 560 |
| Grant | 2,052 | 17.44% | 7,918 | 67.30% | 1,182 | 10.05% | 613 | 5.21% | 5,866 | 49.86% | 11,765 |
| Grays Harbor | 3,567 | 27.18% | 5,873 | 44.76% | 2,472 | 18.84% | 1,210 | 9.22% | 2,306 | 17.57% | 13,122 |
| Island | 4,598 | 21.99% | 10,894 | 52.10% | 3,914 | 18.72% | 1,505 | 7.20% | 6,296 | 30.11% | 20,911 |
| Jefferson | 2,379 | 22.81% | 4,068 | 39.00% | 3,119 | 29.90% | 864 | 8.28% | 949 | 9.10% | 10,430 |
| King | 96,000 | 25.34% | 127,160 | 33.57% | 108,028 | 28.52% | 47,597 | 12.57% | 19,132 | 5.05% | 378,785 |
| Kitsap | 14,215 | 25.54% | 26,114 | 46.92% | 10,036 | 18.03% | 5,293 | 9.51% | 11,899 | 21.38% | 55,658 |
| Kittitas | 1,421 | 18.69% | 4,583 | 60.26% | 1,136 | 14.94% | 465 | 6.11% | 3,162 | 41.58% | 7,605 |
| Klickitat | 669 | 17.48% | 2,205 | 57.60% | 697 | 18.21% | 257 | 6.71% | 1,508 | 39.39% | 3,828 |
| Lewis | 2,313 | 15.61% | 9,611 | 64.87% | 2,042 | 13.78% | 849 | 5.73% | 7,298 | 49.26% | 14,815 |
| Lincoln | 440 | 14.95% | 2,100 | 71.36% | 272 | 9.24% | 131 | 4.45% | 1,660 | 56.41% | 2,943 |
| Mason | 3,286 | 23.41% | 6,969 | 49.65% | 2,473 | 17.62% | 1,309 | 9.33% | 3,683 | 26.24% | 14,037 |
| Okanogan | 1,452 | 18.62% | 4,730 | 60.65% | 1,195 | 15.32% | 422 | 5.41% | 3,278 | 42.03% | 7,799 |
| Pacific | 1,328 | 23.63% | 2,569 | 45.72% | 1,260 | 22.42% | 462 | 8.22% | 1,241 | 22.09% | 5,619 |
| Pend Oreille | 657 | 20.19% | 1,949 | 59.90% | 428 | 13.15% | 220 | 6.76% | 1,292 | 39.70% | 3,254 |
| Pierce | 41,521 | 29.94% | 63,196 | 45.57% | 17,124 | 12.35% | 16,826 | 12.13% | 21,675 | 15.63% | 138,667 |
| San Juan | 910 | 19.24% | 1,910 | 40.38% | 1,516 | 32.05% | 394 | 8.33% | 394 | 8.33% | 4,730 |
| Skagit | 5,568 | 22.38% | 12,909 | 51.90% | 4,406 | 17.71% | 1,992 | 8.01% | 7,341 | 29.51% | 24,875 |
| Skamania | 394 | 18.42% | 1,120 | 52.36% | 489 | 22.86% | 136 | 6.36% | 631 | 29.50% | 2,139 |
| Snohomish | 32,160 | 24.81% | 58,759 | 45.32% | 24,789 | 19.12% | 13,941 | 10.75% | 26,599 | 20.52% | 129,649 |
| Spokane | 19,137 | 20.69% | 51,868 | 56.08% | 14,336 | 15.50% | 7,154 | 7.73% | 32,731 | 35.39% | 92,495 |
| Stevens | 1,586 | 15.69% | 6,757 | 66.83% | 1,184 | 11.71% | 583 | 5.77% | 5,171 | 51.15% | 10,110 |
| Thurston | 11,877 | 22.61% | 22,668 | 43.15% | 12,773 | 24.31% | 5,220 | 9.94% | 9,895 | 18.83% | 52,538 |
| Wahkiakum | 269 | 23.31% | 587 | 50.87% | 205 | 17.76% | 93 | 8.06% | 318 | 27.56% | 1,154 |
| Walla Walla | 1,809 | 15.55% | 7,397 | 63.56% | 1,626 | 13.97% | 805 | 6.92% | 5,588 | 48.02% | 11,637 |
| Whatcom | 8,150 | 20.23% | 20,220 | 50.19% | 8,427 | 20.92% | 3,490 | 8.66% | 11,793 | 29.27% | 40,287 |
| Whitman | 1,164 | 17.45% | 3,912 | 58.65% | 969 | 14.53% | 625 | 9.37% | 2,748 | 41.20% | 6,670 |
| Yakima | 5,979 | 20.48% | 18,177 | 62.26% | 3,251 | 11.14% | 1,787 | 6.12% | 12,198 | 41.78% | 29,194 |
| Totals | 291,335 | 22.98% | 584,444 | 46.09% | 268,220 | 21.15% | 123,936 | 9.77% | 293,109 | 23.12% | 1,267,935 |
Counties that flipped from Democratic to Republican
- Asotin (largest city: Clarkston)
- Chelan (largest city: Wenatchee)
- Clallam (largest city: Port Angeles)
- Douglas (largest city: East Wenatchee)
- Island (largest city: Oak Harbor)
- Kittitas (largest city: Ellensburg)
- Klickitat (largest city: Goldendale)
- Lewis (largest city: Centralia)
- Okanogan (largest city: Omak)
- Pend Oreille (largest city: Newport)
- Skagit (largest city: Mount Vernon)
- Skamania (largest city: Carson)
- Spokane (largest city: Spokane)
- Wahkiakum (largest city: Puget Island)
- Walla Walla (largest city: Walla Walla)
- Whatcom (largest city: Bellingham)
- Whitman (largest city: Pullman)
- Yakima (largest city: Yakima)


By congressional district
| District[10] | Kelley | Watkins | Pridemore | Miloscia | Representative |
|---|---|---|---|---|---|
| 1st | 23% | 50% | 18% | 9% | Suzan DelBene |
| 2nd | 24% | 44% | 21% | 10% | Rick Larsen |
| 3rd | 14% | 51% | 29% | 6% | Jaime Herrera Beutler |
| 4th | 18% | 66% | 11% | 6% | Doc Hastings |
| 5th | 20% | 58% | 15% | 7% | Cathy McMorris Rodgers |
| 6th | 26% | 45% | 18% | 10% | Norm Dicks |
| 7th | 26% | 23% | 40% | 11% | Jim McDermott |
| 8th | 22% | 54% | 14% | 11% | Dave Reichert |
| 9th | 26% | 34% | 23% | 16% | Adam Smith |
| 10th | 28% | 44% | 17% | 11% | Denny Heck |
General election
Post-primary endorsements
Newspapers
Polling
| Poll source | Date(s) administered |
Sample size |
Margin of error |
Troy Kelley (D) |
James Watkins (R) |
Undecided |
|---|---|---|---|---|---|---|
| Elway Research[12] | October 18–21, 2012 | 451 (RV) | ± 4.5% | 34% | 29% | 37% |
| Elway Research[13] | September 9–12, 2012 | 405 (RV) | ± 5.0% | 36% | 27% | 38% |
Results
| Party | Candidate | Votes | % | ±% | |
|---|---|---|---|---|---|
| Democratic | Troy Kelley | 1,512,620 | 52.95 | –10.59 | |
| Republican | James Watkins | 1,344,137 | 47.05 | +10.59 | |
| Total votes | 2,856,757 | 100.00 | N/A | ||
| Democratic hold | |||||
By county
| County[15] | Troy Kelley
Democratic |
James Watkins
Republican |
Margin | Total votes | |||
|---|---|---|---|---|---|---|---|
| # | % | # | % | # | % | ||
| Adams | 1,348 | 30.47% | 3,076 | 69.53% | -1,728 | -39.06% | 4,424 |
| Asotin | 3,771 | 41.07% | 5,411 | 58.93% | -1,640 | -17.86% | 9,182 |
| Benton | 24,989 | 34.20% | 48,083 | 65.80% | -23,094 | -31.60% | 73,072 |
| Chelan | 11,016 | 37.36% | 18,471 | 62.64% | -7,455 | -25.28% | 29,487 |
| Clallam | 16,216 | 46.21% | 18,875 | 53.79% | -2,659 | -7.58% | 35,091 |
| Clark | 82,405 | 46.85% | 93,481 | 53.15% | -11,076 | -6.30% | 175,886 |
| Columbia | 577 | 28.33% | 1,460 | 71.67% | -883 | -43.35% | 2,037 |
| Cowlitz | 20,787 | 50.36% | 20,486 | 49.64% | 301 | 0.73% | 41,273 |
| Douglas | 4,586 | 33.19% | 9,233 | 66.81% | -4,647 | -33.63% | 13,819 |
| Ferry | 1,221 | 38.66% | 1,937 | 61.34% | -716 | -22.67% | 3,158 |
| Franklin | 7,737 | 36.13% | 13,680 | 63.87% | -5,943 | -27.75% | 21,417 |
| Garfield | 336 | 29.12% | 818 | 70.88% | -482 | -41.77% | 1,154 |
| Grant | 8,377 | 32.52% | 17,380 | 67.48% | -9,003 | -34.95% | 25,757 |
| Grays Harbor | 14,381 | 54.01% | 12,245 | 45.99% | 2,136 | 8.02% | 26,626 |
| Island | 18,708 | 48.37% | 19,967 | 51.63% | -1,259 | -3.26% | 38,675 |
| Jefferson | 11,263 | 61.63% | 7,013 | 38.37% | 4,250 | 23.25% | 18,276 |
| King | 558,930 | 64.58% | 306,553 | 35.42% | 252,377 | 29.16% | 865,483 |
| Kitsap | 58,390 | 51.05% | 55,989 | 48.95% | 2,401 | 2.10% | 114,379 |
| Kittitas | 6,765 | 41.36% | 9,590 | 58.64% | -2,825 | -17.27% | 16,355 |
| Klickitat | 4,209 | 44.21% | 5,312 | 55.79% | -1,103 | -11.58% | 9,521 |
| Lewis | 11,381 | 36.23% | 20,033 | 63.77% | -8,652 | -27.54% | 31,414 |
| Lincoln | 1,606 | 29.40% | 3,856 | 70.60% | -2,250 | -41.19% | 5,462 |
| Mason | 13,026 | 49.59% | 13,239 | 50.41% | -213 | -0.81% | 26,265 |
| Okanogan | 6,451 | 41.32% | 9,162 | 58.68% | -2,711 | -17.36% | 15,613 |
| Pacific | 5,142 | 52.49% | 4,654 | 47.51% | 488 | 4.98% | 9,796 |
| Pend Oreille | 2,381 | 38.34% | 3,829 | 61.66% | -1,448 | -23.32% | 6,210 |
| Pierce | 164,758 | 51.90% | 152,714 | 48.10% | 12,044 | 3.79% | 317,472 |
| San Juan | 6,347 | 64.87% | 3,437 | 35.13% | 2,910 | 29.74% | 9,784 |
| Skagit | 24,818 | 48.85% | 25,987 | 51.15% | -1,169 | -2.30% | 50,805 |
| Skamania | 2,347 | 46.75% | 2,673 | 53.25% | -326 | -6.49% | 5,020 |
| Snohomish | 160,487 | 52.81% | 143,403 | 47.19% | 17,084 | 5.62% | 303,890 |
| Spokane | 90,855 | 44.06% | 115,340 | 55.94% | -24,485 | -11.87% | 206,195 |
| Stevens | 7,156 | 34.43% | 13,628 | 65.57% | -6,472 | -31.14% | 20,784 |
| Thurston | 63,094 | 54.58% | 52,515 | 45.42% | 10,579 | 9.15% | 115,609 |
| Wahkiakum | 947 | 46.24% | 1,101 | 53.76% | -154 | -7.52% | 2,048 |
| Walla Walla | 8,533 | 37.04% | 14,504 | 62.96% | -5,971 | -25.92% | 23,037 |
| Whatcom | 50,325 | 53.22% | 44,235 | 46.78% | 6,090 | 6.44% | 94,560 |
| Whitman | 6,806 | 44.05% | 8,646 | 55.95% | -1,840 | -11.91% | 15,452 |
| Yakima | 30,148 | 41.72% | 42,121 | 58.28% | -11,973 | -16.57% | 72,269 |
| Totals | 1,512,620 | 52.95% | 1,344,137 | 47.05% | 168,483 | 5.90% | 2,856,757 |
Counties that flipped from Democratic to Republican
- Asotin (largest city: Clarkston)
- Chelan (largest city: Wenatchee)
- Clallam (largest city: Port Angeles)
- Clark (largest city: Vancouver)
- Island (largest city: Oak Harbor)
- Kittitas (largest city: Ellensburg)
- Klickitat (largest city: Goldendale)
- Lewis (largest city: Centralia)
- Mason (largest city: Shelton)
- Okanogan (largest city: Omak)
- Skagit (largest city: Mount Vernon)
- Skamania (largest city: Carson)
- Spokane (largest city: Spokane)
- Wahkiakum (largest city: Puget Island)
- Walla Walla (largest city: Walla Walla)
- Whitman (largest city: Pullman)
- Yakima (largest city: Yakima)

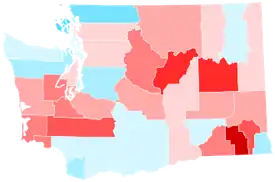

By congressional district
Kelley won five of ten congressional districts, with the remaining five going to Watkins, including one that elected a Democrat.[16]
| District | Kelley | Watkins | Representative |
|---|---|---|---|
| 1st | 49.7% | 50.3% | Suzan DelBene |
| 2nd | 56% | 44% | Rick Larsen |
| 3rd | 46% | 54% | Jaime Herrera Beutler |
| 4th | 37% | 63% | Doc Hastings |
| 5th | 42% | 58% | Cathy McMorris Rodgers |
| 6th | 53% | 47% | Norm Dicks |
| Derek Kilmer | |||
| 7th | 75% | 25% | Jim McDermott |
| 8th | 46% | 54% | Dave Reichert |
| 9th | 64% | 36% | Adam Smith |
| 10th | 54% | 46% | Denny Heck |
References
- 1 2 https://www.heraldnet.com/news/state-auditor-brian-sonntag-to-end-long-political-career/
- ↑ https://www.heraldnet.com/news/watkins-concedes-in-state-auditor-race/
- ↑ https://patch.com/washington/universityplace/election-troy-kelley-to-run-for-state-auditor
- ↑ https://www.federalwaymirror.com/news/state-rep-miloscia-enters-race-for-washington-state-auditor/
- ↑ https://www.columbian.com/news/2011/nov/02/pridemore-run-state-auditors-post/
- ↑ https://nwdailymarker.com/2012/03/james-watkins-enters-race-for-state-auditor-promises-to-be-citizens-watchdog-in-olympia/
- 1 2 3 Editorial Board, The Seattle Times (July 26, 2012). "The Times recommends: Kelley and Watkins for state auditor". The Seattle Times. Archived from the original on March 5, 2016. Retrieved October 25, 2025.
- ↑ Reed, Sam (August 7, 2012). "State Auditor". Secretary of State of Washington. Archived from the original on May 7, 2025. Retrieved October 25, 2025.
- ↑ Reed, Sam (August 7, 2012). "State Auditor - County Results". Secretary of State of Washington. Archived from the original on January 24, 2026. Retrieved August 24, 2026.
- ↑ "2012 Primary Data". sos.wa.gov. Archived from the original on June 25, 2025.
- ↑ Editorial Board, The Seattle Times (October 14, 2012). "In blistering campaign for auditor, Troy Kelley has the edge". The Seattle Times. Archived from the original on August 11, 2024. Retrieved October 29, 2025.
- ↑ Elway Research
- ↑ Elway Research
- ↑ Reed, Sam (November 6, 2012). "State Auditor". Secretary of State of Washington. Archived from the original on May 2, 2025. Retrieved October 25, 2025.
- ↑ Reed, Sam (November 6, 2012). "State Auditor - County Results". Secretary of State of Washington. Archived from the original on June 27, 2025. Retrieved October 25, 2025.
- ↑ "2012 General Data". sos.wa.gov. Archived from the original on September 10, 2024.