Timeline of the 1989 Atlantic hurricane season
| Timeline of the 1989 Atlantic hurricane season | |||||
|---|---|---|---|---|---|
 Season summary map | |||||
| Season boundaries | |||||
| First system formed | June 15, 1989 | ||||
| Last system dissipated | December 4, 1989 | ||||
| Strongest system | |||||
| Name | Hugo | ||||
| Maximum winds | 160 mph (260 km/h) (1-minute sustained) | ||||
| Lowest pressure | 918 mbar (hPa; 27.11 inHg) | ||||
| Longest lasting system | |||||
| Name | Felix and Gabrielle | ||||
| Duration | 14.25 days | ||||
| |||||
The 1989 Atlantic hurricane season was the annual cycle of tropical cyclone formation over the Atlantic Ocean north of the equator. The season officially began on June 1 and ended on November 30. This is historically the period during which most subtropical or tropical cyclogenesis occurs over the Atlantic Ocean.[1] The first system was a tropical depression that formed on June 15; the final system, Tropical Storm Karen, dissipated on December 4, four days after the season officially ended.
A total of 11 named tropical storms developed during the 1989 season. Seven strengthened into hurricanes, two of which became major hurricanes[2] by reaching Category 3 or higher on the five-level Saffir–Simpson scale.[1] These figures were close to average for an Atlantic hurricane season at the time.[nb 1] The season also produced four tropical depressions that failed to reach tropical storm strength.[2]
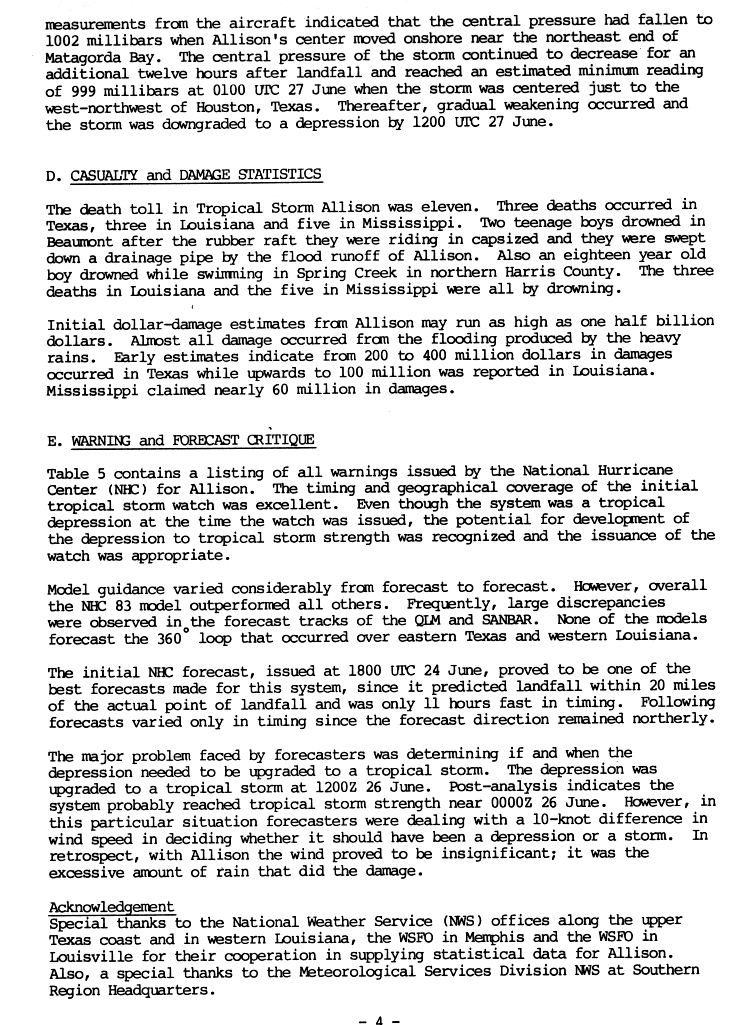
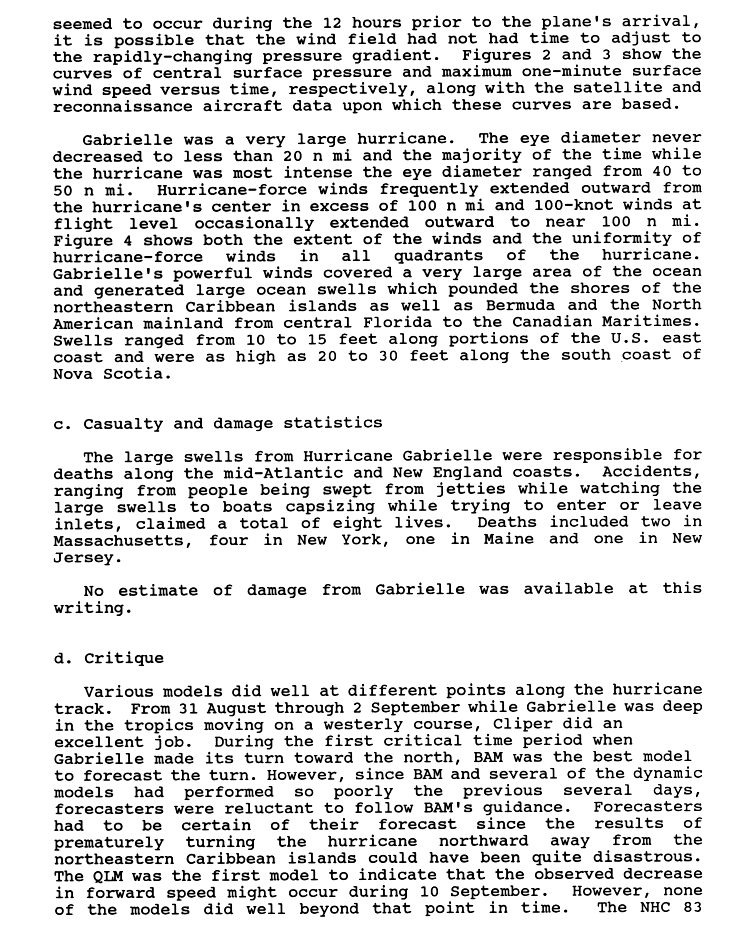
Several systems affected land, including Hurricane Hugo, which carved a path of destruction and claimed dozens of lives as it swept through several northeastern Caribbean territories and much of the Eastern United States in September. Hugo made five landfalls, all of which were as a major hurricane. It was the costliest hurricane in United States history at the time, wreaking at least US$9.5 billion[nb 2] in damage between the country's territories and its mainland.[4] Three storms—Allison, Chantal, and Jerry—made landfall in Texas,[2] the first of which inflicted devastating floods by way of heavy rainfall from its slow movement. Damage was estimated at roughly US$560 million, and 11 people were killed.[5] Hurricane Dean struck Newfoundland as a tropical storm near the end of its tenure as a tropical cyclone, and rip currents caused by Hurricane Gabrielle resulted in several fatalities even though the hurricane itself remained out to sea.[6]
This timeline documents tropical cyclone formations, strengthening, weakening, landfalls, extratropical transitions, and dissipations during the season. It includes information that was not released throughout the season, meaning that data from post-storm reviews by the National Hurricane Center (NHC) has been included.
The time stamp for each event is first stated using Coordinated Universal Time (UTC), the 24-hour clock where 00:00 = midnight UTC.[7] The NHC uses both UTC and the time zone where the center of the tropical cyclone is currently located. The time zones utilized (east to west) prior to 2020 were: Atlantic, Eastern, and Central.[8] In this timeline, the respective area time is included in parentheses. Additionally, figures for maximum sustained winds and position estimates are rounded to the nearest 5 units (miles, or kilometers), following National Hurricane Center practice. Direct wind observations are rounded to the nearest whole number. Atmospheric pressures are listed to the nearest millibar and nearest hundredth of an inch of mercury.
Timeline of events

June
June 1
- The 1989 Atlantic hurricane season officially begins.[1]
June 15
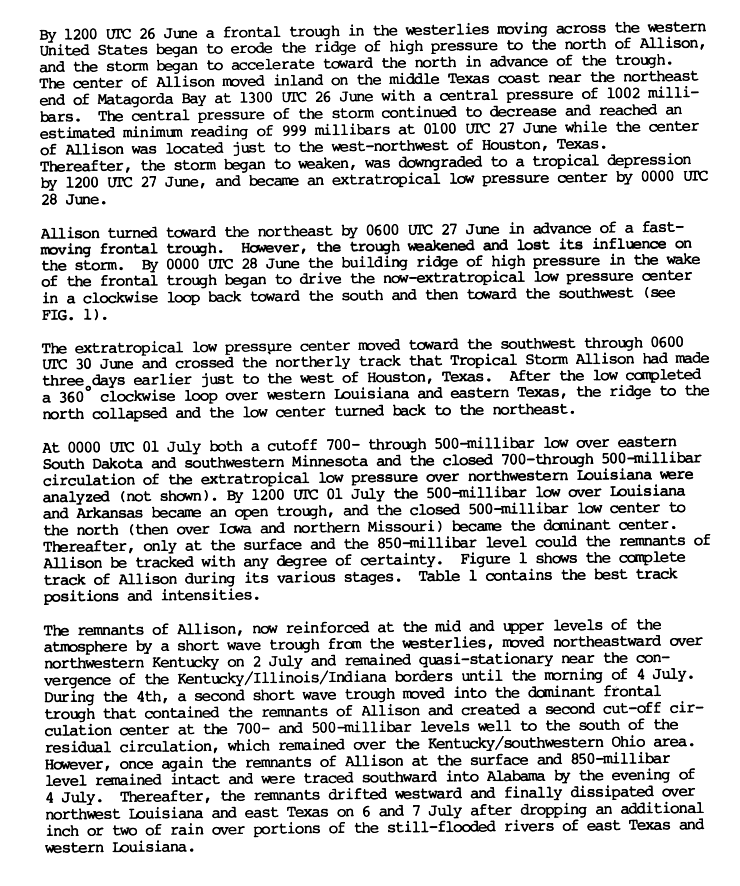
- 18:00 UTC (1:00 p.m. CDT) at 20°42′N 94°18′W / 20.7°N 94.3°W – Tropical Depression One develops from a frontal boundary while located over the Bay of Campeche. It is already at its peak intensity, with maximum sustained winds of 30 mph (45 km/h) and an unknown central pressure.[2][9]
June 17
- 06:00 UTC (1:00 a.m. CDT) at 19°12′N 93°42′W / 19.2°N 93.7°W – Tropical Depression One is last noted as a tropical cyclone while located about 110 mi (175 km) south-southeast of where it formed, dissipating shortly thereafter.[2][9]
June 24
- 18:00 UTC (1:00 p.m. CDT) at 27°00′N 96°00′W / 27.0°N 96.0°W – Tropical Depression Two develops from an interaction between a tropical wave and the remnants of Pacific Hurricane Cosme while located about 115 mi (185 km) northeast of Brownsville, Texas.[10][11]
June 26

- 00:00 UTC (7:00 p.m. CDT, June 25) at 27°48′N 95°48′W / 27.8°N 95.8°W – Tropical Depression Two strengthens into Tropical Storm Allison while located about 165 mi (270 km) northeast of Brownsville.[10][11]
- 13:00 UTC (8:00 a.m. CDT) at 28°42′N 95°42′W / 28.7°N 95.7°W – Tropical Storm Allison makes landfall in Texas on the northeastern end of Matagorda Bay with maximum sustained winds of 45 mph (75 km/h) and a central pressure of 1002 mbar (29.59 inHg).[11][12]
June 27
- 00:00 UTC (7:00 p.m. CDT, June 26) at 29°42′N 95°42′W / 29.7°N 95.7°W – Tropical Storm Allison attains its peak intensity, with maximum sustained winds of 50 mph (85 km/h) and a minimum central pressure of 999 mbar (29.50 inHg), while located over land about 25 mi (35 km) west of Houston, Texas.[11][12]
- 12:00 UTC (7:00 a.m. CDT) at 30°36′N 94°54′W / 30.6°N 94.9°W – Tropical Storm Allison weakens into a tropical depression while located over land about 65 mi (100 km) north-northeast of Houston.[11][12]
June 28
- 00:00 UTC (7:00 p.m. CDT, June 27) at 31°06′N 94°12′W / 31.1°N 94.2°W – Tropical Depression Allison transitions into an extratropical cyclone while located over land about 115 mi (185 km) northeast of Houston, and later dissipates.[11][12]
July
July 9
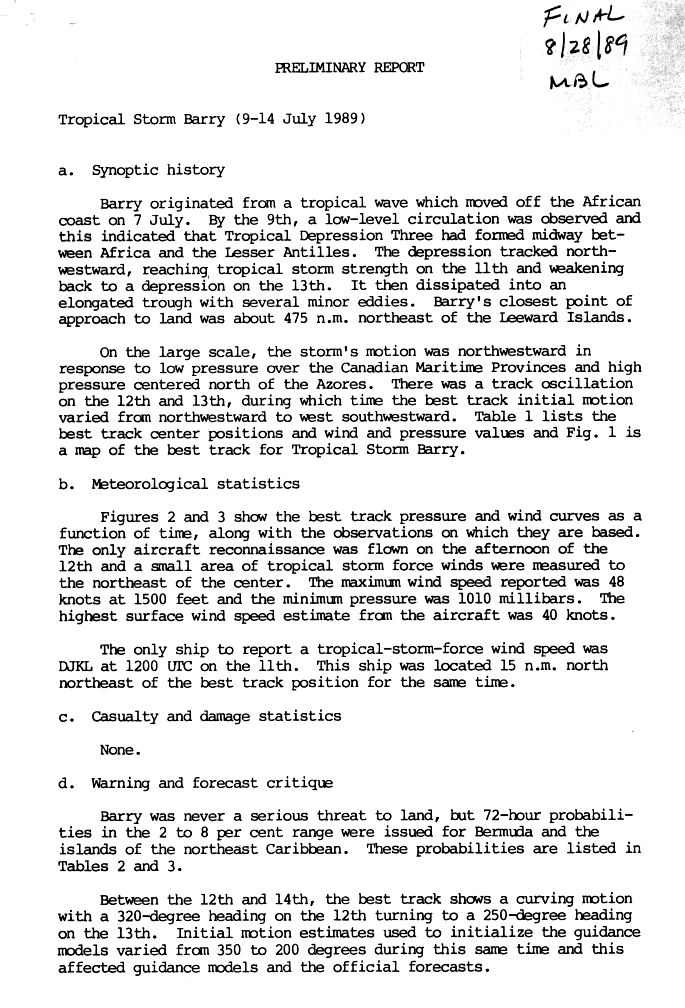
- 18:00 UTC (2:00 p.m. AST) at 12°48′N 37°48′W / 12.8°N 37.8°W – Tropical Depression Three develops from a tropical wave while located roughly midway between Africa and the Lesser Antilles.[13][14]
July 11
- 00:00 UTC (8:00 p.m. AST, July 10) at 17°42′N 48°12′W / 17.7°N 48.2°W – Tropical Depression Two strengthens into Tropical Storm Barry while located about 1,100 mi (1,770 km) east of Saint Thomas, U.S. Virgin Islands.[13][14]
July 12

- 00:00 UTC (8:00 p.m. AST, July 11) at 21°24′N 53°06′W / 21.4°N 53.1°W – Tropical Storm Barry attains its peak intensity, with maximum sustained winds of 50 mph (85 km/h) and a minimum central pressure of 1005 mbar (29.68 inHg), while located about 795 mi (1,280 km) east-northeast of Saint Thomas.[13][14]
July 13
- 18:00 UTC (2:00 p.m. AST) at 23°42′N 57°24′W / 23.7°N 57.4°W – Tropical Storm Barry weakens into a tropical depression while located about 610 mi (980 km) northeast of Saint Thomas.[13][14]
July 14
- 00:00 UTC (8:00 p.m. AST, July 13) at 23°18′N 58°06′W / 23.3°N 58.1°W – Tropical Depression Barry is last noted as a tropical cyclone while located about 560 mi (900 km) northeast of Saint Thomas, dissipating shortly thereafter.[13][14]
July 30
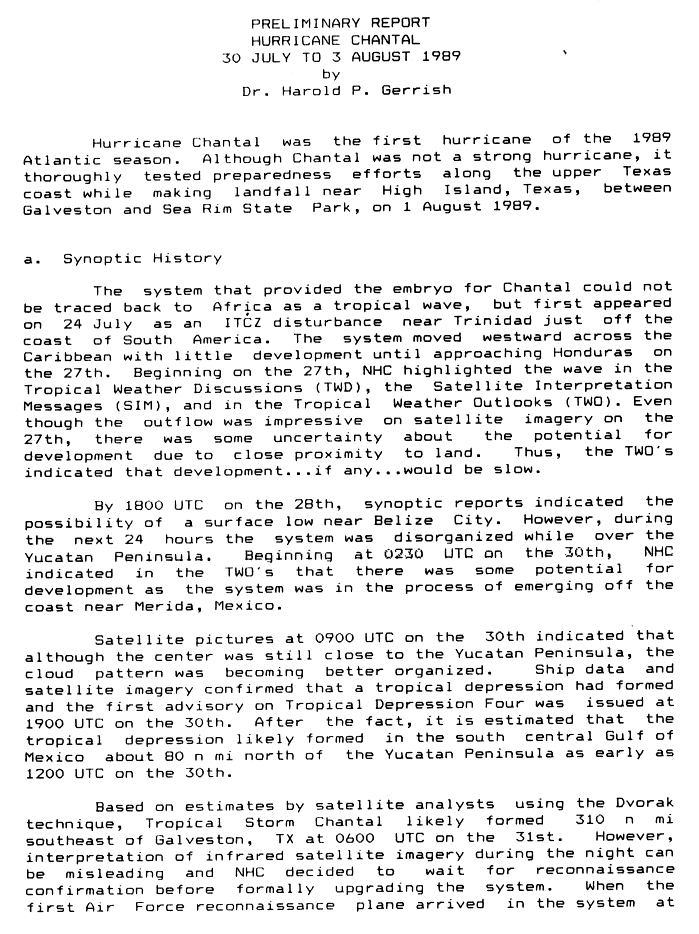
- 12:00 UTC (7:00 a.m. CDT) at 22°30′N 90°00′W / 22.5°N 90.0°W – Tropical Depression Four develops from a low-pressure area, which itself had originated as an Intertropical Convergence Zone (ITCZ) disturbance, while located over the southern Gulf of Mexico about 90 mi (150 km) off the north coast of the Yucatán Peninsula.[15][16]
July 31
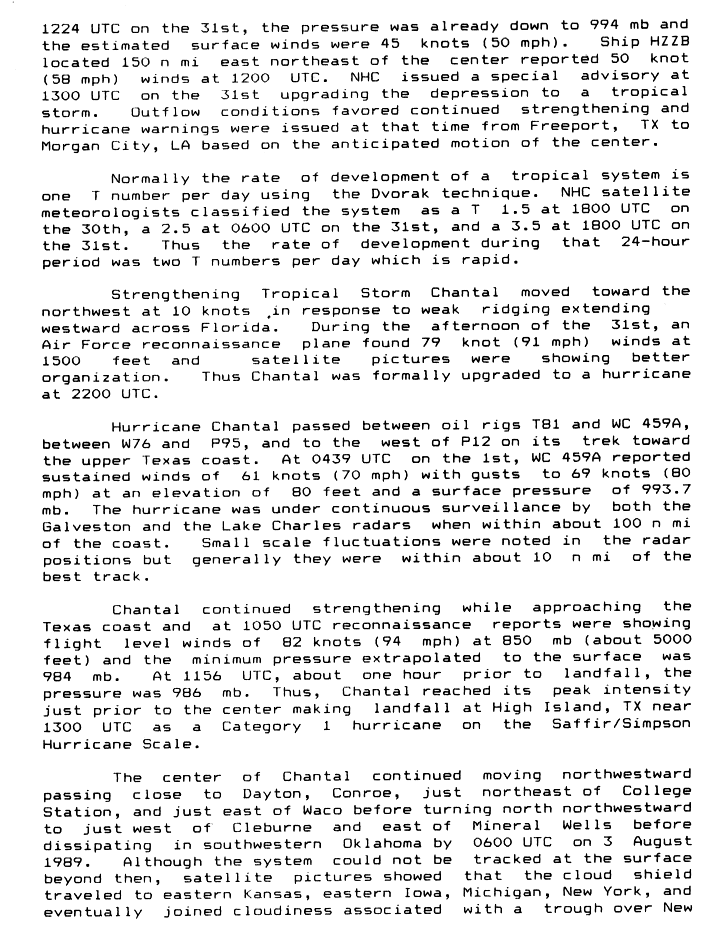
- 06:00 UTC (1:00 a.m. CDT) at 25°24′N 91°00′W / 25.4°N 91.0°W – Tropical Depression Four strengthens into Tropical Storm Chantal while located about 355 mi (575 km) southeast of Galveston, Texas.[15][16]
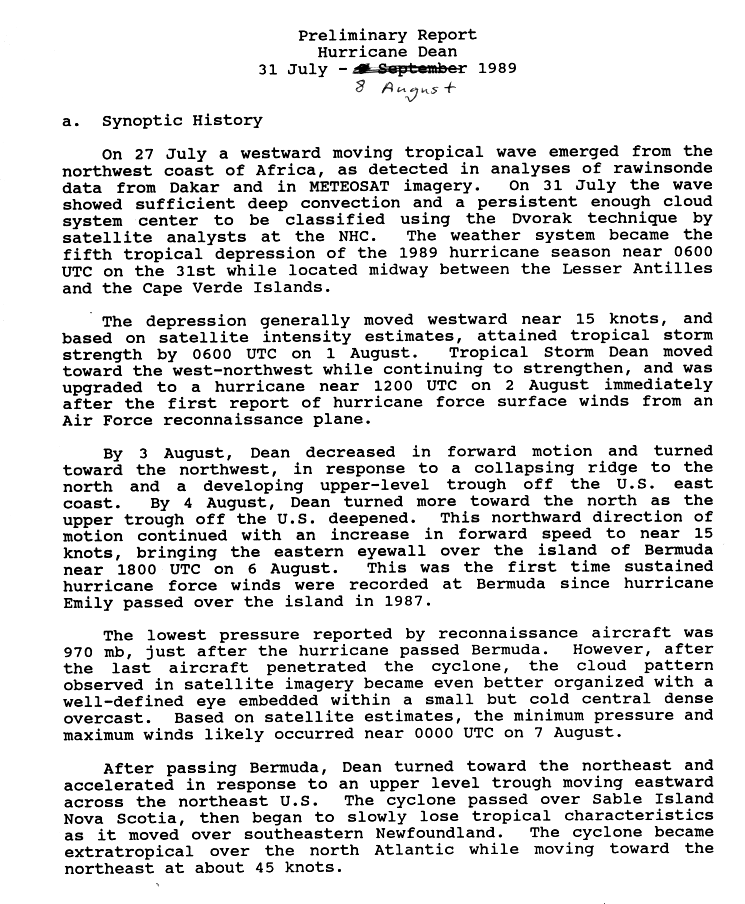
- 06:00 UTC (2:00 a.m. AST) at 14°48′N 41°48′W / 14.8°N 41.8°W – The fifth tropical depression of the season develops from a tropical wave while located roughly midway between Cape Verde and the Lesser Antilles.[17][18]
August
August 1

- 00:00 UTC (7:00 p.m. CDT, July 31) at 27°54′N 92°48′W / 27.9°N 92.8°W – Tropical Storm Chantal strengthens into a Category 1 hurricane on the Saffir–Simpson scale while located about 155 mi (250 km) southeast of Galveston.[16][19]
- 06:00 UTC (2:00 a.m. AST) at 15°48′N 49°18′W / 15.8°N 49.3°W – The fifth tropical depression of the season strengthens into Tropical Storm Dean while located about 800 mi (1,290 km) east of Dominica.[17][18]
- 10:00 UTC (5:00 a.m. CDT) at 29°12′N 94°00′W / 29.2°N 94.0°W – Hurricane Chantal attains its peak intensity, with maximum sustained winds of 80 mph (130 km/h) and a minimum central pressure of 984 mbar (29.06 inHg), while located about 45 mi (75 km) east of Galveston.[16][19]
- 13:00 UTC (8:00 a.m. CDT) at 29°36′N 94°24′W / 29.6°N 94.4°W – Hurricane Chantal makes landfall at High Island, Texas, with maximum sustained winds of 80 mph (130 km/h) and a central pressure of 986 mbar (29.12 inHg).[16][19]
- 18:00 UTC (1:00 p.m. CDT) at 30°12′N 95°12′W / 30.2°N 95.2°W – Hurricane Chantal weakens into a tropical storm while located over land about 35 mi (55 km) north-northeast of Houston.[16][19]
August 2
- 06:00 UTC (1:00 a.m. CDT) at 31°30′N 96°54′W / 31.5°N 96.9°W – Tropical Storm Chantal weakens into a tropical depression while located over land just east of Waco, Texas.[16][19]
- 12:00 UTC (8:00 a.m. AST) at 17°18′N 58°06′W / 17.3°N 58.1°W – Tropical Storm Dean strengthens into a Category 1 hurricane while located about 240 mi (390 km) east of Antigua.[17][18]
August 3
- 00:00 UTC (7:00 p.m. CDT, August 2) at 34°30′N 98°30′W / 34.5°N 98.5°W – Tropical Depression Chantal is last noted as a tropical cyclone while located over southwestern Oklahoma, dissipating shortly thereafter.[16][19]
August 6
- 18:00 UTC (2:00 p.m. EDT) at 32°24′N 65°06′W / 32.4°N 65.1°W – Hurricane Dean strengthens to Category 2 intensity while located about 25 mi (35 km) west-northwest of Bermuda.[17][18]
August 7

- 00:00 UTC (8:00 p.m. AST, August 6) at 34°00′N 64°54′W / 34.0°N 64.9°W – Hurricane Dean attains its peak intensity, with maximum sustained winds of 105 mph (165 km/h) and a minimum central pressure of 968 mbar (28.59 inHg), while located about 115 mi (185 km) north of Bermuda.[17][18]
- 18:00 UTC (2:00 p.m. AST) at 39°24′N 63°24′W / 39.4°N 63.4°W – Hurricane Dean weakens to Category 1 intensity while located about 495 mi (795 km) north of Bermuda.[17][18]
August 8
- 12:00 UTC (8:00 a.m. AST) at 46°30′N 56°30′W / 46.5°N 56.5°W – Hurricane Dean weakens into a tropical storm while located about 30 mi (45 km) south-southwest of Saint Pierre and Miquelon.[17][18]
- 13:00 UTC (9:00 a.m. AST) at 46°54′N 55°54′W / 46.9°N 55.9°W – Tropical Storm Dean makes landfall on the coast of southern Newfoundland, or just east of Saint Pierre and Miquelon, with maximum sustained winds of 65 mph (100 km/h) and a central pressure of 991 mbar (29.26 inHg), emerging back over the Atlantic Ocean shortly thereafter.[17][18]
- 18:00 UTC (2:00 p.m. AST) at 15°48′N 20°48′W / 15.8°N 20.8°W – Tropical Depression Six develops from a tropical wave[2] while located east of Cape Verde.[nb 3][9]
August 9
- 00:00 UTC (8:00 p.m. AST, August 8) at 50°48′N 48°06′W / 50.8°N 48.1°W – Tropical Storm Dean transitions into an extratropical cyclone while located about 365 mi (585 km) northeast of Cape Race, Newfoundland, and later dissipates.[17][18]
August 16

- 12:00 UTC (8:00 a.m. AST) at 16°06′N 49°12′W / 16.1°N 49.2°W – Tropical Depression Six attains its peak intensity, with maximum sustained winds of 35 mph (55 km/h) and an unknown central pressure, while located about 720 mi (1,160 km) east-northeast of Barbados.[2][9]
August 17
- 12:00 UTC (8:00 a.m. AST) at 17°42′N 55°06′W / 17.7°N 55.1°W – Tropical Depression Six is last noted as a tropical cyclone while located about 430 mi (695 km) northeast of Barbados, dissipating shortly thereafter.[2][9]
August 18
- 00:00 UTC (8:00 p.m. AST, August 17) at 14°18′N 22°24′W / 14.3°N 22.4°W – The seventh tropical depression of the season develops from a tropical wave while located just southeast of Cape Verde.[20][21]
August 19
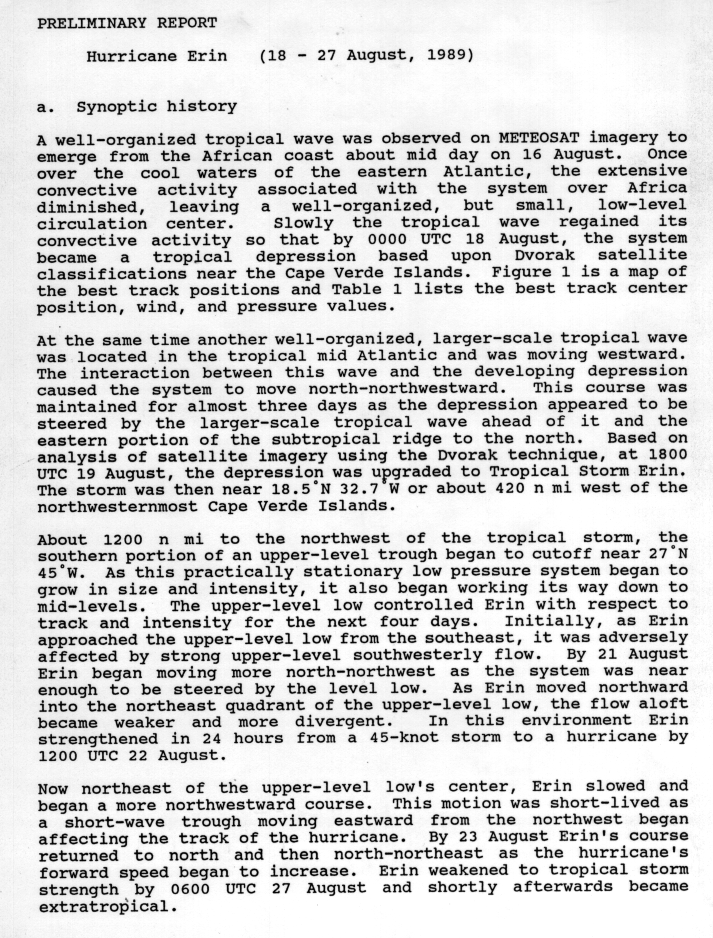
- 18:00 UTC (2:00 p.m. AST) at 18°30′N 32°42′W / 18.5°N 32.7°W – The seventh tropical depression of the season strengthens into Tropical Storm Erin while located about 505 mi (815 km) west of Santo Antão, Cape Verde.[20][21]
August 22
- 12:00 UTC (8:00 a.m. AST) at 28°48′N 44°30′W / 28.8°N 44.5°W – Tropical Storm Erin strengthens into a Category 1 hurricane while located about 1,055 mi (1,695 km) southwest of Flores Island, Azores.[20][21]
August 24

- 00:00 UTC (8:00 p.m. AST, August 23) at 32°36′N 45°36′W / 32.6°N 45.6°W – Hurricane Erin strengthens to Category 2 intensity while located about 930 mi (1,500 km) west-southwest of Flores Island.[20][21]
August 25
- 00:00 UTC (8:00 p.m. AST, August 24) at 36°18′N 42°24′W / 36.3°N 42.4°W – Hurricane Erin attains its peak intensity, with maximum sustained winds of 105 mph (165 km/h) and a minimum central pressure of 968 mbar (28.59 inHg), while located about 650 mi (1,045 km) west-southwest of Flores Island.[20][21]
August 26
- 00:00 UTC (8:00 p.m. AST, August 25) at 42°18′N 37°12′W / 42.3°N 37.2°W – Hurricane Erin weakens to Category 1 intensity while located about 370 mi (595 km) west-northwest of Flores Island.[20][21]
- 00:00 UTC (8:00 p.m. AST, August 25) at 16°48′N 21°00′W / 16.8°N 21.0°W – The eighth tropical depression of the season develops from a low-pressure area associated with a tropical wave while located about 125 mi (205 km) east of Sal, Cape Verde.[22][23]
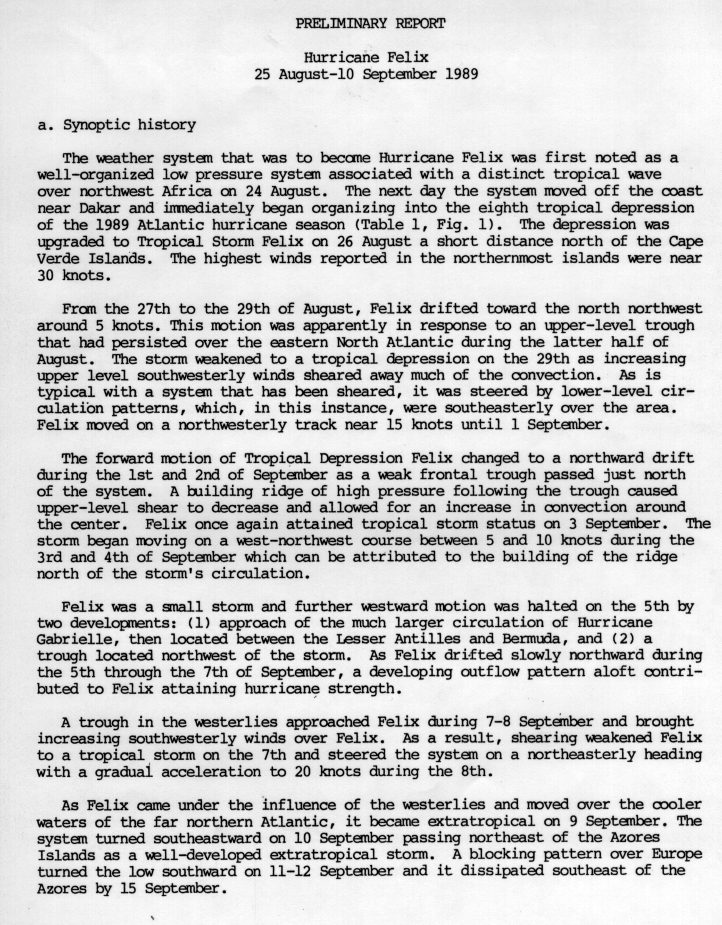
- 18:00 UTC (2:00 p.m. AST) at 17°12′N 22°54′W / 17.2°N 22.9°W – The eighth tropical depression of the season strengthens into Tropical Storm Felix while located about 35 mi (55 km) north of Sal.[22][23]
August 27
- 00:00 UTC (8:00 p.m. AST, August 26) at 51°54′N 31°48′W / 51.9°N 31.8°W – Hurricane Erin weakens into a tropical storm while located about 865 mi (1,390 km) north of Flores Island, transitioning into an extratropical cyclone shortly thereafter.[20][21]
- 06:00 UTC (2:00 a.m. AST) at 13°00′N 48°12′W / 13.0°N 48.2°W – Tropical Depression Nine develops from a tropical wave while located about 765 mi (1,230 km) east of Barbados.[2][9]
- 12:00 UTC (8:00 a.m. AST) at 13°00′N 49°06′W / 13.0°N 49.1°W – Tropical Depression Nine attains its peak intensity, with maximum sustained winds of 30 mph (45 km/h) and an unknown central pressure, while located about 700 mi (1,130 km) east of Barbados.[2][9]
August 28
- 12:00 UTC (8:00 a.m. AST) at 13°48′N 53°24′W / 13.8°N 53.4°W – Tropical Depression Nine is last noted as a tropical cyclone while located about 415 mi (665 km) east of Barbados, dissipating shortly thereafter.[2][9]
August 29

- 18:00 UTC (2:00 p.m. AST) at 21°54′N 27°48′W / 21.9°N 27.8°W – Tropical Storm Felix weakens into a tropical depression while located about 375 mi (600 km) north-northwest of Santo Antão.[22][23]
August 30
- 12:00 UTC (8:00 a.m. AST) at 11°36′N 21°00′W / 11.6°N 21.0°W – Tropical Depression Ten develops from a tropical wave while located about 290 mi (465 km) south-southeast of Maio, Cape Verde.[24][25]
August 31
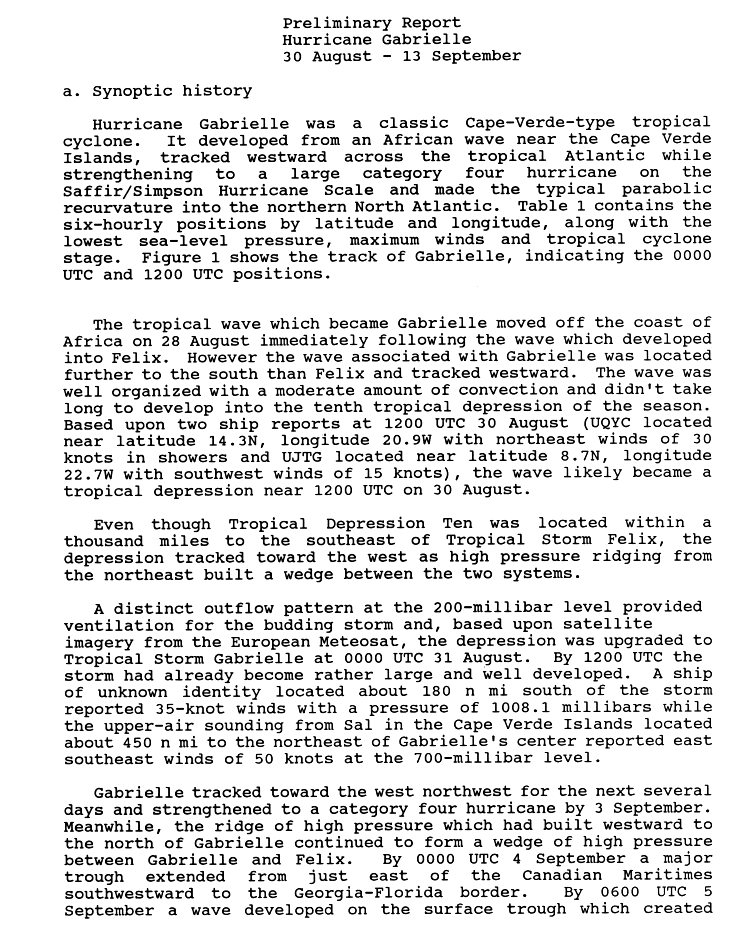
- 00:00 UTC (8:00 p.m. AST, August 30) at 11°18′N 24°48′W / 11.3°N 24.8°W – Tropical Depression Ten strengthens into Tropical Storm Gabrielle while located about 245 mi (400 km) south of Brava, Cape Verde.[24][25]
September
September 1
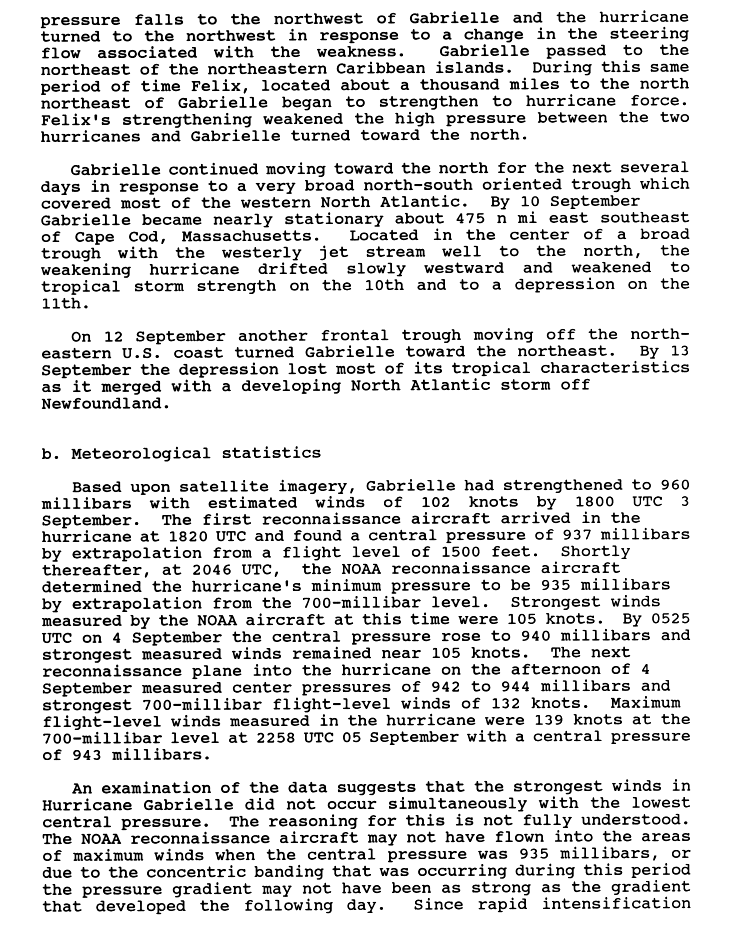
- 00:00 UTC (8:00 p.m. AST, August 31) at 11°30′N 31°42′W / 11.5°N 31.7°W – Tropical Storm Gabrielle strengthens into a Category 1 hurricane while located about 525 mi (845 km) west-southwest of Brava.[24][25]
September 2
- 12:00 UTC (8:00 a.m. AST) at 14°24′N 42°00′W / 14.4°N 42.0°W – Hurricane Gabrielle strengthens to Category 2 intensity while located about 1,155 mi (1,860 km) west of Brava.[24][25]
September 3
- 00:00 UTC (8:00 p.m. AST, September 2) at 33°12′N 41°48′W / 33.2°N 41.8°W – Tropical Depression Felix restrengthens into a tropical storm while located about 730 mi (1,175 km) southwest of Flores Island.[22][23]
- 06:00 UTC (2:00 a.m. AST) at 15°36′N 47°12′W / 15.6°N 47.2°W – Hurricane Gabrielle strengthens to Category 3 intensity while located about 840 mi (1,355 km) east of Barbados, making it the first major hurricane of the season.[24][25]
- 20:46 UTC (4:46 p.m. AST) at 16°48′N 50°54′W / 16.8°N 50.9°W – Hurricane Gabrielle attains a minimum central pressure of 935 mbar (27.61 inHg) while located about 625 mi (1,010 km) east-northeast of Barbados.[24][26]
September 4

- 12:00 UTC (8:00 a.m. AST) at 18°00′N 53°48′W / 18.0°N 53.8°W – Hurricane Gabrielle strengthens to Category 4 intensity while located about 505 mi (815 km) northeast of Barbados.[24][25]
September 5
- 00:00 UTC (8:00 p.m. AST, September 4) at 19°18′N 55°42′W / 19.3°N 55.7°W – Hurricane Gabrielle attains peak maximum sustained winds of 145 mph (230 km/h) while located about 435 mi (705 km) east-northeast of Guadeloupe.[24][25]
- 06:00 UTC (2:00 a.m. AST) at 36°00′N 48°42′W / 36.0°N 48.7°W – Tropical Storm Felix strengthens into a Category 1 hurricane while located about 985 mi (1,585 km) west-southwest of Flores Island.[22][27]
- 18:00 UTC (2:00 p.m. AST) at 36°42′N 48°18′W / 36.7°N 48.3°W – Hurricane Felix attains its peak intensity, with maximum sustained winds of 85 mph (140 km/h) and a minimum central pressure of 979 mbar (28.91 inHg), while located about 950 mi (1,530 km) west of Flores Island.[22][27]
September 7
- 06:00 UTC (2:00 a.m. AST) at 38°30′N 47°42′W / 38.5°N 47.7°W – Hurricane Felix weakens into a tropical storm while located about 885 mi (1,425 km) west of Flores Island.[22][27]
- 06:00 UTC (2:00 a.m. AST) at 27°42′N 60°00′W / 27.7°N 60.0°W – Hurricane Gabrielle weakens to Category 3 intensity while located about 425 mi (685 km) southeast of Bermuda.[25][28]
- 12:00 UTC (8:00 a.m. AST) at 29°00′N 59°54′W / 29.0°N 59.9°W – Hurricane Gabrielle weakens to Category 2 intensity while located about 370 mi (595 km) southeast of Bermuda.[25][28]
September 8
- 18:00 UTC (2:00 p.m. AST) at 36°24′N 59°42′W / 36.4°N 59.7°W – Hurricane Gabrielle weakens to Category 1 intensity while located about 405 mi (650 km) northeast of Bermuda.[26][28]
September 9
- 06:00 UTC (2:00 a.m. AST) at 46°30′N 38°00′W / 46.5°N 38.0°W – Tropical Storm Felix transitions into an extratropical cyclone while located about 600 mi (965 km) northwest of Flores Island, and later dissipates.[nb 4][9][22]
September 10
- 06:00 UTC (2:00 a.m. AST) at 39°06′N 60°24′W / 39.1°N 60.4°W – Hurricane Gabrielle weakens into a tropical storm while located about 530 mi (850 km) north-northeast of Bermuda.[26][28]
- 12:00 UTC (8:00 a.m. AST) at 13°12′N 20°00′W / 13.2°N 20.0°W – The eleventh tropical depression of the season develops from a tropical wave while located about 255 mi (410 km) southeast of Maio.[29][30]
September 11
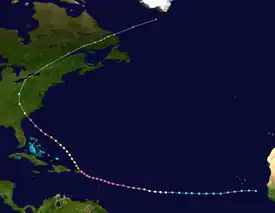
- 18:00 UTC (2:00 p.m. AST) at 12°30′N 29°12′W / 12.5°N 29.2°W – The eleventh tropical depression of the season strengthens into Tropical Storm Hugo while located about 345 mi (555 km) west-southwest of Brava.[29][30]
September 12
- 12:00 UTC (8:00 a.m. AST) at 40°30′N 58°42′W / 40.5°N 58.7°W – Tropical Storm Gabrielle weakens into a tropical depression while located about 600 mi (965 km) east of Nantucket, Massachusetts.[26][28]
September 13
- 12:00 UTC (8:00 a.m. AST) at 43°48′N 51°30′W / 43.8°N 51.5°W – Tropical Depression Gabrielle is last noted as a tropical cyclone while located about 960 mi (1,545 km) east of Nantucket, transitioning into an extratropical cyclone shortly thereafter as it merges with a cold front.[26][28]
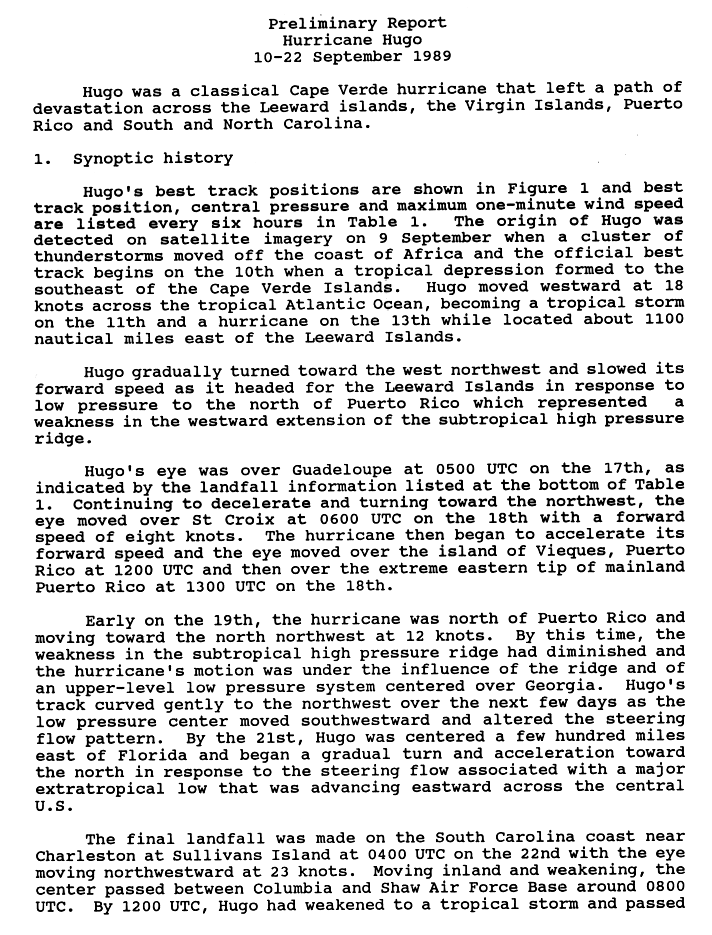
- 18:00 UTC (2:00 p.m. AST) at 12°48′N 43°30′W / 12.8°N 43.5°W – Tropical Storm Hugo strengthens into a Category 1 hurricane while located about 1,080 mi (1,740 km) east of Barbados.[29][30]
September 14
- 12:00 UTC (8:00 a.m. AST) at 13°12′N 47°48′W / 13.2°N 47.8°W – Hurricane Hugo strengthens to Category 2 intensity while located about 790 mi (1,270 km) east of Barbados.[29][30]
September 15

- 00:00 UTC (8:00 p.m. AST, September 14) at 13°48′N 50°30′W / 13.8°N 50.5°W – Hurricane Hugo strengthens to Category 3 intensity while located about 610 mi (980 km) east of Barbados, making it the second and final major hurricane of the season.[29][30]
- 12:00 UTC (8:00 a.m. AST) at 14°12′N 53°18′W / 14.2°N 53.3°W – Hurricane Hugo strengthens to Category 4 intensity while located about 425 mi (685 km) east of Barbados.[29][30]
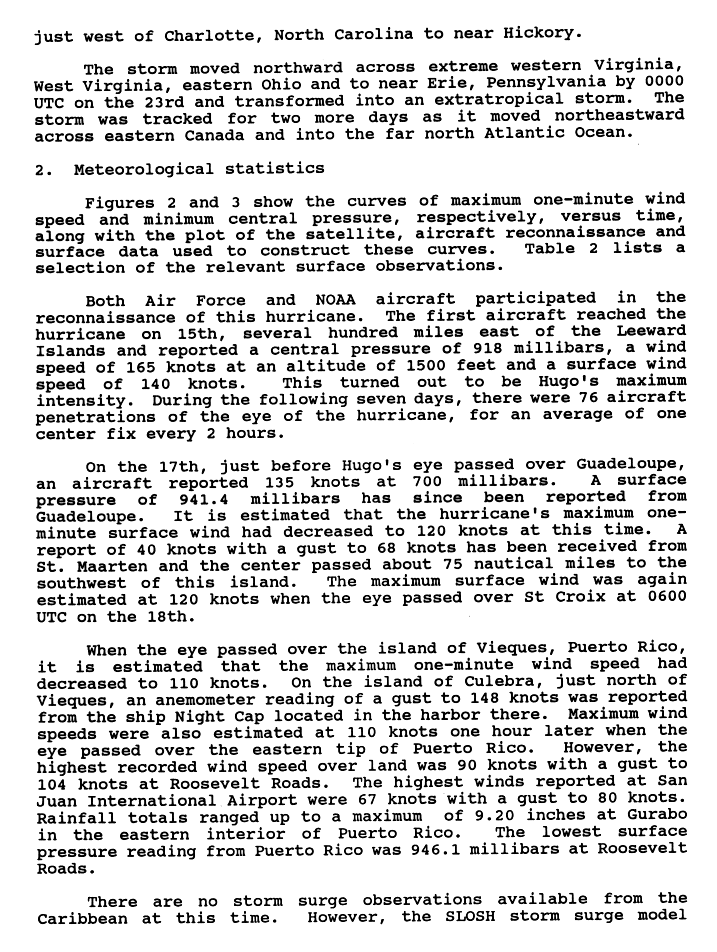
- 18:00 UTC (2:00 p.m. AST) at 14°36′N 54°36′W / 14.6°N 54.6°W – Hurricane Hugo strengthens to Category 5 intensity while located about 345 mi (555 km) east-northeast of Barbados. It simultaneously attains its peak intensity, with maximum sustained winds of 160 mph (260 km/h) and a minimum central pressure of 918 mbar (27.11 inHg), making it the strongest storm of the season.[29][30]
September 16
- 00:00 UTC (8:00 p.m. AST, September 15) at 14°48′N 56°06′W / 14.8°N 56.1°W – Hurricane Hugo weakens to Category 4 intensity while located about 260 mi (415 km) east-northeast of Barbados.[29][30]
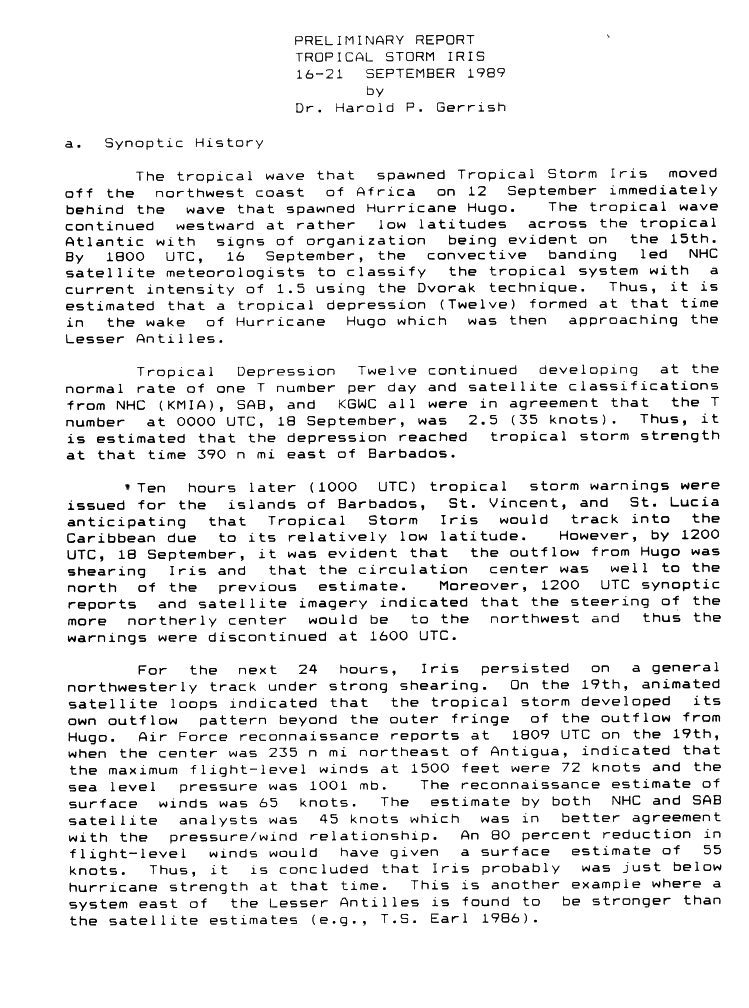
- 18:00 UTC (2:00 p.m. AST) at 11°18′N 44°00′W / 11.3°N 44.0°W – Tropical Depression Twelve develops from a tropical wave while located about 1,060 mi (1,705 km) east of Barbados.[31][32]
September 17
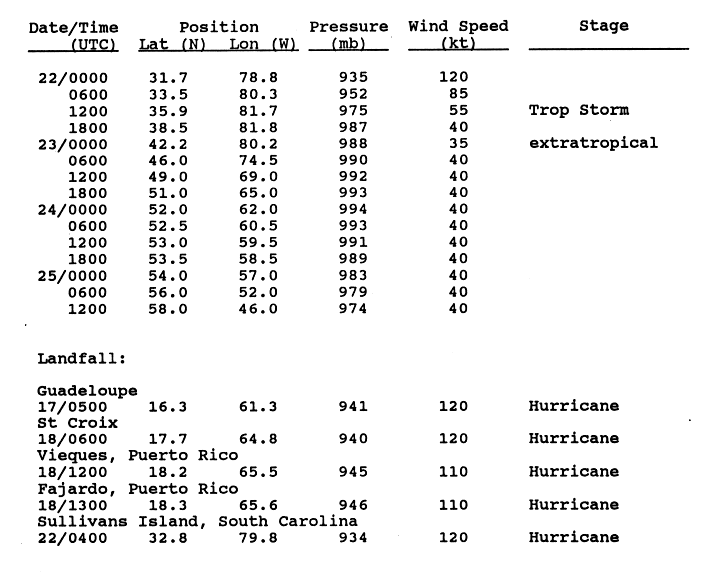
- 05:00 UTC (1:00 a.m. AST) at 16°18′N 61°18′W / 16.3°N 61.3°W – Hurricane Hugo makes its first landfall on Guadeloupe with maximum sustained winds of 140 mph (220 km/h) and a central pressure of 941 mbar (27.79 inHg), emerging over the northeastern Caribbean Sea shortly thereafter.[29][33]
September 18
- 00:00 UTC (8:00 p.m. AST, September 17) at 11°54′N 53°12′W / 11.9°N 53.2°W – Tropical Depression Twelve strengthens into Tropical Storm Iris while located about 435 mi (705 km) east of Barbados.[31][32]
- 06:00 UTC (2:00 a.m. AST) at 17°42′N 64°48′W / 17.7°N 64.8°W – Hurricane Hugo makes its second landfall on St. Croix, U.S. Virgin Islands, with maximum sustained winds of 140 mph (220 km/h) and a central pressure of 940 mbar (27.76 inHg).[29][33]
- 12:00 UTC (8:00 a.m. EDT) at 18°12′N 65°30′W / 18.2°N 65.5°W – Hurricane Hugo weakens to Category 3 intensity as it makes its third landfall on Vieques, Puerto Rico, with maximum sustained winds of 125 mph (205 km/h) and a central pressure of 945 mbar (27.91 inHg).[29][30][33]
- 13:00 UTC (9:00 a.m. EDT) at 18°18′N 65°36′W / 18.3°N 65.6°W – Hurricane Hugo makes its fourth landfall near Fajardo, Puerto Rico, with maximum sustained winds of 125 mph (205 km/h) and a central pressure of 946 mbar (27.94 inHg), emerging back over the Atlantic Ocean shortly thereafter.[29][33]
September 19

- 06:00 UTC (2:00 a.m. EDT) at 20°42′N 67°18′W / 20.7°N 67.3°W – Hurricane Hugo weakens to Category 2 intensity while located about 180 mi (285 km) north-northwest of San Juan, Puerto Rico.[29][30]
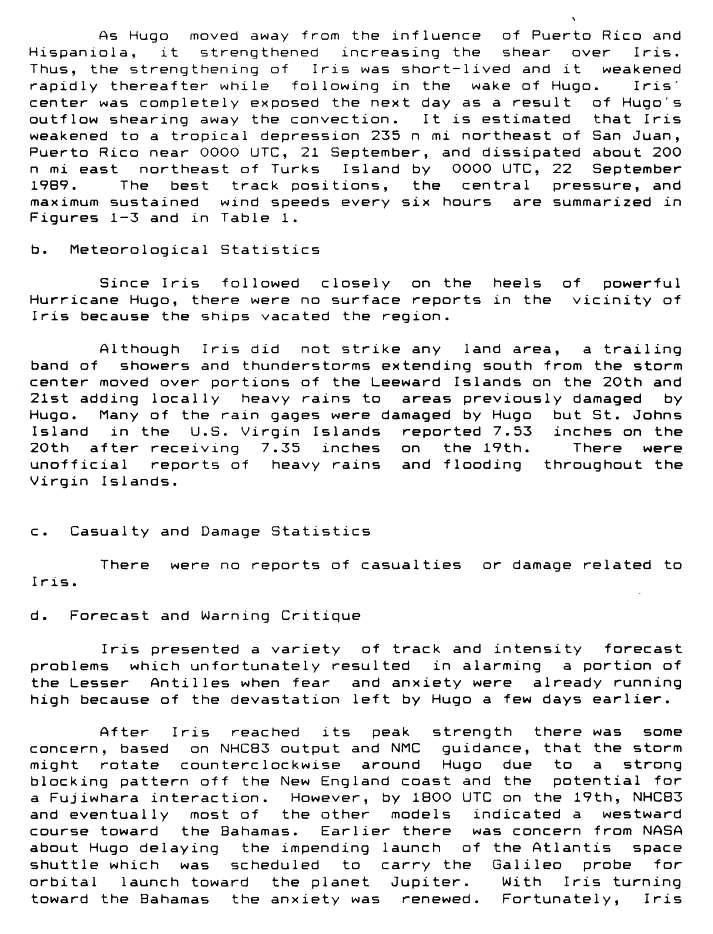
- 12:00 UTC (8:00 a.m. EDT) at 19°12′N 58°12′W / 19.2°N 58.2°W – Tropical Storm Iris attains its peak intensity, with maximum sustained winds of 70 mph (110 km/h) and a minimum central pressure of 1001 mbar (29.56 inHg), while located about 275 mi (445 km) east-northeast of Antigua.[31][32]
September 21
- 00:00 UTC (8:00 p.m. EDT, September 20) at 27°12′N 93°24′W / 27.2°N 93.4°W – Hurricane Hugo restrengthens to Category 3 intensity while located about 545 mi (880 km) southeast of Sullivan's Island, South Carolina.[29][30]
- 00:00 UTC (8:00 p.m. AST, September 20) at 21°54′N 64°06′W / 21.9°N 64.1°W – Tropical Storm Iris weakens into a tropical depression while located about 270 mi (435 km) north-northeast of San Juan.[32][34]
- 18:00 UTC (2:00 p.m. EDT) at 30°12′N 77°30′W / 30.2°N 77.5°W – Hurricane Hugo restrengthens to Category 4 intensity while located about 225 mi (360 km) southeast of Sullivan's Island.[29][30]
- 18:00 UTC (2:00 p.m. EDT) at 22°30′N 67°00′W / 22.5°N 67.0°W – Tropical Depression Iris is last noted as a tropical cyclone while located about 275 mi (445 km) east-northeast of Grand Turk Island, dissipating shortly thereafter under the influence of wind shear generated by Hurricane Hugo.[32][34]
September 22
- 04:00 UTC (12:00 midnight EDT) at 32°48′N 79°48′W / 32.8°N 79.8°W – Hurricane Hugo makes its fifth and final landfall on Sullivan's Island with maximum sustained winds of 140 mph (220 km/h) and a central pressure of 934 mbar (27.58 inHg).[29][33]
- 06:00 UTC (2:00 a.m. EDT) at 33°30′N 80°18′W / 33.5°N 80.3°W – Hurricane Hugo rapidly weakens to Category 2 intensity while located over land about 60 mi (95 km) north-northwest of Sullivan's Island.[29][33]
- 12:00 UTC (8:00 a.m. EDT) at 35°54′N 81°42′W / 35.9°N 81.7°W – Hurricane Hugo rapidly weakens into a tropical storm while located over land about 70 mi (110 km) northwest of Charlotte, North Carolina.[33][35]
September 23
- 00:00 UTC (8:00 p.m. EDT, September 22) at 42°12′N 80°12′W / 42.2°N 80.2°W – Tropical Storm Hugo transitions into an extratropical cyclone while located over land near Erie, Pennsylvania, and later dissipates.[33][35]
October
October 2

- 00:00 UTC (8:00 p.m. AST, October 1) at 11°54′N 43°00′W / 11.9°N 43.0°W – Tropical Depression Thirteen develops from a tropical wave while located about 1,115 mi (1,800 km) east of Barbados.[2][9]
October 3
- 00:00 UTC (8:00 p.m. AST, October 2) at 14°00′N 48°24′W / 14.0°N 48.4°W – Tropical Depression Thirteen attains its peak intensity, with maximum sustained winds of 35 mph (55 km/h) and an unknown central pressure, while located about 750 mi (1,205 km) east of Barbados.[2][9]
October 5
- 12:00 UTC (8:00 a.m. AST) at 22°18′N 49°24′W / 22.3°N 49.4°W – Tropical Depression Thirteen is last noted as a tropical cyclone while located about 915 mi (1,475 km) northeast of Barbados, dissipating shortly thereafter.[nb 5][2][9]
October 12
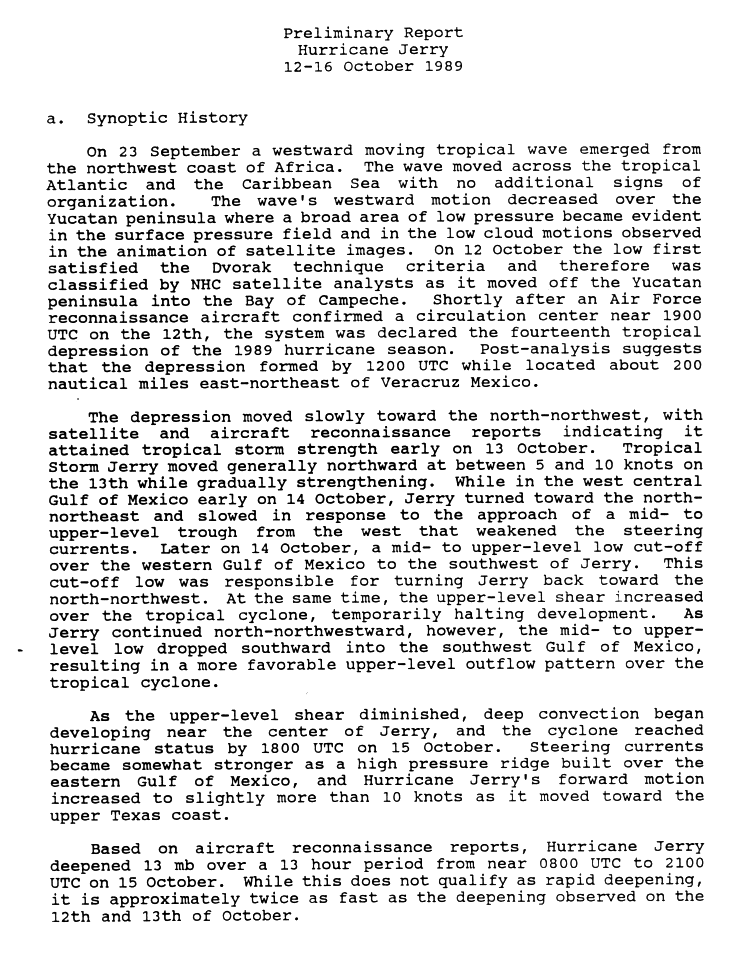
- 12:00 UTC (7:00 a.m. CDT) at 19°24′N 92°24′W / 19.4°N 92.4°W – The fourteenth tropical depression of the season develops from a tropical wave while located about 245 mi (400 km) east of Veracruz, Veracruz.[36][37]
October 13

- 00:00 UTC (7:00 p.m. CDT, October 12) at 20°24′N 93°00′W / 20.4°N 93.0°W – The fourteenth tropical depression of the season strengthens into Tropical Storm Jerry while located about 220 mi (350 km) east-northeast of Veracruz.[36][37]
October 15
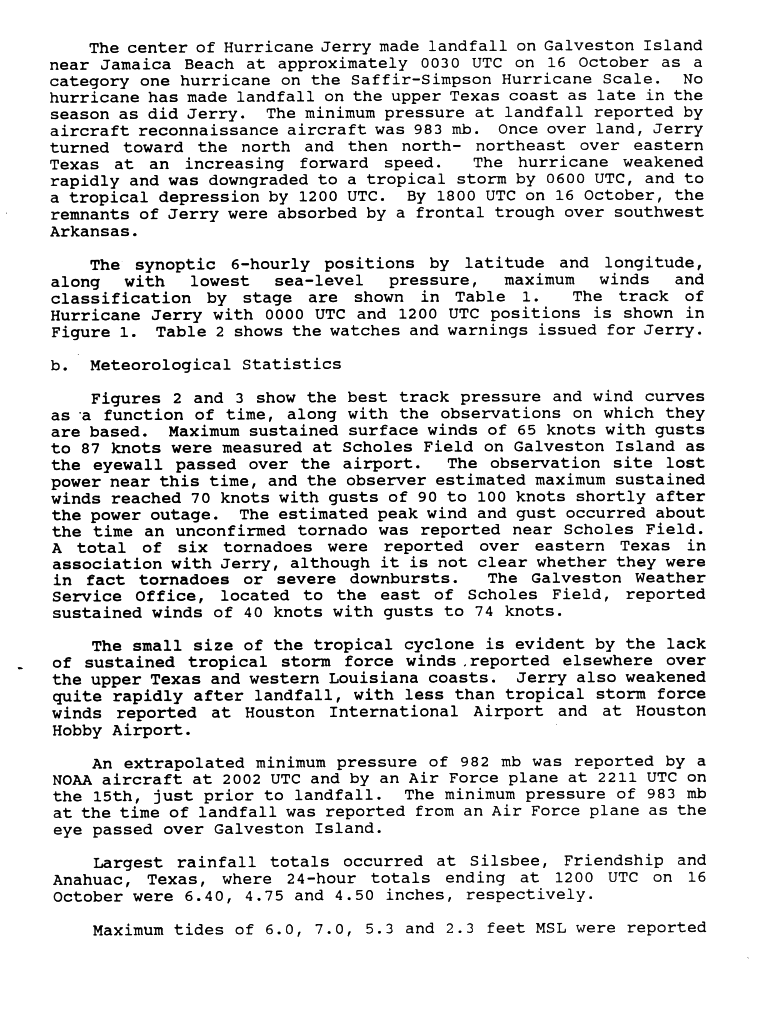
- 18:00 UTC (1:00 p.m. CDT) at 28°06′N 94°36′W / 28.1°N 94.6°W – Tropical Storm Jerry strengthens into a Category 1 hurricane while located about 80 mi (130 km) south-southeast of Jamaica Beach, Texas.[36][37]
- 21:00 UTC (4:00 p.m. CDT) at 28°36′N 94°48′W / 28.6°N 94.8°W – Hurricane Jerry attains a minimum central pressure of 982 mbar (29.00 inHg) while located about 40 mi (65 km) south-southeast of Jamaica Beach.[36][37]
October 16
- 00:00 UTC (7:00 p.m. CDT, October 15) at 29°06′N 95°00′W / 29.1°N 95.0°W – Hurricane Jerry attains peak maximum sustained winds of 85 mph (140 km/h) while located just south of Jamaica Beach.[36][37]
- 00:30 UTC (7:30 p.m. CDT, October 15) at 29°12′N 95°00′W / 29.2°N 95.0°W – Hurricane Jerry makes landfall near Jamaica Beach with maximum sustained winds of 85 mph (140 km/h) and a central pressure of 983 mbar (29.03 inHg).[37][38]
- 06:00 UTC (1:00 p.m. CDT) at 30°24′N 94°54′W / 30.4°N 94.9°W – Hurricane Jerry weakens into a tropical storm while located over land about 50 mi (85 km) north-northeast of Houston.[37][38]
- 12:00 UTC (7:00 a.m. CDT) at 32°00′N 94°30′W / 32.0°N 94.5°W – Tropical Storm Jerry weakens into a tropical depression while located over land about 160 mi (260 km) north-northeast of Houston.[37][38]
- 18:00 UTC (1:00 p.m. CDT) at 33°48′N 93°48′W / 33.8°N 93.8°W – Tropical Depression Jerry dissipates while located over Arkansas as it is absorbed by a weather front.[nb 6][37][38]
November
November 28
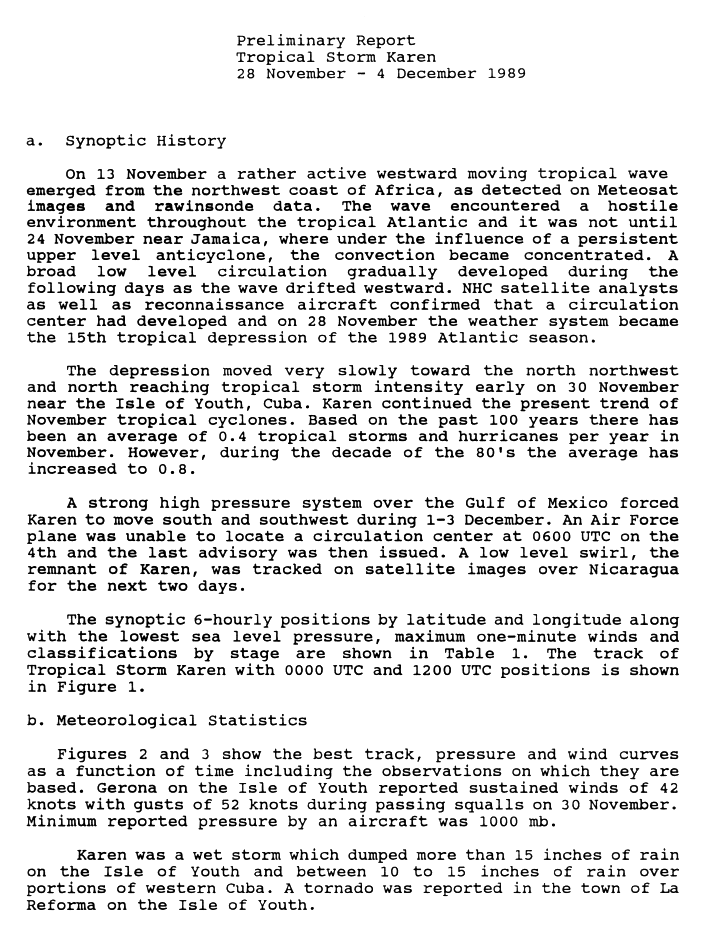
- 12:00 UTC (6:00 a.m. CST)[nb 7] at 17°06′N 84°00′W / 17.1°N 84.0°W – The fifteenth and final tropical depression of the season develops from a tropical wave while located about 165 mi (270 km) east-northeast of the Bay Islands of Honduras.[39][40]
November 30

- 00:00 UTC (6:00 p.m. CST, November 29) at 20°48′N 84°12′W / 20.8°N 84.2°W – The fifteenth tropical depression of the season strengthens into Tropical Storm Karen while located about 110 mi (175 km) southwest of the Cuban Isle of Youth.[39][40]
- 18:00 UTC (12:00 noon CST) at 20°30′N 83°06′W / 20.5°N 83.1°W – Tropical Storm Karen attains its peak intensity, with maximum sustained winds of 60 mph (95 km/h) and a minimum central pressure of 1000 mbar (29.53 inHg), while located about 85 mi (140 km) south of the Isle of Youth.[39][40]
- The 1989 Atlantic hurricane season officially ends[1] with Tropical Storm Karen still active, making Karen a post-season tropical cyclone.[39][40]
December
December 4
- 06:00 UTC (12:00 midnight CST) at 16°30′N 83°54′W / 16.5°N 83.9°W – Tropical Storm Karen weakens below gale force and dissipates while located about 165 mi (270 km) east of the Bay Islands.[nb 8][39][40]
See also
Notes
- ↑ During the period from 1981 to 2010, an average Atlantic hurricane season generated 12.1 tropical storms, 6.4 hurricanes, and 2.7 major hurricanes.[3]
- ↑ All damage figures are in 1989 USD, unless otherwise noted.
- ↑ The annual summary of the 1989 Atlantic hurricane season, as published by Monthly Weather Review in 1990, recognizes Tropical Depression Six as not having formed until August 16.[2]
- ↑ The Preliminary Report for Hurricane Felix does not contain a data point for 06:00 UTC (2:00 a.m. AST) on September 9, instead skipping to 12:00 UTC (8:00 a.m. AST).[27]
- ↑ The Monthly Weather Review report does not explicitly indicate Tropical Depression Thirteen having any history after October 3, only that it was sheared apart by a trough which turned it north on that date.[2]
- ↑ The Atlantic hurricane database (HURDAT) maintains Jerry as a tropical depression at 18:00 UTC (1:00 p.m. CDT) on October 16, terminating it afterwards.[9]
- ↑ Daylight saving time ended on October 29, 1989, resulting in the gap between UTC and local time widening by one hour.
- ↑ HURDAT maintains Karen as a tropical depression at 06:00 UTC (12:00 midnight CST) on December 4, terminating it afterwards.[9]
References
- 1 2 3 4 "Tropical Cyclone Climatology". Miami, Florida: National Hurricane Center. Archived from the original on January 5, 2025. Retrieved August 14, 2026.
- 1 2 3 4 5 6 7 8 9 10 11 12 13 14 15 16 Avila, Lixion (May 1, 1990). "Atlantic Tropical Systems of 1989". Monthly Weather Review. 118 (5). National Hurricane Center: 1178–1185. Bibcode:1990MWRv..118.1178A. doi:10.1175/1520-0493(1990)118<1178:ATSO>2.0.CO;2.
- ↑ "Background Information: The North Atlantic Hurricane Season". College Park, Maryland: Climate Prediction Center. Archived from the original on February 7, 2018. Retrieved August 16, 2026.
- ↑ Lawrence, Miles (November 15, 1989). Preliminary Report, Hurricane Hugo, 10–22 September 1989 (Report). Miami, Florida: National Hurricane Center. p. 3. Archived from the original on September 18, 2025. Retrieved August 17, 2026.
- ↑ Case, Robert (August 16, 1989). Preliminary Report, Tropical Storm Allison 24 – 27 June 1989 (Report). Miami, Florida: National Hurricane Center. p. 4. Archived from the original on July 17, 2026. Retrieved August 17, 2026.
- ↑ Case, Robert (November 23, 1989). Preliminary Report, Hurricane Gabrielle, 30 August – 13 September 1989 (Report). Miami, Florida: National Hurricane Center. p. 3. Archived from the original on October 31, 2025. Retrieved August 17, 2026.
- ↑ "What is UTC or GMT Time?". Miami, Florida: National Hurricane Center. Archived from the original on October 9, 2021. Retrieved February 2, 2026.
- ↑ "Update on National Hurricane Center Products and Services for 2020" (PDF). Miami, Florida: National Hurricane Center. April 20, 2020. Archived (PDF) from the original on August 27, 2021. Retrieved May 17, 2020.
- 1 2 3 4 5 6 7 8 9 10 11 12 13 14 "Atlantic hurricane best track (HURDAT version 2)" (Database). United States National Hurricane Center. April 4, 2025.
 This article incorporates text from this source, which is in the public domain.
- Landsea, Chris (April 2022). "The revised Atlantic hurricane database (HURDAT2) - Chris Landsea – April 2022" (PDF). Hurricane Research Division – NOAA/AOML. Miami, Florida: Hurricane Research Division – via Atlantic Oceanographic and Meteorological Laboratory.
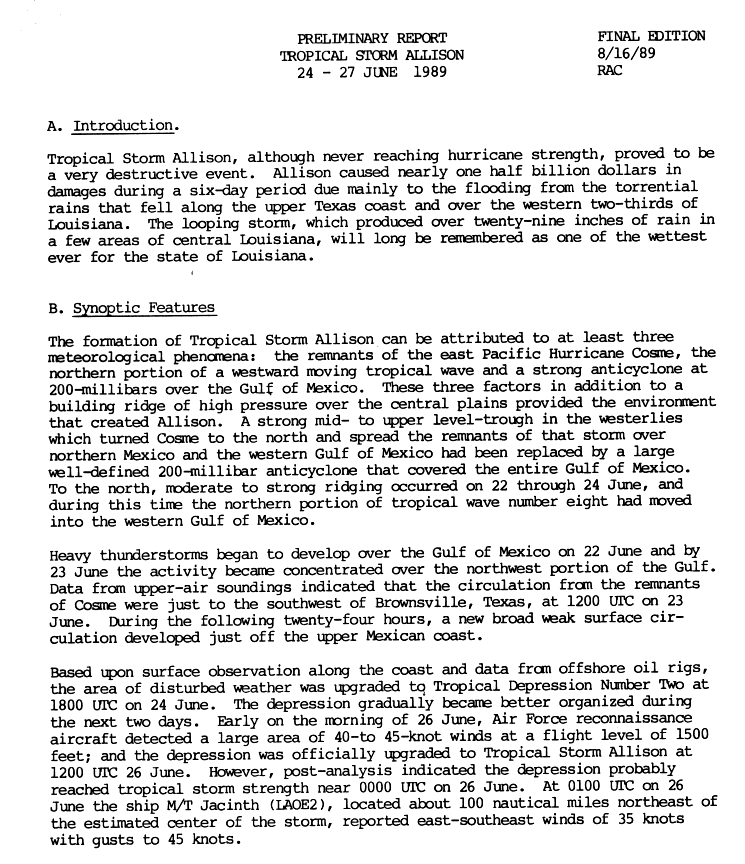
- 1 2 Case, Robert (August 16, 1989). Preliminary Report, Tropical Storm Allison 24–27 June 1989 (Report). Miami, Florida: National Hurricane Center. p. 1. Archived from the original on July 21, 2025. Retrieved August 14, 2026.
- 1 2 3 4 5 6 Case, Robert (August 16, 1989). Preliminary Best Track, Tropical Storm Allison 24–27 June 1989 (Report). Miami, Florida: National Hurricane Center. p. 5. Archived from the original on July 21, 2025. Retrieved August 14, 2026.
- 1 2 3 4 Case, Robert (August 16, 1989). Preliminary Report, Tropical Storm Allison 24 – 27 June 1989 (Report). Miami, Florida: National Hurricane Center. p. 2. Archived from the original on July 21, 2025. Retrieved August 14, 2026.
- 1 2 3 4 5 Lawrence, Miles (August 28, 1989). Preliminary Report, Tropical Storm Barry (9–14 July 1989 (Report). Miami, Florida: National Hurricane Center. p. 1. Archived from the original on November 23, 2025. Retrieved August 14, 2026.
- 1 2 3 4 5 Lawrence, Miles (August 28, 1989). Preliminary Best Track, Tropical Storm Barry, 09–14 July 1989 (Report). Miami, Florida: National Hurricane Center. p. 2. Archived from the original on July 21, 2025. Retrieved August 14, 2026.
- 1 2 Gerrish, Harold (November 22, 1989). Preliminary Report, Hurricane Chantal, 30 July to 3 August 1989 (Report). Miami, Florida: National Hurricane Center. p. 1. Archived from the original on November 20, 2025. Retrieved August 15, 2026.
- 1 2 3 4 5 6 7 8 Gerrish, Harold (November 22, 1989). Preliminary Best Track, Hurricane Chantal, 30 July to 3 August 1989 (Report). Miami, Florida: National Hurricane Center. p. 6. Archived from the original on July 21, 2025. Retrieved August 15, 2026.
- 1 2 3 4 5 6 7 8 9 Mayfield, Max (November 19, 1989). Preliminary Report, Hurricane Dean, 31 July – 8 August 1989 (Report). Miami, Florida: National Hurricane Center. p. 1. Archived from the original on November 21, 2025. Retrieved August 15, 2026.
- 1 2 3 4 5 6 7 8 9 Mayfield, Max (November 19, 1989). Preliminary Best Track, Hurricane Dean, 31 July – 9 August 1989 (Report). Miami, Florida: National Hurricane Center. p. 7. Archived from the original on July 21, 2025. Retrieved August 15, 2026.
- 1 2 3 4 5 6 Gerrish, Harold (November 22, 1989). Preliminary Report, Hurricane Chantal, 30 July to 3 August 1989 (Report). Miami, Florida: National Hurricane Center. p. 2. Archived from the original on July 21, 2025. Retrieved August 15, 2026.
- 1 2 3 4 5 6 7 Gross, Jim (December 4, 1989). Preliminary Report, Hurricane Erin (18–27 August 1989) (Report). Miami, Florida: National Hurricane Center. p. 1. Archived from the original on July 21, 2025. Retrieved August 15, 2026.
- 1 2 3 4 5 6 7 Gross, Jim (December 4, 1989). Preliminary Best Track – Hurricane Erin (Report). Miami, Florida: National Hurricane Center. p. 4. Archived from the original on July 21, 2025. Retrieved August 15, 2026.
- 1 2 3 4 5 6 7 8 Clark, Gil (November 17, 1989). Preliminary Report, Hurricane Felix, 25 August – 10 September 1989 (Report). Miami, Florida: National Hurricane Center. p. 1. Archived from the original on October 11, 2025. Retrieved August 15, 2026.
- 1 2 3 4 Clark, Gil (November 17, 1989). Preliminary Best Track, Hurricane Felix, 26 August – 10 September 1989 (Report). Miami, Florida: National Hurricane Center. p. 3. Archived from the original on July 21, 2025. Retrieved August 15, 2026.
- 1 2 3 4 5 6 7 8 Case, Robert (November 23, 1989). Preliminary Report, Hurricane Gabrielle, 30 August – 13 September 1989 (Report). Miami, Florida: National Hurricane Center. p. 1. Archived from the original on July 21, 2025. Retrieved August 15, 2026.
- 1 2 3 4 5 6 7 8 9 Case, Robert (November 23, 1989). Preliminary Best Track, Hurricane Gabrielle, 30 August – 13 September 1989 (Report). Miami, Florida: National Hurricane Center. p. 5. Archived from the original on July 21, 2025. Retrieved August 15, 2026.
- 1 2 3 4 5 Case, Robert (November 23, 1989). Preliminary Best Track, Hurricane Gabrielle, 30 August – 13 September 1989 (Cont.) (Report). Miami, Florida: National Hurricane Center. p. 6. Archived from the original on December 5, 2025. Retrieved August 15, 2026.
- 1 2 3 4 Clark, Gil (November 17, 1989). Preliminary Best Track, Hurricane Felix, 26 August – 10 September 1989 (Cont.) (Report). Miami, Florida: National Hurricane Center. p. 4. Archived from the original on July 21, 2025. Retrieved August 15, 2026.
- 1 2 3 4 5 6 Case, Robert (November 23, 1989). Preliminary Report, Hurricane Gabrielle, 30 August – 13 September 1989 (Report). Miami, Florida: National Hurricane Center. p. 2. Archived from the original on July 21, 2025. Retrieved August 15, 2026.
- 1 2 3 4 5 6 7 8 9 10 11 12 13 14 15 16 17 Lawrence, Miles (November 15, 1989). Preliminary Report, Hurricane Hugo, 10–22 September 1989 (Report). Miami, Florida: National Hurricane Center. p. 1. Archived from the original on August 4, 2025. Retrieved August 15, 2026.
- 1 2 3 4 5 6 7 8 9 10 11 12 Lawrence, Miles (November 15, 1989). Preliminary Best Track, Hurricane Hugo, 10–22 September 1989 (Report). Miami, Florida: National Hurricane Center. p. 6. Archived from the original on July 18, 2025. Retrieved August 15, 2026.
- 1 2 3 Gerrish, Harold (November 20, 1989). Preliminary Report, Tropical Storm Iris, 16–21 September 1989 (Report). Miami, Florida: National Hurricane Center. p. 1. Archived from the original on July 6, 2026. Retrieved August 16, 2026.
- 1 2 3 4 5 Gerrish, Harold (November 20, 1989). Preliminary Best Track, Tropical Storm Iris, 16–21 September 1989 (Report). Miami, Florida: National Hurricane Center. p. 7. Archived from the original on July 21, 2025. Retrieved August 16, 2026.
- 1 2 3 4 5 6 7 8 Lawrence, Miles (November 15, 1989). Preliminary Best Track, Hurricane Hugo, 10–22 September 1989 (Report). Miami, Florida: National Hurricane Center. p. 7. Archived from the original on July 18, 2025. Retrieved August 16, 2026.
- 1 2 Gerrish, Harold (November 20, 1989). Preliminary Report, Tropical Storm Iris, 16–21 September 1989 (Report). Miami, Florida: National Hurricane Center. p. 2. Archived from the original on November 19, 2025. Retrieved August 16, 2026.
- 1 2 Lawrence, Miles (November 15, 1989). Preliminary Report, Hurricane Hugo, 10–22 September 1989 (Report). Miami, Florida: National Hurricane Center. p. 2. Archived from the original on July 18, 2025. Retrieved August 16, 2026.
- 1 2 3 4 5 Mayfield, Max (November 21, 1989). Preliminary Report, Hurricane Jerry, 12–16 October 1989 (Report). Miami, Florida: National Hurricane Center. p. 1. Archived from the original on July 21, 2025. Retrieved August 16, 2026.
- 1 2 3 4 5 6 7 8 9 Mayfield, Max (November 21, 1989). Preliminary Best Track, Hurricane Jerry, 12–16 October 1989 (Report). Miami, Florida: National Hurricane Center. p. 9. Archived from the original on January 12, 2026. Retrieved August 16, 2026.
- 1 2 3 4 Mayfield, Max (November 21, 1989). Preliminary Report, Hurricane Jerry, 12–16 October 1989 (Report). Miami, Florida: National Hurricane Center. p. 2. Archived from the original on July 21, 2025. Retrieved August 16, 2026.
- 1 2 3 4 5 Avila, Lixion (December 22, 1989). Preliminary Report, Tropical Storm Karen, 28 November – 4 December 1989 (Report). Miami, Florida: National Hurricane Center. p. 1. Archived from the original on July 11, 2026. Retrieved August 16, 2026.
- 1 2 3 4 5 Avila, Lixion (December 22, 1989). Preliminary Best Track, Tropical Storm Karen, 28 November – 4 December 1989 (Report). Miami, Florida: National Hurricane Center. p. 4. Archived from the original on July 21, 2025. Retrieved August 16, 2026.

































External links

- The National Hurricane Center's storm wallet for the 1989 Atlantic hurricane season