Timeline of the 1982 Atlantic hurricane season
| Timeline of the 1982 Atlantic hurricane season | |||||
|---|---|---|---|---|---|
 Season summary map | |||||
| Season boundaries | |||||
| First system formed | June 2, 1982 | ||||
| Last system dissipated | October 3, 1982 | ||||
| Strongest system | |||||
| Name | Debby | ||||
| Maximum winds | 130 mph (215 km/h) (1-minute sustained) | ||||
| Lowest pressure | 950 mbar (hPa; 28.05 inHg) | ||||
| Longest lasting system | |||||
| Name | Beryl | ||||
| Duration | 9.25 days | ||||
| |||||
The 1982 Atlantic hurricane season was an event in the annual tropical cyclone season in the north Atlantic Ocean. It was an inactive Atlantic hurricane season, during which only five tropical cyclones formed.[1] The season officially began on June 1, 1982 and ended November 30, 1982. These dates, adopted by convention, historically describe the period in each year when most systems form.[2] The first system, Hurricane Alberto, formed on June 2; the final system, Tropical Storm Ernesto dissipated on October 3.
Altoghther, this season produced eight tropical depressions, of which five became named storms; two attained hurricane strength, of which one became a major hurricane.[nb 1][1] This was Hurricane Debby, which attained sustained winds of 130 mph (215 km/h) and an atmospheric pressure of 950 mbar (28.05 inHg).
This timeline documents tropical cyclone formations, strengthening, weakening, landfalls, extratropical transitions, and dissipations during the season. It includes information that was not released throughout the season, meaning that data from post-storm reviews by the National Hurricane Center, such as a storm that was not initially warned upon, has been included.
The time stamp for each event is stated using Coordinated Universal Time (UTC), the 24-hour clock where 00:00 = midnight UTC[4] and the time zone where the center of the tropical cyclone is currently located. The time zones utilized (east to west) prior to 2020 were: Atlantic, Eastern, and Central.[5] In this timeline, the respective area time is included in parentheses. Additionally, figures for maximum sustained winds and position estimates are rounded to the nearest 5 units (miles, or kilometers), following National Hurricane Center practice. Direct wind observations are rounded to the nearest whole number. Atmospheric pressures are listed to the nearest millibar and nearest hundredth of an inch of mercury.
Timeline

June
June 1
- The Atlantic hurricane season officially begins.[6]
June 2
- 18:00 UTC (2:00 p.m. EDT) at 22°12′N 86°30′W / 22.2°N 86.5°W – The first tropical depression of the season forms from a low-pressure area over the southeastern Gulf of Mexico near the northeastern Yucatán Peninsula.[nb 2][8][9][10]
June 3

- 06:00 UTC (2:00 a.m. EDT) at 22°48′N 85°00′W / 22.8°N 85.0°W – The first tropical depression of the season strengthens into Tropical Storm Alberto about 65 mi (100 km) north of Cape San Antonio, Cuba.[8][9][10]
- 18:00 UTC (2:00 p.m. EDT) at 24°00′N 83°36′W / 24.0°N 83.6°W – Tropical Storm Alberto strengthens into a Category 1 hurricane on the Saffir–Simpson scale about 165 mi (270 km) north-northeast of Cape San Antonio, or about 120 mi (195 km) west-southwest of Key West, Florida. It simultaneously attains its peak intensity, with maximum sustained winds of 85 mph (140 km/h) and a minimum central pressure of 985 mbar (29.09 inHg).[8][9][10]
June 4
- 06:00 UTC (2:00 a.m. EDT) at 24°54′N 84°06′W / 24.9°N 84.1°W – Hurricane Alberto weakens into a tropical storm about 150 mi (240 km) west of Key West.[8][9][10]
June 5
- 00:00 UTC (8:00 p.m. EDT, June 4) at 25°06′N 84°06′W / 25.1°N 84.1°W – Tropical Storm Alberto weakens into a tropical depression about 150 mi (240 km) west-northwest of Key West.[8][9][10]
June 6
- 12:00 UTC (8:00 a.m. EDT) at 25°30′N 82°36′W / 25.5°N 82.6°W – Tropical Depression Alberto degenerates into a tropical disturbance about 80 mi (130 km) northwest of Key West, dissipating shortly thereafter.[nb 3][8][9][10]
June 18
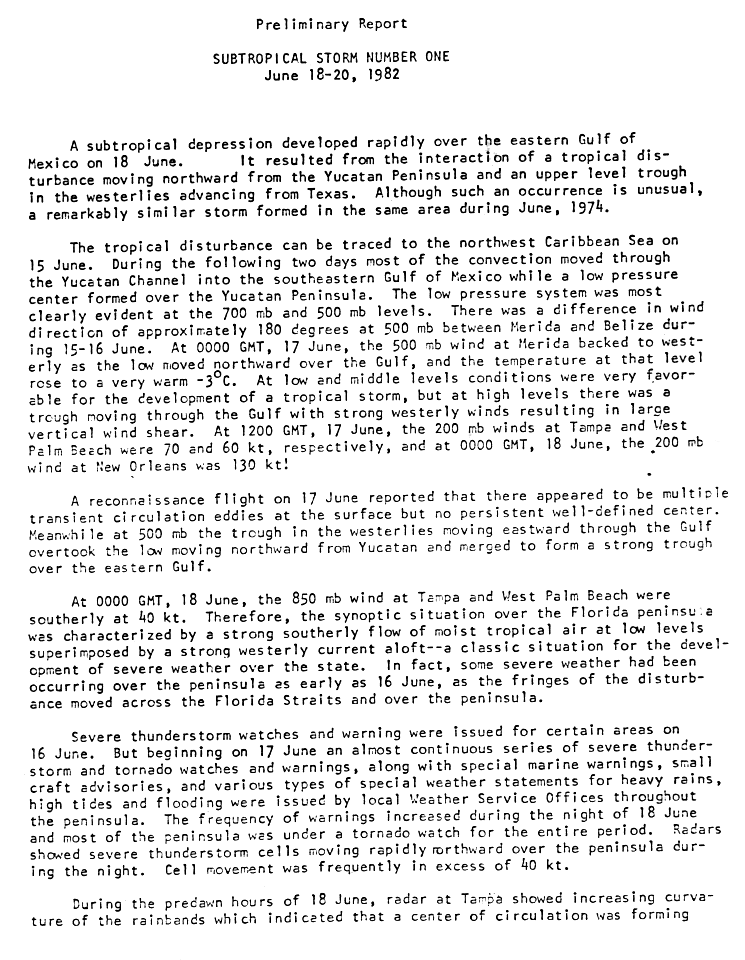
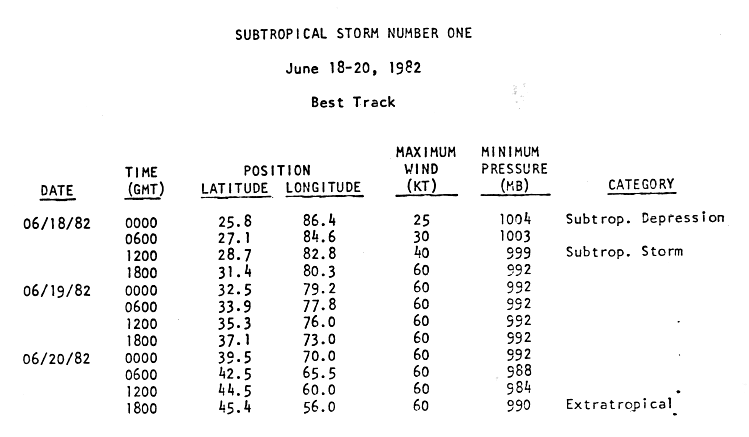
- 00:00 UTC (7:00 p.m. CDT, June 17) at 25°48′N 86°24′W / 25.8°N 86.4°W – Subtropical Depression One forms from an interaction between a tropical disturbance and an upper-level trough about 280 mi (455 km) west-southwest of Tampa, Florida.[11][12]
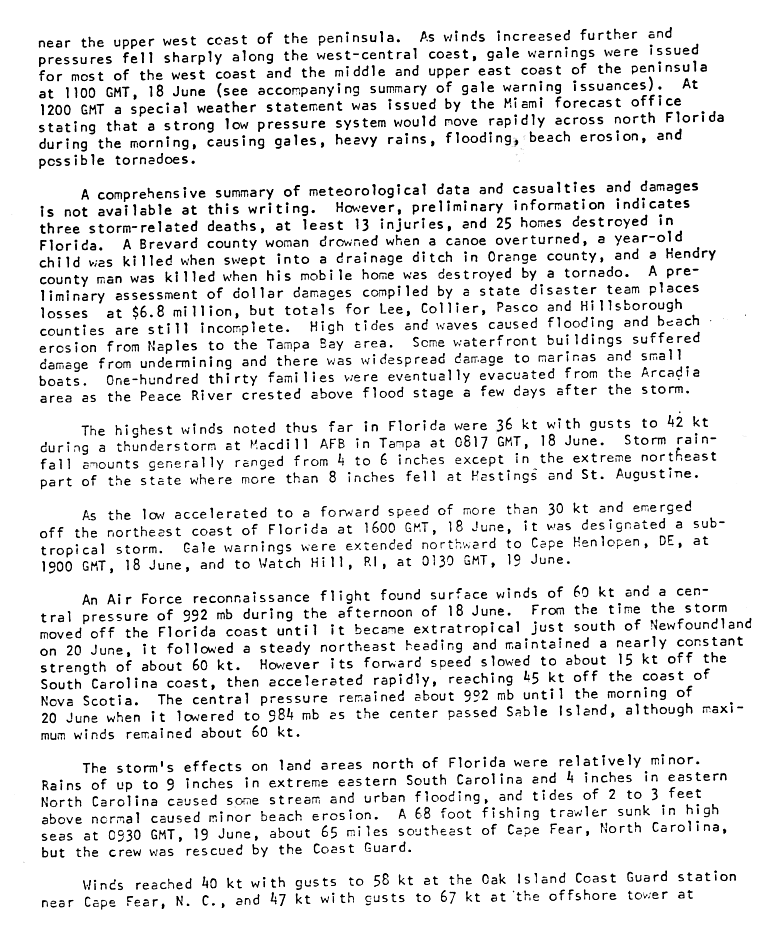
- 12:00 UTC (8:00 a.m. EDT) at 28°42′N 82°48′W / 28.7°N 82.8°W – Subtropical Depression One strengthens into a subtropical storm about 60 mi (95 km) north-northwest of Tampa, with maximum sustained winds of 45 mph (75 km/h) and a central pressure of 999 mbar (29.50 inHg). It makes its first landfall in Florida shortly thereafter.[11][12]
- 16:00 UTC (12:00 p.m. EDT), exact location unknown – Subtropical Storm One emerges over the Atlantic Ocean from Florida's First Coast.[13]
June 19

- ~12:00 UTC (8:00 a.m. EDT) near 35°18′N 76°00′W / 35.3°N 76.0°W – Subtropical Storm One moves over the Outer Banks of North Carolina with maximum sustained winds of 70 mph (110 km/h) and a central pressure of 992 mbar (29.29 inHg).[12][13]
June 20
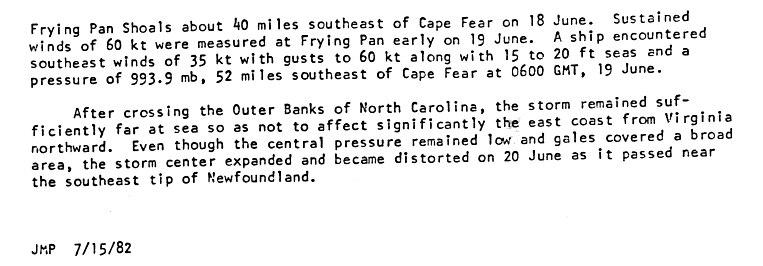
- 12:00 UTC (8:00 a.m. AST) at 44°30′N 60°00′W / 44.5°N 60.0°W – Subtropical Storm One attains its peak intensity, with maximum sustained winds of 70 mph (110 km/h) and a minimum central pressure of 984 mbar (29.06 inHg), about 40 mi (65 km) north of Sable Island offshore Atlantic Canada.[12][13]
- 18:00 UTC (2:00 p.m. AST) at 45°24′N 56°00′W / 45.4°N 56.0°W – Subtropical Storm One transitions into an extratropical cyclone about 220 mi (350 km) east-northeast of Sable Island, dissipating shortly thereafter off the southeastern tip of Newfoundland.[12][14]
July
There were no tropical cyclones during the month of July.[1]
August
August 28
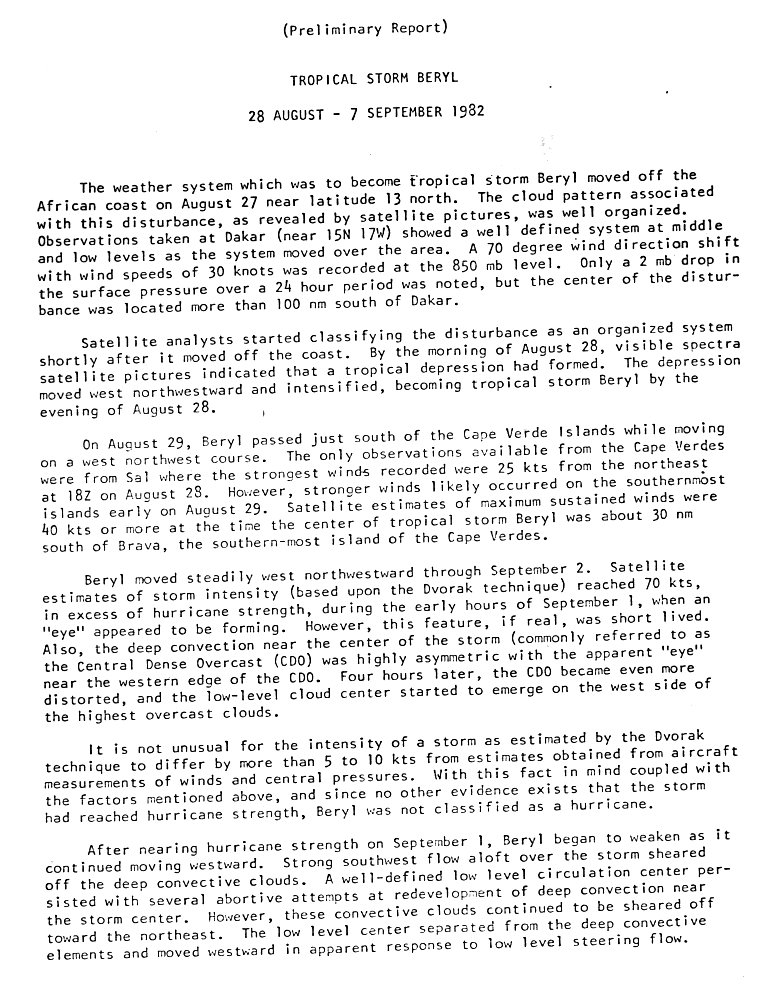
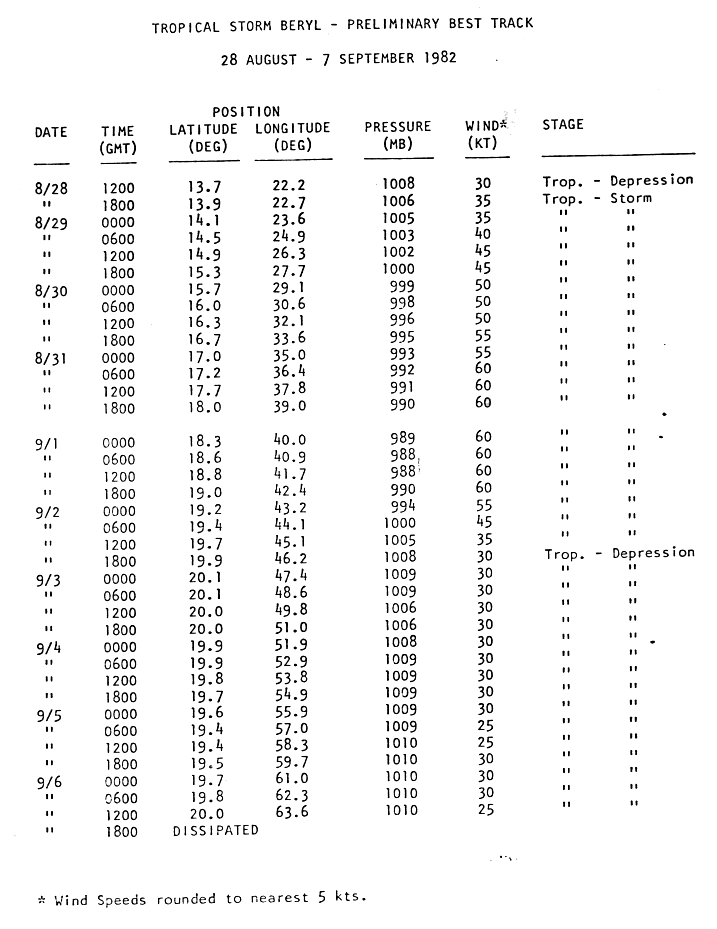
- 12:00 UTC (8:00 a.m. AST) at 13°42′N 22°12′W / 13.7°N 22.2°W – The second tropical depression of the season forms from a tropical wave about 120 mi (195 km) southeast of Praia, Cape Verde.[15][16]
- 18:00 UTC (2:00 p.m. AST) at 13°54′N 22°42′W / 13.9°N 22.7°W – The second tropical depression of the season strengthens into Tropical Storm Beryl about 85 mi (140 km) southeast of Praia.[15][16]
August 29
- 06:00 UTC (2:00 a.m. AST) at 14°30′N 24°54′W / 14.5°N 24.9°W – Tropical Storm Beryl makes its closest approach to Cape Verde, passing about 35 mi (55 km) south of Brava with maximum sustained winds of 45 mph (75 km/h) and a central pressure of 1003 mbar (29.62 inHg).[15][16]
September
September 1

- 06:00 UTC (2:00 a.m. AST) at 18°36′N 40°54′W / 18.6°N 40.9°W – Tropical Storm Beryl attains its peak intensity, with maximum sustained winds of 70 mph (110 km/h) and a minimum central pressure of 988 mbar (29.176 inHg), about 1,100 mi (1,770 km) west-northwest of Brava.[15][16]
September 2
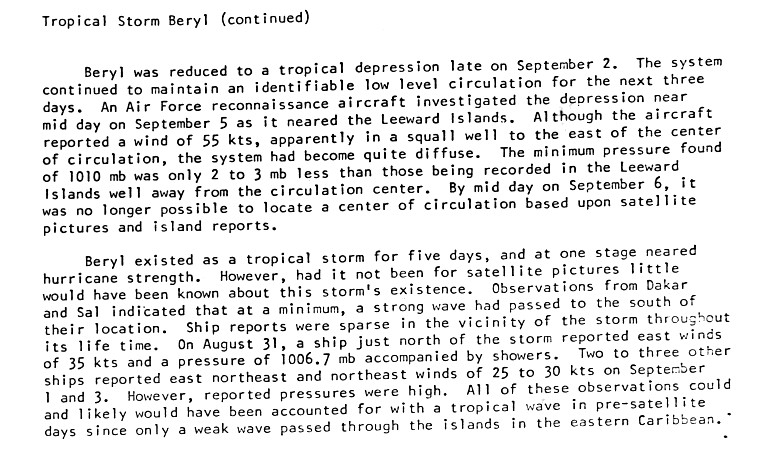
- 18:00 UTC (2:00 p.m. AST) at 19°54′N 46°12′W / 19.9°N 46.2°W – Tropical Storm Beryl weakens into a tropical depression about 1,455 mi (2,345 km) west-northwest of Brava, or about 960 mi (1,545 km) east of the Leeward Islands.[16][17]
September 6
- 00:00 UTC (8:00 p.m. AST, September 5) at 16°48′N 53°00′W / 16.8°N 53.0°W – Tropical Depression Three forms about 560 mi (900 km) east of Guadeloupe.[1]
- 12:00 UTC (8:00 a.m. AST) at 20°00′N 63°36′W / 20.0°N 63.6°W – Tropical Depression Beryl is last noted as a tropical cyclone just north of the Leeward Islands,[18] dissipating shortly thereafter.[16][17]
- 18:00 UTC (2:00 p.m. AST) at 17°42′N 56°12′W / 17.7°N 56.2°W – Tropical Depression Three attains its peak intensity, with maximum sustained winds of 35 mph (55 km/h) and an unknown minimum central pressure.[1]
September 9
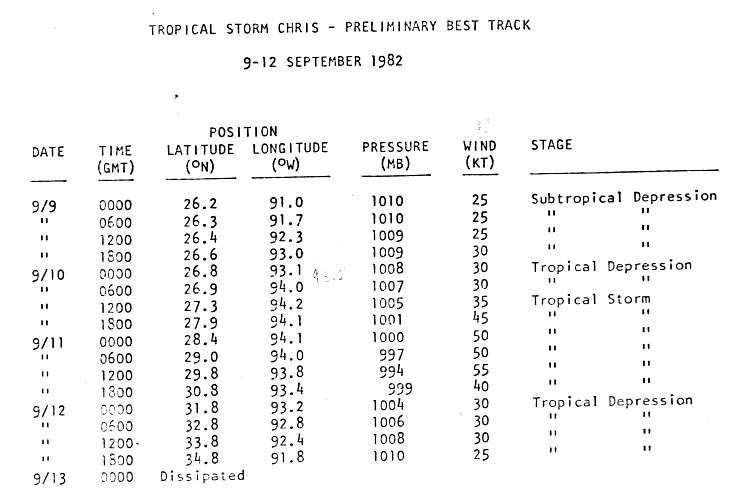
- 00:00 UTC (7:00 p.m. CDT, September 8) at 26°12′N 91°00′W / 26.2°N 91.0°W – A subtropical depression forms from an upper-level low about 305 mi (490 km) south-southeast of Lake Charles, Louisiana.[19][20]
- 12:00 UTC (8:00 a.m. EDT) at 24°00′N 66°00′W / 24.0°N 66.0°W – Tropical Depression Three is last noted as a tropical cyclone well north of Puerto Rico, dissipating shortly thereafter.[1]
September 10
- 00:00 UTC (7:00 p.m. CDT, September 9) at 26°48′N 93°06′W / 26.8°N 93.1°W – The subtropical depression which had formed 24 hours earlier transitions into a tropical depression about 235 mi (380 km) south of Lake Charles.[19][20]
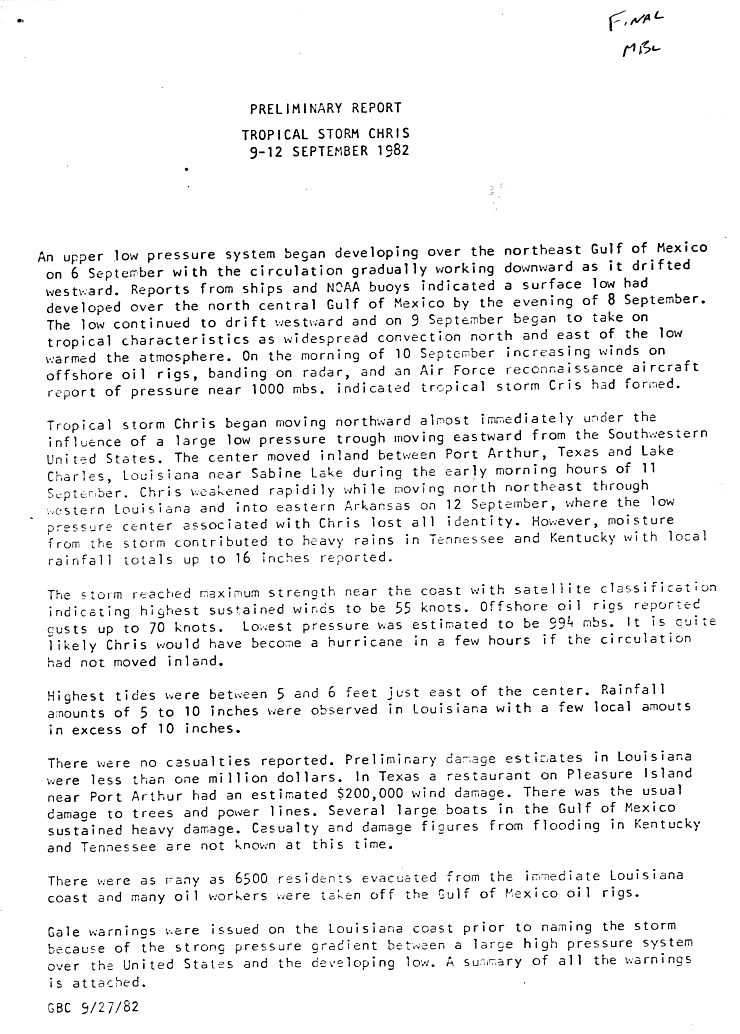
- 12:00 UTC (7:00 a.m. CDT) at 27°18′N 94°12′W / 27.3°N 94.2°W – The recently transitioned tropical depression strengthens into Tropical Storm Chris about 205 mi (335 km) south-southwest of Lake Charles, or about 180 mi (285 km) south of Port Arthur, Texas.[19][20]
September 11

- 12:00 UTC (7:00 a.m. CDT) at 29°48′N 93°48′W / 29.8°N 93.8°W – Tropical Storm Chris attains its peak intensity as it makes landfall near Sabine Pass between Port Arthur and Lake Charles, with maximum sustained winds of 65 mph (100 km/h) and a minimum central pressure of 994 mbar (29.35 inHg).[19][20]
September 12
- 00:00 UTC (7:00 p.m. CDT, September 11) at 31°48′N 93°12′W / 31.8°N 93.2°W – Tropical Storm Chris weakens into a tropical depression over land about 110 mi (175 km) north of Lake Charles.[19][20]
- 18:00 UTC (1:00 p.m. CDT) at 34°48′N 91°48′W / 34.8°N 91.8°W – Tropical Depression Chris is last noted as a tropical cyclone over land about 330 mi (530 km) north-northeast of Lake Charles, dissipating over Arkansas shortly thereafter.[19][20]
September 13
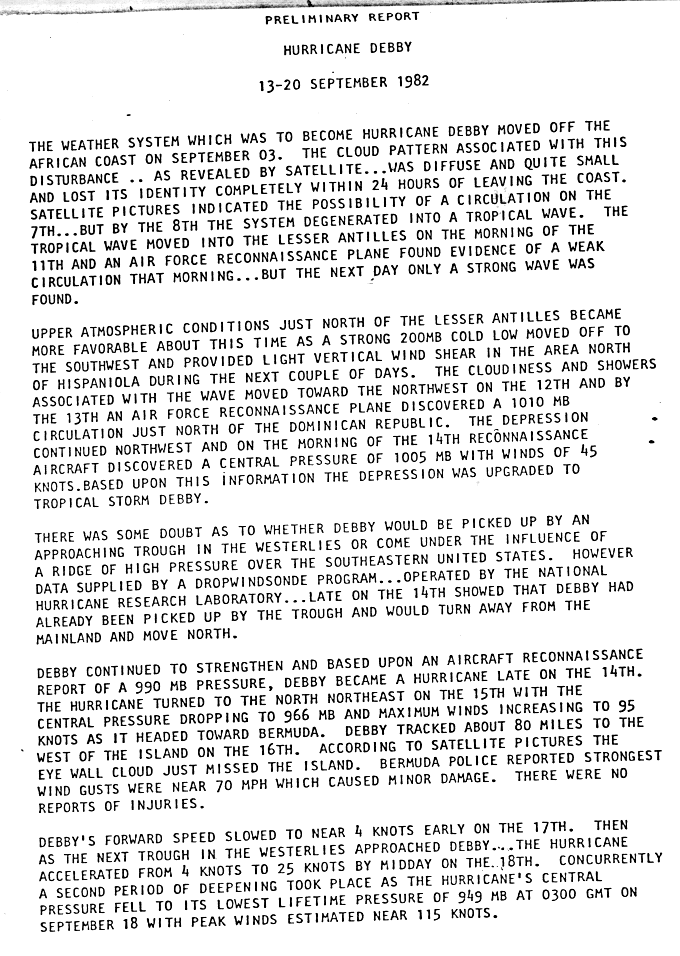
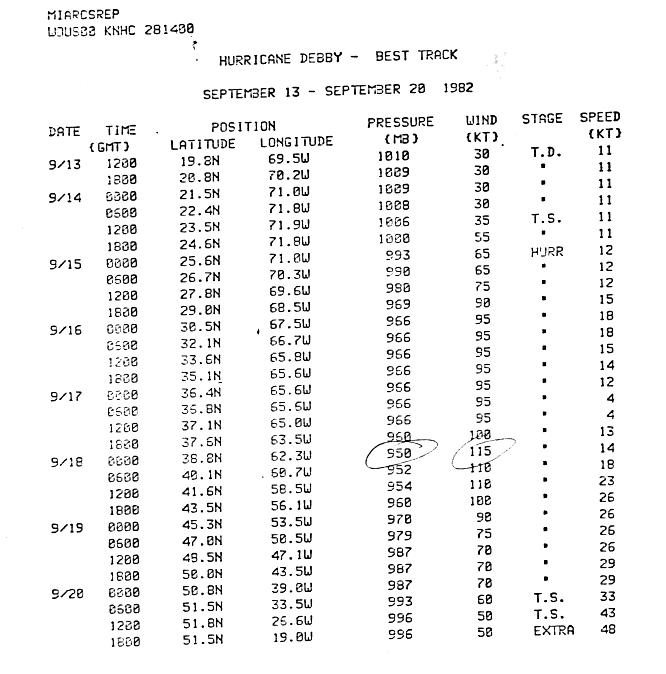
- 12:00 UTC (8:00 a.m. EDT) at 19°48′N 69°30′W / 19.8°N 69.5°W – Tropical Depression Five forms from a tropical wave about 100 mi (155 km) north-northeast of Santo Domingo, Dominican Republic.[21][22]
September 14
- 12:00 UTC (8:00 a.m. EDT) at 23°30′N 71°54′W / 23.5°N 71.9°W – Tropical Depression Five strengthens into Tropical Storm Debby about 370 mi (595 km) north-northwest of Santo Domingo.[21][22]
September 15
- 00:00 UTC (8:00 p.m. EDT, September 14) at 25°36′N 71°00′W / 25.6°N 71.0°W – Tropical Storm Debby strengthens into a Category 1 hurricane about 495 mi (795 km) north of Santo Domingo, or about 600 mi (965 km) southwest of Bermuda.[21][22]
- 18:00 UTC (2:00 p.m. EDT) at 29°00′N 68°30′W / 29.0°N 68.5°W – Hurricane Debby strengthens to Category 2 intensity about 320 mi (520 km) southwest of Bermuda.[21][22]
September 16
- Exact time and location unknown – Tropical Depression Six forms 900 miles (1,400 km) west of the Cape Verde Islands.[23]
September 17

- 18:00 UTC (2:00 p.m. AST) at 37°36′N 63°30′W / 37.6°N 63.5°W – Hurricane Debby strengthens to Category 3 intensity about 375 mi (600 km) north of Bermuda.[21][22]
September 18
- 00:00 UTC (8:00 p.m. AST, September 17) at 38°48′N 62°18′W / 38.8°N 62.3°W – Hurricane Debby strengthens to Category 4 intensity about 465 mi (750 km) north-northeast of Bermuda.[21][22]
- 03:00 UTC (11:00 p.m. AST, September 17), exact location unknown – Hurricane Debby attains its peak intensity, with maximum sustained winds of 130 mph (215 km/h) and a minimum central pressure of 949 mbar (28.02 inHg), making it the strongest storm of the season.[21]
- 06:00 UTC (2:00 a.m. AST) at 40°06′N 60°42′W / 40.1°N 60.7°W – Hurricane Debby weakens to Category 3 intensity about 580 mi (935 km) north-northeast of Bermuda, or 595 mi (955 km) southwest of Cape Race, Newfoundland.[21][22][24]
September 19
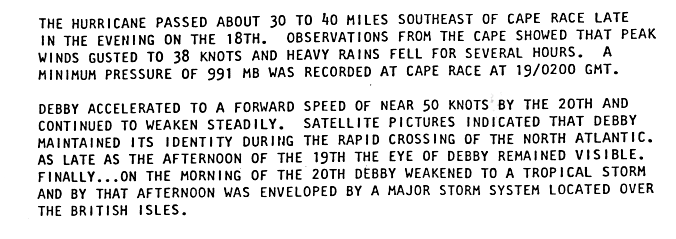
- 00:00 UTC (8:00 p.m. AST, September 18) at 45°18′N 53°30′W / 45.3°N 53.5°W – Hurricane Debby weakens to Category 2 intensity about 100 mi (155 km) south of Cape Race.[22][24]
- 06:00 UTC (2:00 a.m. AST) at 47°00′N 50°30′W / 47.0°N 50.5°W – Hurricane Debby weakens to Category 1 intensity about 125 mi (205 km) east of Cape Race.[22][24]
September 20
- 06:00 UTC (2:00 a.m. AST) at 51°30′N 33°30′W / 51.5°N 33.5°W – Hurricane Debby weakens into a tropical storm about 945 mi (1,520 km) east-northeast of Cape Race.[22][24]
- 18:00 UTC (2:00 p.m. AST) at 51°30′N 19°00′W / 51.5°N 19.0°W – Tropical Storm Debby transitions into an extratropical cyclone about 1,560 mi (2,510 km) east-northeast of Cape Race, and later dissipates.[22][24]
- Exact time and location unknown – Tropical Depression Six dissipates 750 miles (1,210 km) east of the Leeward Islands.[25]
September 24
- 00:00 UTC (8:00 p.m. EDT, September 23) at 25°18′N 71°30′W / 25.3°N 71.5°W – Tropical Depression Seven forms about 360 mi (585 km) east of Nassau, Bahamas.[1]
- 18:00 UTC (2:00 p.m. EDT) at 28°06′N 72°06′W / 28.1°N 72.1°W – Tropical Depression Seven attains its peak intensity, with maximum sustained winds of 35 mph (55 km/h) and an unknown minimum central pressure, about 385 mi (620 km) northeast of Nassau.[1]
September 27
- 12:00 UTC (8:00 a.m. AST) at 40°06′N 60°06′W / 40.1°N 60.1°W – Tropical Depression Seven is last noted as a tropical cyclone over the north-central Atlantic Ocean, dissipating shortly thereafter.[1]
September 30
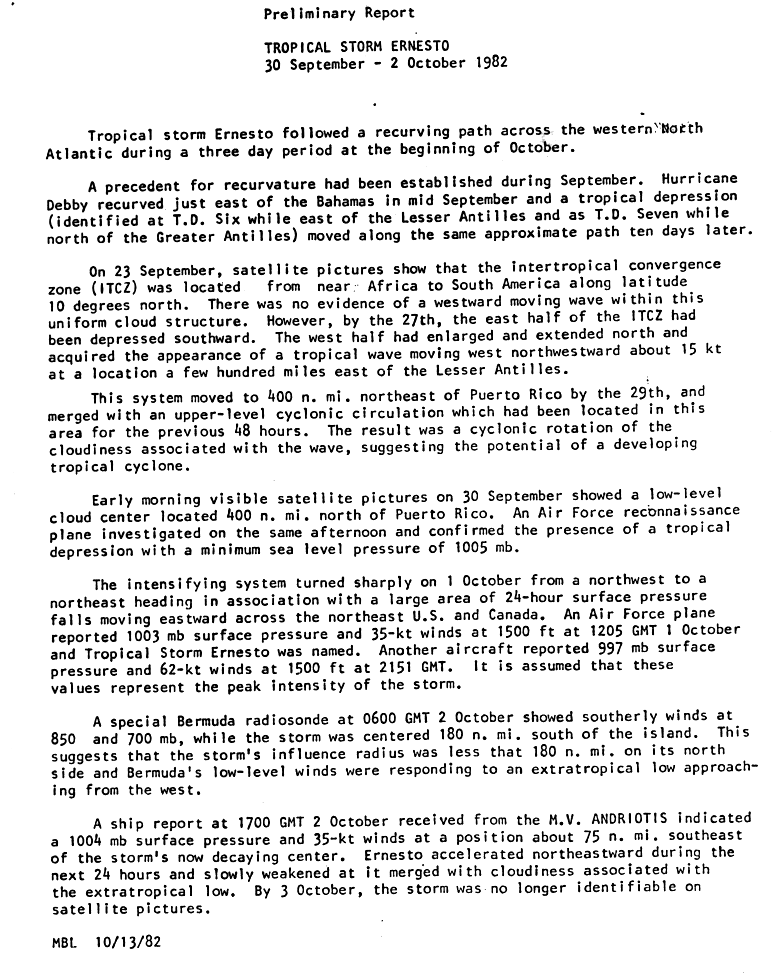
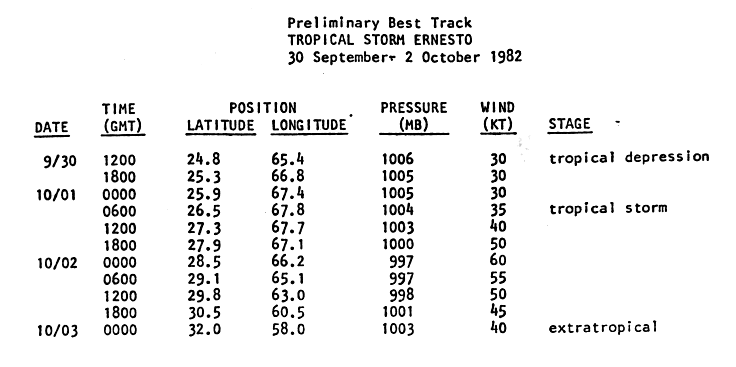
- 12:00 UTC (8:00 a.m. EDT) at 24°48′N 65°24′W / 24.8°N 65.4°W – Tropical Depression Eight forms from an Intertropical Convergence Zone disturbance about 445 mi (715 km) north of San Juan, Puerto Rico.[26][27]
October
October 1

- 06:00 UTC (2:00 a.m. EDT) at 26°30′N 67°48′W / 26.5°N 67.8°W – Tropical Depression Eight strengthens into Tropical Storm Ernesto about 570 mi (915 km) north of San Juan, or about 445 mi (715 km) south-southwest of Bermuda.[26][27]
October 2
- 00:00 UTC (8:00 p.m. EDT, October 1) at 28°30′N 66°12′W / 28.5°N 66.2°W – Tropical Storm Ernesto attains its peak intensity, with maximum sustained winds of 70 mph (110 km/h) and a minimum central pressure of 997 mbar (29.44 inHg), about 275 mi (445 km) south-southwest of Bermuda.[26][27]
October 3
- 00:00 UTC (8:00 p.m. AST, October 2) at 32°00′N 58°00′W / 32.0°N 58.0°W – Tropical Storm Ernesto transitions into an extratropical cyclone about 395 mi (640 km) east of Bermuda, and later dissipates.[26][27]
November
There were no tropical cyclones during the month of November.[1]
November 30
- The Atlantic hurricane season officially ends.[6]
See also
Notes
References
- 1 2 3 4 5 6 7 8 9 10 National Hurricane Center (2008). "All Tropical Cyclone Tracks for the Atlantic and Eastern Pacific". Hydrometeorological Prediction Center. Retrieved 2008-11-20.
- ↑ Dorst, Neal (June 1, 2018). "Hurricane Season Information". Frequently Asked Questions About Hurricanes. Miami, Florida: Atlantic Oceanographic and Meteorological Laboratory. Retrieved June 29, 2020.
- ↑ "Saffir-Simpson Hurricane Wind Scale". nhc.noaa.gov. Miami Florida: National Hurricane Center. Retrieved July 14, 2020.
- ↑ "What is UTC or GMT Time?". Miami, Florida: National Hurricane Center. Retrieved February 2, 2026.
- ↑ "Update on National Hurricane Center Products and Services for 2020" (PDF). Miami, Florida: National Hurricane Center. April 20, 2020. Archived (PDF) from the original on August 27, 2021. Retrieved May 17, 2020.
- 1 2 Atlantic Oceanographic and Meteorological Laboratory, Hurricane Research Division. "Frequently Asked Questions: When is hurricane season?". National Oceanic and Atmospheric Administration. Archived from the original on July 18, 2006. Retrieved November 3, 2008.
- 1 2 "Atlantic hurricane best track (HURDAT version 2)" (Database). United States National Hurricane Center. April 4, 2025.
 This article incorporates text from this source, which is in the public domain.
- Landsea, Chris (April 2022). "The revised Atlantic hurricane database (HURDAT2) - Chris Landsea – April 2022" (PDF). Hurricane Research Division – NOAA/AOML. Miami, Florida: Hurricane Research Division – via Atlantic Oceanographic and Meteorological Laboratory.
- 1 2 3 4 5 6 Hurricane Alberto Preliminary Report Page 1 (Report). National Hurricane Center. June 14, 1982. Retrieved July 11, 2026.
- 1 2 3 4 5 6 Hurricane Alberto Preliminary Report Page 3 (Report). National Hurricane Center. June 14, 1982. Retrieved July 11, 2026.
- 1 2 3 4 5 6 Hurricane Alberto Preliminary Report Page 1 (Report). National Hurricane Center. June 14, 1982. Retrieved July 11, 2026.
- 1 2 Subtropical Storm One Preliminary Report Page 1 (Report). National Hurricane Center. July 15, 1982. Retrieved July 11, 2026.
- 1 2 3 4 5 Subtropical Storm One Preliminary Report Page 7 (Report). National Hurricane Center. July 15, 1982. Retrieved November 21, 2008.
- 1 2 3 Subtropical Storm One Preliminary Report Page 2 (Report). National Hurricane Center. July 15, 1982. Retrieved July 11, 2026.
- ↑ Subtropical Storm One Preliminary Report Page 3 (Report). National Hurricane Center. July 15, 1982. Retrieved July 11, 2026.
- 1 2 3 4 Tropical Storm Beryl Preliminary Report Page 1 (Report). National Hurricane Center. 1982. Retrieved July 11, 2026.
- 1 2 3 4 5 6 Tropical Storm Beryl Preliminary Report Page 5 (Report). National Hurricane Center. 1982. Retrieved November 21, 2008.
- 1 2 Tropical Storm Beryl Preliminary Report Page 2 (Report). National Hurricane Center. 1982. Retrieved July 11, 2026.
- ↑ Tropical Storm Beryl Preliminary Report Page 4 (Report). National Hurricane Center. 1982. Retrieved July 11, 2026.
- 1 2 3 4 5 6 Tropical Storm Chris Preliminary Report Page 1 (Report). National Hurricane Center. September 27, 1982. Retrieved July 11, 2026.
- 1 2 3 4 5 6 Tropical Storm Chris Preliminary Report Page 2 (Report). National Hurricane Center. September 27, 1982. Retrieved November 21, 2008.
- 1 2 3 4 5 6 7 8 Hurricane Debby Preliminary Report Page 1 (Report). National Hurricane Center. 1982. Retrieved July 11, 2026.
- 1 2 3 4 5 6 7 8 9 10 11 Hurricane Debby Preliminary Report Page 5 (Report). National Hurricane Center. 1982. Retrieved November 21, 2008.
- ↑ Associated Press. Hurricane brushes past Bermuda. Retrieved on 2008-05-23.
- 1 2 3 4 5 Hurricane Debby Preliminary Report Page 2 (Report). National Hurricane Center. 1982. Retrieved July 11, 2026.
- ↑ Associated Press. Debby weakens; depression forms. Retrieved on 2008-05-23.
- 1 2 3 4 Tropical Storm Ernesto Preliminary Report Page 1 (Report). National Hurricane Center. October 13, 1982. Retrieved July 11, 2026.
- 1 2 3 4 Tropical Storm Ernesto Preliminary Report Page 4 (Report). National Hurricane Center. October 13, 1982. Retrieved November 21, 2008.



External links
- nhc.noaa.gov, National Hurricane Center homepage