Timeline of the 1983 Atlantic hurricane season
| Timeline of the 1983 Atlantic hurricane season | |||||
|---|---|---|---|---|---|
 Season summary map | |||||
| Season boundaries | |||||
| First system formed | July 23, 1983 | ||||
| Last system dissipated | September 30, 1983 | ||||
| Strongest system | |||||
| Name | Alicia | ||||
| Maximum winds | 115 mph (185 km/h) (1-minute sustained) | ||||
| Lowest pressure | 962 mbar (hPa; 28.41 inHg) | ||||
| Longest lasting system | |||||
| Name | Barry | ||||
| Duration | 6 days | ||||
| |||||
The 1983 Atlantic hurricane season was an event in the annual tropical cyclone season in the north Atlantic Ocean. It was the least active Atlantic hurricane season in 53 years.[1] The season officially began on June 1, 1983 and ended November 30, 1983. These dates, adopted by convention, historically describe the period in each year when most systems form.[2] The first named storm, Hurricane Alicia, formed on August 15. The last storm of the season, Tropical Storm Dean, dissipated on September 30.
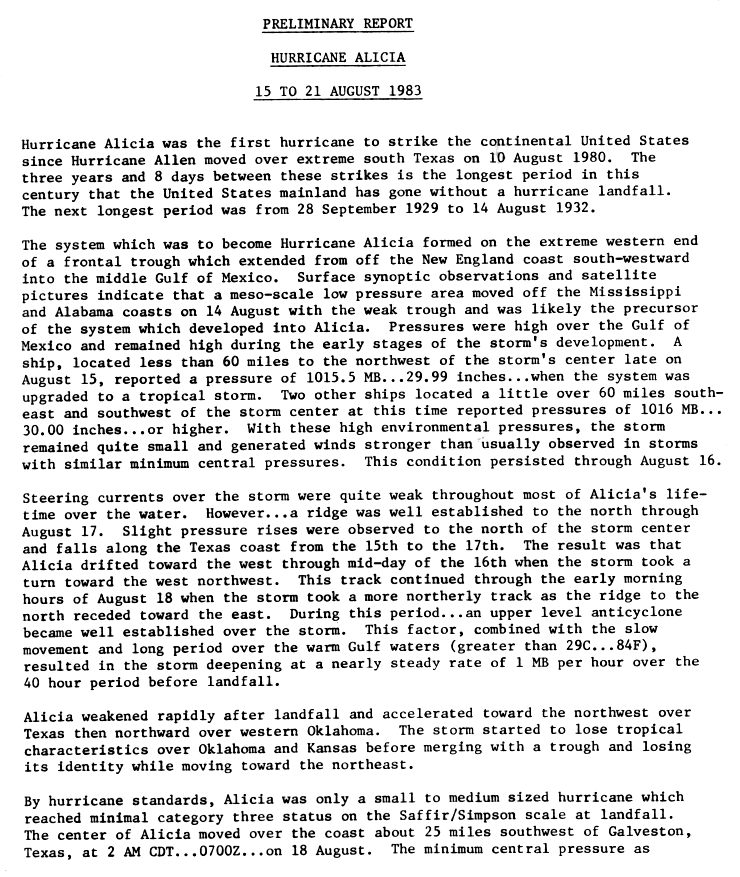
This season produced seven tropical depressions, of which four became named storms; three attained hurricane status, of which one became a major hurricane, a storm that ranks as a Category 3 or higher on the Saffir–Simpson scale.[3] In all, three systems made landfall this season: Hurricane Alicia (in Southeast Texas), Hurricane Barry (in Florida and near the Mexico–Texas border), and Tropical Storm Dean (on the Delmarva Peninsula.
This timeline documents tropical cyclone formations, strengthening, weakening, landfalls, extratropical transitions, and dissipations during the season. It includes information that was not released throughout the season, meaning that data from post-storm reviews by the National Hurricane Center, such as a storm that was not initially warned upon, has been included.
The time stamp for each event is stated using Coordinated Universal Time (UTC), the 24-hour clock where 00:00 = midnight UTC.[4] and the time zone where the center of the tropical cyclone is currently located. The time zones utilized (east to west) prior to 2020 were: Atlantic, Eastern, and Central.[5] In this timeline, the respective area time is included in parentheses. Additionally, figures for maximum sustained winds and position estimates are rounded to the nearest 5 units (miles, or kilometers), following National Hurricane Center practice. Direct wind observations are rounded to the nearest whole number. Atmospheric pressures are listed to the nearest millibar and nearest hundredth of an inch of mercury.
Timeline

June
- No tropical cyclones formed during the month of June.
June 1
- The Atlantic hurricane season officially begins.[6]
July
July 23
- 12:00 UTC (8:00 a.m. AST) at 10°00′N 38°00′W / 10.0°N 38.0°W – Tropical Depression One forms 955 miles (1,540 km) southwest of Brava, Cape Verde.[7]
July 24
- 06:00 UTC (2:00 a.m. AST) at 10°54′N 42°06′W / 10.9°N 42.1°W – Tropical Depression One attains its peak intensity, with maximum sustained winds of 35 mph (55 km/h) and an unknown minimum central pressure.[7]
July 27

- 12:00 UTC (8:00 a.m. AST) at 13°42′N 60°06′W / 13.7°N 60.1°W – Tropical Depression One passes over the island of Saint Lucia with maximum sustained winds of 35 mph (55 km/h).[7]
- 12:00 UTC (8:00 a.m. AST) at 12°00′N 27°00′W / 12.0°N 27.0°W – Tropical Depression Two forms 245 miles (395 km) southwest of Brava, Cape Verde.[7]
July 28
- 12:00 UTC (8:00 a.m. AST) at 12°06′N 32°06′W / 12.1°N 32.1°W – Tropical Depression Two attains its peak intensity, with maximum sustained winds of 35 mph (55 km/h) and an unknown minimum central pressure.[7]
- 18:00 UTC (2:00 p.m. EDT) at 15°00′N 67°30′W / 15.0°N 67.5°W – Tropical Depression One is last noted as a tropical cyclone over the open waters of the Caribbean, dissipating shortly thereafter.[7]
August
August 2
- 12:00 UTC (8:00 a.m. AST) at 18°48′N 63°06′W / 18.8°N 63.1°W – Tropical Depression Two is last noted as a tropical cyclone over the eastern Caribbean, dissipating shortly thereafter.[7]
August 15
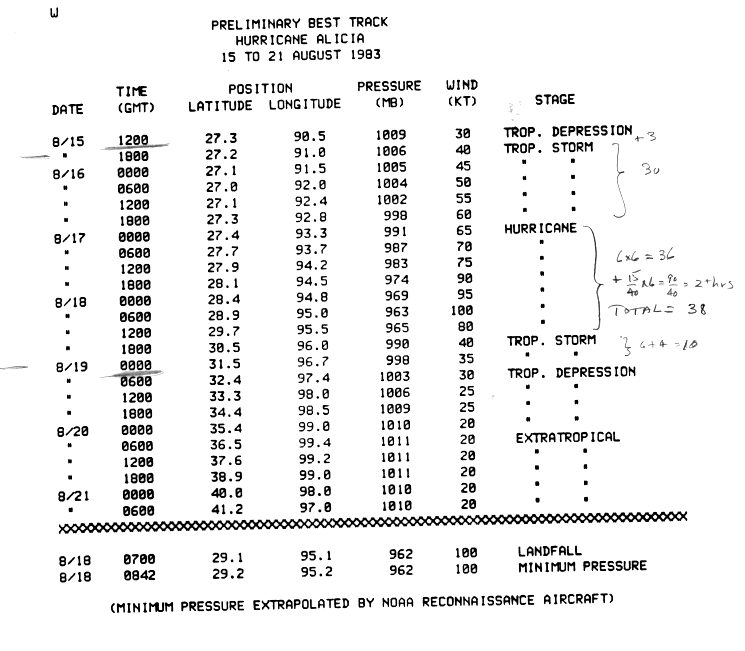
- 12:00 UTC (7:00 a.m. CDT) at 27°18′N 90°30′W / 27.3°N 90.5°W – Tropical Depression Three forms from a mesoscale convective system[8] about 185 mi (295 km) south of New Orleans, Louisiana.[9]
- 18:00 UTC (1:00 p.m. CDT) at 27°12′N 91°00′W / 27.2°N 91.0°W – Tropical Depression Three strengthens into Tropical Storm Alicia about 200 mi (325 km) south-southwest of New Orleans.[9]
August 17
- 00:00 UTC (7:00 p.m. CDT, August 16) at 27°24′N 93°18′W / 27.4°N 93.3°W – Tropical Storm Alicia strengthens into a Category 1 hurricane on the Saffir–Simpson scale about 265 mi (425 km) southwest of New Orleans, or about 160 mi (260 km) southeast of Galveston, Texas.[9]
- 18:00 UTC (1:00 p.m. CDT) at 28°06′N 94°30′W / 28.1°N 94.5°W – Hurricane Alicia strengthens to Category 2 intensity about 85 mi (140 km) south of Galveston.[9]
August 18

- 06:00 UTC (1:00 a.m. CDT) at 28°54′N 95°00′W / 28.9°N 95.0°W – Hurricane Alicia strengthens to Category 3 intensity about 30 mi (45 km) south-southwest of Galveston.[9]
- 07:00 UTC (2:00 a.m. CDT) at 29°06′N 95°06′W / 29.1°N 95.1°W – Hurricane Alicia attains its peak intensity while making landfall about 25 mi (35 km) southwest of Galveston, with maximum sustained winds of 115 mph (185 km/h) and a minimum central pressure of 962 mbar (28.41 inHg), making it the strongest storm of the season.[9]
- 12:00 UTC (7:00 a.m. CDT) at 29°42′N 95°30′W / 29.7°N 95.5°W – Hurricane Alicia rapidly weakens to Category 1 intensity over land about 50 mi (85 km) northwest of Galveston, or very near Houston.[9]
- 18:00 UTC (1:00 p.m. CDT) at 30°30′N 96°00′W / 30.5°N 96.0°W – Hurricane Alicia weakens into a tropical storm over land about 65 mi (100 km) northwest of Houston.[9]
August 19
- 06:00 UTC (1:00 a.m. CDT) at 32°24′N 97°24′W / 32.4°N 97.4°W – Tropical Storm Alicia weakens into a tropical depression over land about 220 mi (350 km) northwest of Houston.[9]
August 20
- 06:00 UTC (1:00 a.m. CDT) at 36°30′N 99°24′W / 36.5°N 99.4°W – Tropical Depression Alicia transitions into an extratropical cyclone while located over Nebraska, and later dissipates.[9]
August 23
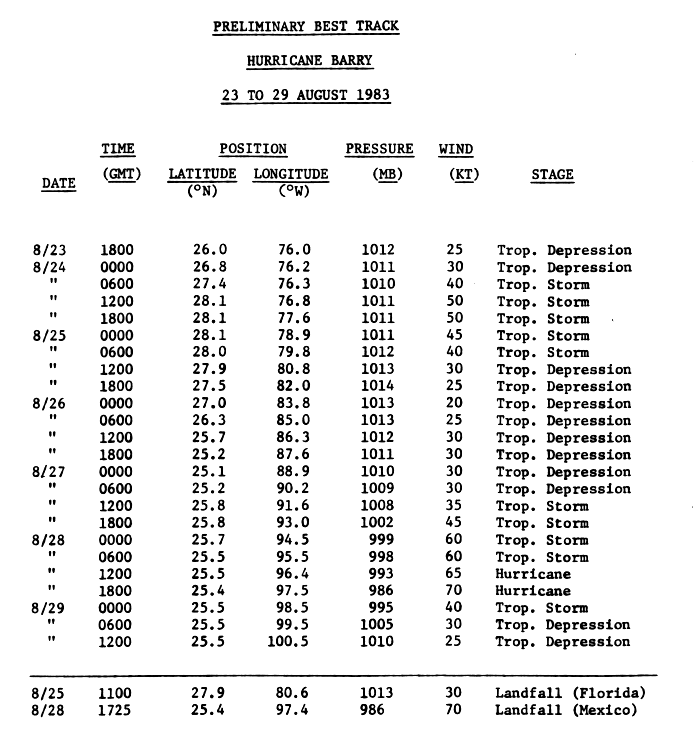
- 18:00 UTC (2:00 p.m. EDT) at 26°00′N 76°00′W / 26.0°N 76.0°W – Tropical Depression Four forms from a tropical wave[10] about 105 mi (165 km) northeast of Nassau, Bahamas.[11]
August 24
- 06:00 UTC (2:00 a.m. EDT) at 27°24′N 76°18′W / 27.4°N 76.3°W – Tropical Depression Four strengthens into Tropical Storm Barry about 175 mi (280 km) north-northeast of Nassau, or about 270 mi (435 km) east of Melbourne, Florida.[11]
August 25
- 11:00 UTC (7:00 a.m. EDT) at 27°54′N 80°36′W / 27.9°N 80.6°W – Tropical Storm Barry weakens into a tropical depression as it makes its first landfall near Melbourne with maximum sustained winds of 35 mph (55 km/h) and a central pressure of 1013 mbar (29.91 inHg), and later emerges over the Gulf of Mexico.[10][11]
August 27
- 12:00 UTC (7:00 a.m. CDT) at 25°48′N 91°36′W / 25.8°N 91.6°W – Tropical Depression Barry restrengthens into a tropical storm about 370 mi (595 km) east of Brownsville, Texas.[10][11]
August 28

- 12:00 UTC (7:00 a.m. CDT) at 25°30′N 96°24′W / 25.5°N 96.4°W – Tropical Storm Barry strengthens into a Category 1 hurricane about 75 mi (120 km) east-southeast of Brownsville.[10][11]
- 17:25 UTC (12:25 p.m. CDT) at 25°24′N 97°24′W / 25.4°N 97.4°W – Hurricane Barry attains its peak intensity as it makes its second and final landfall in the Mexican state of Tamaulipas about 35 mi (55 km) south of Brownsville, with maximum sustained winds of 80 mph (130 km/h) and a minimum central pressure of 986 mbar (29.12 inHg).[10][11]
August 29
- 00:00 UTC (7:00 p.m. CDT, August 28) at 25°30′N 98°30′W / 25.5°N 98.5°W – Hurricane Barry weakens into a tropical storm over land about 70 mi (110 km) west-southwest of Brownsville.[10][11]
- 06:00 UTC (1:00 a.m. CDT) at 25°30′N 99°30′W / 25.5°N 99.5°W – Tropical Storm Barry weakens into a tropical depression over land about 125 mi (205 km) west-southwest of Brownsville.[10][11]
- 12:00 UTC (7:00 a.m. CDT) at 25°30′N 100°30′W / 25.5°N 100.5°W – Tropical Depression Barry is last noted as a tropical cyclone over land about 190 mi (305 km) west of Brownsville, dissipating over the mountainous terrain of northern Mexico shortly thereafter.[10][11]
September
September 10
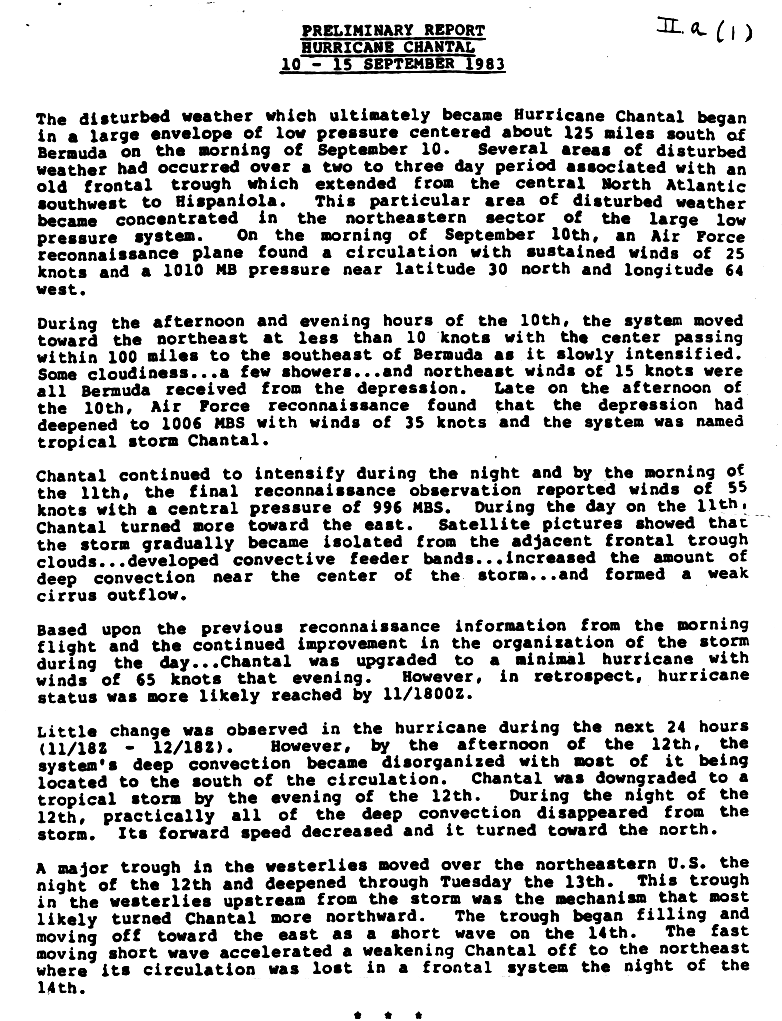
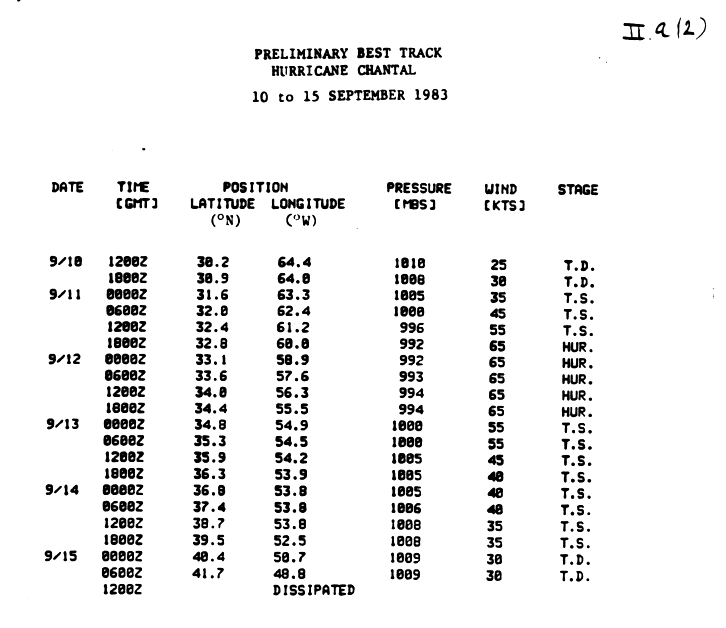
- 12:00 UTC (8:00 a.m. AST) at 30°12′N 64°24′W / 30.2°N 64.4°W – Tropical Depression Five forms from an area of disturbed weather within a large low-pressure area about 150 mi (240 km) south of Bermuda.[12][13]
September 11
- 00:00 UTC (8:00 p.m. AST, September 10) at 31°36′N 63°18′W / 31.6°N 63.3°W – Tropical Depression Five strengthens into Tropical Storm Chantal about 100 mi (155 km) east-southeast of Bermuda.[12][13]
- 18:00 UTC (2:00 p.m. AST) at 32°48′N 60°00′W / 32.8°N 60.0°W – Tropical Storm Chantal strengthens into a Category 1 hurricane about 275 mi (445 km) east of Bermuda. It simultaneously attains its peak intensity, with maximum sustained winds of 75 mph (120 km/h) and a minimum central pressure of 992 mbar (29.29 inHg).[nb 1][12][13]
September 13

- 00:00 UTC (8:00 p.m. AST, September 12) at 34°48′N 54°54′W / 34.8°N 54.9°W – Hurricane Chantal weakens into a tropical storm about 595 mi (955 km) east-northeast of Bermuda, or about 825 mi (1,325 km) south of Cape Race, Newfoundland.[12][13][14]
September 15
- 00:00 UTC (8:00 p.m. AST, September 14) at 40°24′N 50°42′W / 40.4°N 50.7°W – Tropical Storm Chantal weakens into a tropical depression about 450 mi (720 km) south-southeast of Cape Race.[13][14]
- 06:00 UTC (2:00 a.m. AST) at 41°42′N 48°48′W / 41.7°N 48.8°W – Tropical Depression Chantal is last noted as a tropical cyclone about 405 mi (650 km) southeast of Cape Race, dissipating shortly thereafter when it is absorbed by a weather front.[12][13][14]
September 19
- exact time and location unknown – Tropical Depression Six forms near the Lesser Antilles.[15]
September 21
- exact time and location unknown – Tropical Depression Six degenerates into a tropical wave over the Dominican Republic.[16]
September 26
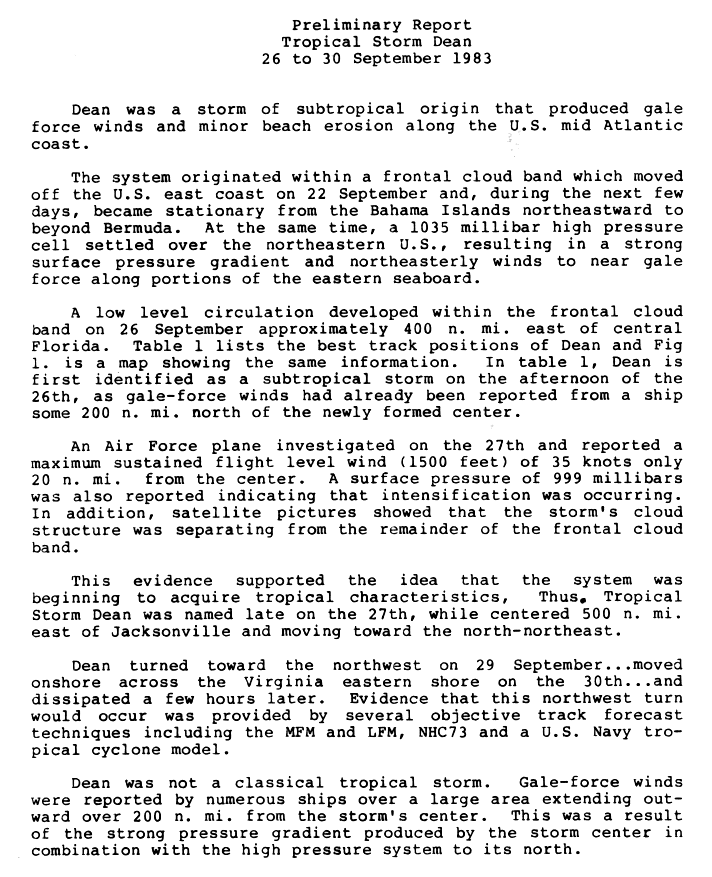
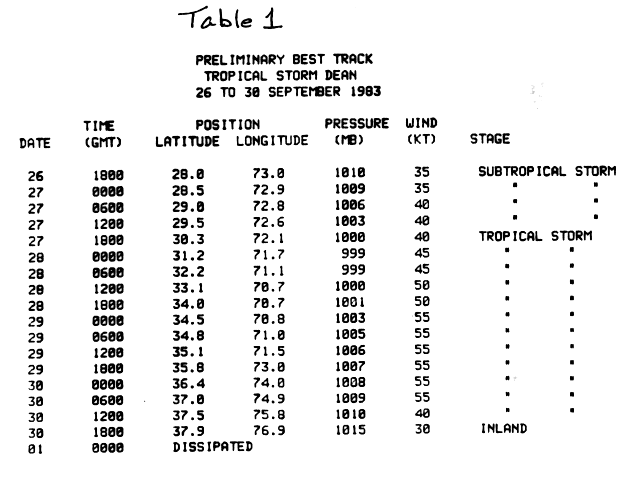
- 18:00 UTC (2:00 p.m. EDT) at 28°00′N 73°00′W / 28.0°N 73.0°W – Subtropical Storm One forms from a weather front about 460 mi (740 km) east of the Atlantic coast of central Florida, or about 575 mi (925 km) west-southwest of Bermuda.[17][18]
September 27
- 18:00 UTC (2:00 p.m. EDT) at 30°18′N 72°06′W / 30.3°N 72.1°W – Subtropical Storm One transitions into a tropical cyclone about 455 mi (730 km) west-southwest of Bermuda, and is given the name Dean.[17][18]
September 28
- 00:00 UTC (8:00 p.m. EDT, September 27) at 31°12′N 71°42′W / 31.2°N 71.7°W – Tropical Storm Dean attains a minimum central pressure of 999 mbar (29.50 inHg) about 415 mi (665 km) west of Bermuda.[17][18]
September 29

- 00:00 UTC (8:00 p.m. EDT, September 28) at 34°30′N 70°48′W / 34.5°N 70.8°W – Tropical Storm Dean attains peak maximum sustained winds of 65 mph (100 km/h) about 380 mi (610 km) west-northwest of Bermuda.[17][18]
September 30
- 12:00 UTC (8:00 a.m. EDT) at 37°30′N 75°48′W / 37.5°N 75.8°W – Tropical Storm Dean makes landfall on the Delmarva Peninsula with maximum sustained winds of 45 mph (75 km/h) and a central pressure of 1010 mbar (29.83 inHg).[17][18]
- 18:00 UTC (2:00 p.m. EDT) at 37°54′N 76°54′W / 37.9°N 76.9°W – Tropical Storm Dean weakens into a tropical depression over land, dissipating shortly thereafter.[17][18]
October
- No tropical cyclones formed during the month of October.
November
- No tropical cyclones formed during the month of November.
November 30
- The Atlantic hurricane season officially ends.[6]
See also
Notes
References
- ↑ John Arnold (November 30, 1983). "Hurricane season ends weakly". The Philadelphia Inquirer. Retrieved December 16, 2007.
- ↑ Dorst, Neal (June 1, 2018). "Hurricane Season Information". Frequently Asked Questions About Hurricanes. Miami, Florida: NOAA Atlantic Oceanographic and Meteorological Laboratory. Retrieved June 29, 2020.
- ↑ "Atlantic hurricane best track ("HURDAT")". NHC Hurricane Research Division. February 17, 2006. Archived from the original on September 16, 2008. Retrieved November 3, 2008.
- ↑ "What is UTC or GMT Time?". Miami, Florida: National Hurricane Center. Retrieved February 2, 2026.
- ↑ "Update on National Hurricane Center Products and Services for 2020" (PDF). Miami, Florida: National Hurricane Center. April 20, 2020. Archived (PDF) from the original on August 27, 2021. Retrieved May 17, 2020.
- 1 2 Atlantic Oceanographic and Meteorological Laboratory, Hurricane Research Division. "Frequently Asked Questions: When is hurricane season?". National Oceanic and Atmospheric Administration. Archived from the original on 2006-07-18. Retrieved 2008-11-03.
- 1 2 3 4 5 6 7 8 "Atlantic hurricane best track (HURDAT version 2)" (Database). United States National Hurricane Center. April 4, 2025.
 This article incorporates text from this source, which is in the public domain.
- Landsea, Chris (April 2022). "The revised Atlantic hurricane database (HURDAT2) - Chris Landsea – April 2022" (PDF). Hurricane Research Division – NOAA/AOML. Miami, Florida: Hurricane Research Division – via Atlantic Oceanographic and Meteorological Laboratory.
- ↑ Hurricane Alicia Preliminary Report Page 1 (Report). National Hurricane Center. 1983. Retrieved July 10, 2026.
- 1 2 3 4 5 6 7 8 9 10 Hurricane Alicia Preliminary Report Page 6 (Report). National Hurricane Center. 1983. Retrieved November 20, 2008.
- 1 2 3 4 5 6 7 8 Hurricane Barry Preliminary Report Page 1 (Report). National Hurricane Center. 1983. Retrieved July 11, 2026.
- 1 2 3 4 5 6 7 8 9 Hurricane Barry Preliminary Report Page 3 (Report). National Hurricane Center. 1983. Retrieved November 20, 2008.
- 1 2 3 4 5 Hurricane Chantal Preliminary Report Page 1 (Report). National Hurricane Center. 1983. Retrieved July 11, 2026.
- 1 2 3 4 5 6 Hurricane Chantal Preliminary Report Page 2 (Report). National Hurricane Center. 1983. Retrieved November 20, 2008.
- 1 2 3 Hurricane Chantal Preliminary Report Page 3 (Report). National Hurricane Center. 1983. Retrieved July 11, 2026.
- ↑ Miami Herald (September 19, 1983). "New Tropical Depression Forms, Aims Toward Windwards". The Miami Herald. Retrieved February 2, 2007.
- ↑ Miami Herald (September 21, 1983). "Caribbean Storm Downgraded". The Miami Herald. Retrieved February 2, 2007.
- 1 2 3 4 5 6 <Tropical Storm Dean Preliminary Report Page 1 (Report). National Hurricane Center. 1983. Retrieved July 11, 2026.
- 1 2 3 4 5 6 Tropical Storm Dean Preliminary Report Page 3 (Report). National Hurricane Center. 1983. Retrieved November 20, 2008.


External links
- nhc.noaa.gov, National Hurricane Center homepage