1995 Manitoba general election
 | |||||||||||||||||||||||||||||||||||||||||||||||||
April 25, 1995
| |||||||||||||||||||||||||||||||||||||||||||||||||
57 seats of the Legislative Assembly of Manitoba 29 seats were needed for a majority | |||||||||||||||||||||||||||||||||||||||||||||||||
|---|---|---|---|---|---|---|---|---|---|---|---|---|---|---|---|---|---|---|---|---|---|---|---|---|---|---|---|---|---|---|---|---|---|---|---|---|---|---|---|---|---|---|---|---|---|---|---|---|---|
| Turnout | 69.20% | ||||||||||||||||||||||||||||||||||||||||||||||||
| |||||||||||||||||||||||||||||||||||||||||||||||||
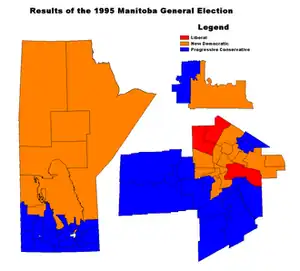 Map of Election Results | |||||||||||||||||||||||||||||||||||||||||||||||||
| |||||||||||||||||||||||||||||||||||||||||||||||||


The 1995 Manitoba general election was held on April 25, 1995 to elect Members of the Legislative Assembly of the Province of Manitoba, Canada. Progressive Conservative Party, which won 31 seats out of 57, clinched the elections. The New Democratic Party formed the official opposition with 23 seats; the Liberal Party won 3.
Opinion polls
| Polling firm | Last day of survey |
Source | PC | NDP | MLP | Other | ME | Sample |
|---|---|---|---|---|---|---|---|---|
| Election 1995 | April 25, 1995 | 42.87 | 32.81 | 23.72 | 0.6 | |||
| Angus Reid | April 16, 1995 | [1] | 40 | 33 | 27 | N/a | N/a | 914 |
| Angus Reid | March 17, 1995 | [2] | 37 | 21 | 35 | N/a | N/a | 1,200 |
| February 1995 | [3] | 32 | 25 | 35 | N/a | N/a | 800 | |
| January 1995 | [3] | 39 | 31 | 31 | N/a | N/a | 600 | |
| COMPAS | December 1994 | [4] | 38 | 19 | 37 | N/a | N/a | N/a |
| COMPAS | June 1994 | [5] | 28 | 23 | 44 | 4 | N/a | N/a |
| Election 1990 | September 11, 1990 | 41.99 | 28.80 | 28.15 | 1.06 |
Results
| Party | Party Leader | # of candidates |
Seats | Popular Vote | |||||
|---|---|---|---|---|---|---|---|---|---|
| Before1 | Elected | % Change | # | % | % Change | ||||
| Progressive Conservative | Gary Filmon | 57 | 29 | 31 | +6.9% | 216,246 | 42.87 | +0.88 | |
| New Democratic | Gary Doer | 57 | 20 | 23 | +15.0% | 165,489 | 32.81 | +4.01 | |
| Liberal | Paul Edwards | 57 | 6 | 3 | -50.0% | 119 677 | 23.72 | -4.42 | |
| Libertarian | Dennis Rice | 6 | - | - | - | 634 | 0.13 | 0.00 | |
| Independents | 11 | - | - | - | 2,396 | 0.47 | 0.00 | ||
| First Peoples Party | Jerry Fontaine | [3] | - | [908] | |||||
| Independent Native Voice | Nelson Contois | [3] | - | [518] | |||||
| Vacant | 2 | n.a. | |||||||
| Total | 188 | 57 | 57 | - | 504 442 | 100% | |||
1 "Before" refers to standings in the Legislature at dissolution, and not to the results of the previous election. These numbers therefore reflect changes in party standings as a result of by-elections and members crossing the floor.
Vote and seat summaries
Ternary plots – shift of electoral support (1990–1995)
 1990
 1995
Synopsis of results
| Electoral division |
Winning party | Votes | ||||||||||||||
|---|---|---|---|---|---|---|---|---|---|---|---|---|---|---|---|---|
| 1990 | 1st place |
Votes | Share | Margin # |
Margin % |
2nd place |
PC | NDP | Lib | Ind | Ltn | Total | ||||
| Arthur-Virden | PC | PC | 5,015 | 64.36% | 3,496 | 44.87% | NDP | 5,015 | 1,519 | 1,258 | – | – | 7,792 | |||
| Assiniboia | PC | PC | 4,315 | 52.96% | 2,130 | 26.14% | Lib | 4,315 | 1,648 | 2,185 | – | – | 8,148 | |||
| Brandon East | NDP | NDP | 4,395 | 53.78% | 1,787 | 21.87% | PC | 2,608 | 4,395 | 1,169 | – | – | 8,172 | |||
| Brandon West | PC | PC | 4,471 | 49.40% | 1,681 | 18.57% | NDP | 4,471 | 2,790 | 1,789 | – | – | 9,050 | |||
| Broadway | NDP | NDP | 3,126 | 47.87% | 1,513 | 23.17% | Lib | 1,529 | 3,126 | 1,613 | 262 | – | 6,530 | |||
| Burrows | NDP | NDP | 4,748 | 67.46% | 3,482 | 49.47% | PC | 1,266 | 4,748 | 1,024 | – | – | 7,038 | |||
| Charleswood | PC | PC | 5,737 | 58.00% | 2,779 | 28.09% | Lib | 5,737 | 1,197 | 2,958 | – | – | 9,892 | |||
| Concordia | NDP | NDP | 4,827 | 63.58% | 2,982 | 39.28% | PC | 1,845 | 4,827 | 816 | – | 104 | 7,592 | |||
| Crescentwood | Liberal | NDP | 3,733 | 36.04% | 278 | 2.68% | PC | 3,455 | 3,733 | 3,170 | – | – | 10,358 | |||
| Dauphin | NDP | NDP | 4,673 | 48.37% | 793 | 8.21% | PC | 3,880 | 4,673 | 996 | 111 | – | 9,660 | |||
| Elmwood | NDP | NDP | 4,264 | 53.02% | 1,712 | 21.29% | PC | 2,552 | 4,264 | 1,227 | – | – | 8,043 | |||
| Emerson | PC | PC | 4,965 | 62.90% | 2,982 | 37.78% | Lib | 4,965 | 945 | 1,983 | – | – | 7,893 | |||
| Flin Flon | NDP | NDP | 2,732 | 52.05% | 715 | 13.62% | PC | 2,017 | 2,732 | 500 | – | – | 5,249 | |||
| Fort Garry | PC | PC | 5,959 | 48.29% | 1,525 | 12.36% | Lib | 5,959 | 1,857 | 4,434 | – | 91 | 12,341 | |||
| Gimli | PC | PC | 5,591 | 50.65% | 1,845 | 16.71% | NDP | 5,591 | 3,746 | 1,702 | – | – | 11,039 | |||
| Gladstone | PC | PC | 4,629 | 62.30% | 3,175 | 42.73% | Lib | 4,629 | 1,347 | 1,454 | – | – | 7,430 | |||
| Inkster | Liberal | Liberal | 4,394 | 50.80% | 1,745 | 20.17% | NDP | 1,384 | 2,649 | 4,394 | 223 | – | 8,650 | |||
| Interlake | NDP | NDP | 3,791 | 51.17% | 1,229 | 16.59% | PC | 2,562 | 3,791 | 766 | 289 | – | 7,408 | |||
| Kildonan | NDP | NDP | 5,812 | 52.00% | 2,488 | 22.26% | PC | 3,324 | 5,812 | 2,041 | – | – | 11,177 | |||
| Kirkfield Park | PC | PC | 5,949 | 60.15% | 3,333 | 33.70% | Lib | 5,949 | 1,325 | 2,616 | – | – | 9,890 | |||
| La Vérendrye | PC | PC | 4,581 | 48.02% | 2,074 | 21.74% | Lib | 4,581 | 2,452 | 2,507 | – | – | 9,540 | |||
| Lac du Bonnet | PC | PC | 5,986 | 57.07% | 2,523 | 24.06% | NDP | 5,986 | 3,463 | 1,039 | – | – | 10,488 | |||
| Lakeside | PC | PC | 4,376 | 57.12% | 2,574 | 33.60% | NDP | 4,376 | 1,802 | 1,373 | – | 110 | 7,661 | |||
| Minnedosa | PC | PC | 4,498 | 54.58% | 2,457 | 29.81% | NDP | 4,498 | 2,041 | 1,702 | – | – | 8,241 | |||
| Morris | PC | PC | 5,662 | 60.99% | 3,333 | 35.90% | Lib | 5,662 | 1,158 | 2,329 | – | 135 | 9,284 | |||
| Niakwa | PC | PC | 5,908 | 50.86% | 2,160 | 18.59% | Lib | 5,908 | 1,961 | 3,748 | – | – | 11,617 | |||
| Osborne | Liberal | NDP | 3,969 | 40.86% | 991 | 10.20% | Lib | 2,766 | 3,969 | 2,978 | – | – | 9,713 | |||
| Pembina | PC | PC | 5,092 | 62.28% | 2,460 | 30.09% | Lib | 5,092 | 452 | 2,632 | – | – | 8,176 | |||
| Point Douglas | NDP | NDP | 3,095 | 63.03% | 1,963 | 39.98% | Lib | 578 | 3,095 | 1,132 | 105 | – | 4,910 | |||
| Portage la Prairie | PC | PC | 3,977 | 51.36% | 1,860 | 24.02% | Lib | 3,977 | 1,519 | 2,117 | 130 | – | 7,743 | |||
| Radisson | NDP | NDP | 4,891 | 52.04% | 2,490 | 26.49% | Lib | 2,107 | 4,891 | 2,401 | – | – | 9,399 | |||
| Riel | PC | PC | 3,561 | 38.15% | 441 | 4.72% | Lib | 3,561 | 2,653 | 3,120 | – | – | 9,334 | |||
| River East | PC | PC | 4,938 | 47.20% | 1,762 | 16.84% | NDP | 4,938 | 3,176 | 2,347 | – | – | 10,461 | |||
| River Heights | Liberal | PC | 5,429 | 47.98% | 994 | 8.79% | Lib | 5,429 | 1,352 | 4,435 | – | 98 | 11,314 | |||
| Roblin-Russell | PC | PC | 4,672 | 54.33% | 1,984 | 23.07% | NDP | 4,672 | 2,688 | 1,239 | – | – | 8,599 | |||
| Rossmere | PC | PC | 4,318 | 45.97% | 117 | 1.25% | NDP | 4,318 | 4,201 | 875 | – | – | 9,394 | |||
| Rupertsland | NDP | NDP | 2,249 | 50.80% | 1,231 | 27.81% | Lib | 619 | 2,249 | 1,018 | 541 | – | 4,427 | |||
| Seine River | PC | PC | 6,462 | 49.70% | 2,086 | 16.04% | Lib | 6,462 | 2,163 | 4,376 | – | – | 13,001 | |||
| Selkirk | NDP | NDP | 4,758 | 43.77% | 919 | 8.45% | PC | 3,839 | 4,758 | 2,273 | – | – | 10,870 | |||
| Springfield | PC | PC | 6,355 | 52.15% | 2,080 | 17.07% | NDP | 6,355 | 4,275 | 1,461 | – | 96 | 12,187 | |||
| St. Boniface | Liberal | Liberal | 4,021 | 45.48% | 1,192 | 13.48% | NDP | 1,686 | 2,829 | 4,021 | 306 | – | 8,842 | |||
| St. James | Liberal | NDP | 3,019 | 35.63% | 166 | 1.96% | Lib | 2,601 | 3,019 | 2,853 | – | – | 8,473 | |||
| St. Johns | NDP | NDP | 4,513 | 58.53% | 2,903 | 37.65% | Lib | 1,587 | 4,513 | 1,610 | – | – | 7,710 | |||
| St. Norbert | PC | PC | 4,699 | 43.90% | 527 | 4.92% | Lib | 4,699 | 1,833 | 4,172 | – | – | 10,704 | |||
| St. Vital | PC | PC | 4,021 | 41.47% | 664 | 6.85% | NDP | 4,021 | 3,357 | 2,319 | – | – | 9,697 | |||
| Ste. Rose | PC | PC | 3,762 | 51.99% | 1,421 | 19.64% | NDP | 3,762 | 2,341 | 1,133 | – | – | 7,236 | |||
| Steinbach | PC | PC | 5,975 | 74.99% | 4,769 | 59.85% | Lib | 5,975 | 787 | 1,206 | – | – | 7,968 | |||
| Sturgeon Creek | PC | PC | 4,747 | 49.11% | 1,696 | 17.55% | Lib | 4,747 | 1,688 | 3,051 | 180 | – | 9,666 | |||
| Swan River | NDP | NDP | 4,021 | 46.31% | 36 | 0.41% | PC | 3,985 | 4,021 | 559 | 118 | – | 8,683 | |||
| The Maples | Liberal | Liberal | 4,254 | 48.08% | 1,620 | 18.31% | NDP | 1,960 | 2,634 | 4,254 | – | – | 8,848 | |||
| The Pas | NDP | NDP | 3,616 | 51.70% | 1,115 | 15.94% | PC | 2,501 | 3,616 | 877 | – | – | 6,994 | |||
| Thompson | NDP | NDP | 3,619 | 61.71% | 2,299 | 39.20% | PC | 1,320 | 3,619 | 926 | – | – | 5,865 | |||
| Transcona | NDP | NDP | 5,163 | 58.13% | 2,791 | 31.42% | PC | 2,372 | 5,163 | 1,216 | 131 | – | 8,882 | |||
| Turtle Mountain | PC | PC | 4,781 | 60.90% | 3,046 | 38.80% | Lib | 4,781 | 1,334 | 1,735 | – | – | 7,850 | |||
| Tuxedo | PC | PC | 8,691 | 66.23% | 5,716 | 43.56% | Lib | 8,691 | 1,457 | 2,975 | – | – | 13,123 | |||
| Wellington | NDP | NDP | 3,788 | 54.04% | 1,792 | 25.56% | Lib | 1,226 | 3,788 | 1,996 | – | – | 7,010 | |||
| Wolseley | NDP | NDP | 4,048 | 56.38% | 2,471 | 34.42% | Lib | 1,555 | 4,048 | 1,577 | – | – | 7,180 | |||
- = open seat
- = winning candidate was in previous Legislature
- = incumbent had switched allegiance
- = previously incumbent in another riding
- = incumbency arose from a byelection gain
- = not incumbent; was previously elected to the Legislature
- = other incumbents renominated
- = candidate for First Peoples Party or Independent Native Voice - parties not recognized by Elections Manitoba
- = multiple candidates
Turnout, winning shares and swings
| Riding and winning party | Turnout | Vote share[a 1] | Swing[a 2] | ||||||||||||
|---|---|---|---|---|---|---|---|---|---|---|---|---|---|---|---|
| % | Change (pp) | % | Change (pp) | To | Change (pp) | ||||||||||
| Arthur-Virden | PC | Hold | 64.94 | -0.07 | 64.36 | 5.11 | PC | 7.42 | |||||||
| Assiniboia | PC | Hold | 70.77 | 0.94 | 52.96 | 3.11 | PC | 4.93 | |||||||
| Brandon East | NDP | Hold | 62.88 | -4.64 | 53.78 | 0.27 | NDP | 2.25 | |||||||
| Brandon West | PC | Hold | 67.75 | -1.94 | 49.40 | -6.07 | NDP | -4.54 | |||||||
| Broadway | NDP | Hold | 60.70 | -0.89 | 47.87 | 9.16 | NDP | 10.75 | |||||||
| Burrows | NDP | Hold | 63.90 | -2.96 | 67.46 | 13.12 | NDP | 12.57 | |||||||
| Charleswood | PC | Hold | 74.68 | 0.03 | 58.00 | 0.44 | PC | 0.73 | |||||||
| Concordia | NDP | Hold | 66.82 | -1.56 | 63.58 | 5.41 | NDP | 2.83 | |||||||
| Crescentwood | NDP | Gain | 73.34 | 1.58 | 36.04 | 14.31 | PC | -7.89 | |||||||
| Dauphin | NDP | Hold | 77.82 | 1.14 | 48.37 | -0.46 | PC | -2.90 | |||||||
| Elmwood | NDP | Hold | 68.85 | -2.79 | 53.02 | 6.04 | NDP | 4.43 | |||||||
| Emerson | PC | Hold | 66.21 | 4.62 | 62.90 | 1.06 | Lib | -0.16 | |||||||
| Flin Flon | NDP | Hold | 57.08 | -5.43 | 52.05 | -17.03 | PC | -18.36 | |||||||
| Fort Garry | PC | Hold | 71.16 | -1.80 | 48.29 | 1.22 | PC | 1.05 | |||||||
| Gimli | PC | Hold | 75.07 | 3.08 | 50.65 | -1.78 | NDP | -4.20 | |||||||
| Gladstone | PC | Hold | 61.47 | 1.05 | 62.30 | 3.09 | PC | 4.03 | |||||||
| Inkster | Lib | Hold | 67.03 | 2.75 | 50.80 | 4.93 | Lib | 3.94 | |||||||
| Interlake | NDP | Hold | 64.09 | 1.21 | 51.17 | 10.64 | NDP | 5.48 | |||||||
| Kildonan | NDP | Hold | 74.29 | -0.86 | 52.00 | 16.31 | NDP | 10.17 | |||||||
| Kirkfield Park | PC | Hold | 75.16 | -2.26 | 60.15 | 3.73 | PC | 5.29 | |||||||
| La Vérendrye | PC | Hold | 69.71 | 3.03 | 48.02 | 3.53 | PC | 4.83 | |||||||
| Lac du Bonnet | PC | Hold | 75.99 | 2.93 | 57.07 | 3.38 | PC | 1.52 | |||||||
| Lakeside | PC | Hold | 64.75 | 1.44 | 57.12 | 7.43 | PC | 7.69 | |||||||
| Minnedosa | PC | Hold | 64.62 | 0.19 | 54.58 | 1.58 | PC | 4.06 | |||||||
| Morris | PC | Hold | 71.05 | 5.27 | 60.99 | -2.65 | Lib | -1.77 | |||||||
| Niakwa | PC | Hold | 77.32 | -0.18 | 50.86 | 4.36 | PC | 6.25 | |||||||
| Osborne | NDP | Gain | 70.17 | -1.47 | 40.86 | 11.67 | NDP | -10.61 | |||||||
| Pembina | PC | Hold | 61.78 | 3.45 | 62.28 | -16.45 | Lib | -18.36 | |||||||
| Point Douglas | NDP | Hold | 58.23 | -2.70 | 63.03 | 8.32 | NDP | 7.90 | |||||||
| Portage la Prairie | PC | Hold | 65.84 | 0.02 | 51.36 | -2.49 | Lib | -0.25 | |||||||
| Radisson | NDP | Hold | 66.61 | -1.26 | 52.04 | 5.28 | NDP | 6.95 | |||||||
| Riel | PC | Hold | 75.65 | 4.64 | 38.15 | -5.17 | Lib | -2.72 | |||||||
| River East | PC | Hold | 77.28 | 3.35 | 47.20 | -5.53 | NDP | -4.72 | |||||||
| River Heights | PC | Gain | 81.66 | 0.20 | 47.98 | 7.61 | PC | -8.19 | |||||||
| Roblin-Russell | PC | Hold | 69.67 | 4.70 | 54.33 | 2.02 | NDP | -1.26 | |||||||
| Rossmere | PC | Hold | 77.08 | 2.62 | 45.97 | 3.64 | NDP | -5.73 | |||||||
| Rupertsland | NDP | Hold | 44.83 | -1.77 | 50.80 | -26.57 | PC | -12.09 | |||||||
| Seine River | PC | Hold | 74.53 | 1.64 | 49.70 | 8.98 | PC | 7.81 | |||||||
| Selkirk | NDP | Hold | 77.25 | 2.81 | 43.77 | 7.19 | NDP | 2.91 | |||||||
| Springfield | PC | Hold | 77.41 | 4.01 | 52.15 | 3.03 | PC | 0.08 | |||||||
| St. Boniface | Lib | Hold | 71.30 | 1.22 | 45.48 | -9.93 | NDP | -9.46 | |||||||
| St. James | NDP | Gain | 71.64 | -1.73 | 35.63 | 5.52 | PC | -0.23 | |||||||
| St. Johns | NDP | Hold | 67.48 | -1.70 | 58.53 | 5.67 | NDP | 6.92 | |||||||
| St. Norbert | PC | Hold | 71.87 | -1.66 | 43.90 | -1.58 | PC | 1.87 | |||||||
| St. Vital | PC | Hold | 74.70 | 1.70 | 41.47 | 5.17 | PC | 8.14 | |||||||
| Ste. Rose | PC | Hold | 62.96 | 1.36 | 51.99 | 0.41 | PC | 5.69 | |||||||
| Steinbach | PC | Hold | 58.53 | 0.83 | 74.99 | -0.65 | PC | 0.10 | |||||||
| Sturgeon Creek | PC | Hold | 70.71 | -3.52 | 49.11 | 2.60 | PC | 4.95 | |||||||
| Swan River | NDP | Hold | 74.93 | 1.64 | 46.31 | 0.62 | PC | -1.17 | |||||||
| The Maples | Lib | Hold | 66.38 | -0.62 | 48.08 | 8.25 | Lib | 9.38 | |||||||
| The Pas | NDP | Hold | 58.24 | -7.53 | 51.70 | 7.34 | NDP | 7.04 | |||||||
| Thompson | NDP | Hold | 54.87 | -8.18 | 61.71 | 1.78 | NDP | 4.57 | |||||||
| Transcona | NDP | Hold | 68.47 | -1.76 | 58.13 | 8.64 | NDP | 11.96 | |||||||
| Turtle Mountain | PC | Hold | 66.79 | 0.09 | 60.90 | 2.22 | PC | 3.11 | |||||||
| Tuxedo | PC | Hold | 73.10 | -2.39 | 66.23 | 1.09 | PC | 2.80 | |||||||
| Wellington | NDP | Hold | 66.97 | -1.27 | 54.04 | 8.03 | NDP | 5.12 | |||||||
| Wolseley | NDP | Hold | 67.72 | -2.50 | 56.38 | 12.48 | NDP | 12.20 | |||||||
Changes in party shares
| Riding | Liberal | NDP | PC | |||||||||
|---|---|---|---|---|---|---|---|---|---|---|---|---|
| % | Change (pp) | % | Change (pp) | % | Change (pp) | |||||||
| Arthur-Virden | 16.14 | -9.74 | 19.49 | 4.63 | 64.36 | 5.11 | ||||||
| Assiniboia | 26.82 | -6.75 | 20.23 | 3.65 | 52.96 | 3.11 | ||||||
| Brandon East | 14.30 | 3.97 | 53.78 | 0.27 | 31.91 | -4.24 | ||||||
| Brandon West | 19.77 | 3.04 | 30.83 | 3.02 | 49.40 | -6.07 | ||||||
| Broadway | 24.70 | -12.35 | 47.87 | 9.16 | 23.42 | -0.82 | ||||||
| Burrows | 14.55 | -12.01 | 67.46 | 13.12 | 17.99 | -1.11 | ||||||
| Charleswood | 29.90 | -1.03 | 12.10 | 0.59 | 58.00 | 0.44 | ||||||
| Concordia | 10.75 | -2.68 | 63.58 | 5.41 | 24.30 | -0.26 | ||||||
| Crescentwood | 30.60 | -15.05 | 36.04 | 14.31 | 33.36 | 0.74 | ||||||
| Dauphin | 10.31 | -6.04 | 48.37 | -0.46 | 40.17 | 5.35 | ||||||
| Elmwood | 15.26 | -3.22 | 53.02 | 6.04 | 31.73 | -2.82 | ||||||
| Emerson | 25.12 | 1.38 | 11.97 | -2.43 | 62.90 | 1.06 | ||||||
| Flin Flon | 9.53 | -2.67 | 52.05 | -17.03 | 38.43 | 19.70 | ||||||
| Fort Garry | 35.93 | -0.88 | 15.05 | 1.22 | 48.29 | 1.22 | ||||||
| Gimli | 15.42 | -4.84 | 33.93 | 6.62 | 50.65 | -1.78 | ||||||
| Gladstone | 19.57 | -4.98 | 18.13 | 7.45 | 62.30 | 3.09 | ||||||
| Inkster | 50.80 | 4.93 | 30.62 | -2.96 | 16.00 | -2.03 | ||||||
| Interlake | 10.34 | -14.21 | 51.17 | 10.64 | 34.58 | -0.33 | ||||||
| Kildonan | 18.26 | -7.07 | 52.00 | 16.31 | 29.74 | -4.03 | ||||||
| Kirkfield Park | 26.45 | -6.84 | 13.40 | 3.35 | 60.15 | 3.73 | ||||||
| La Vérendrye | 26.28 | -6.13 | 25.70 | 2.60 | 48.02 | 3.53 | ||||||
| Lac du Bonnet | 9.91 | -3.71 | 33.02 | 0.33 | 57.07 | 3.38 | ||||||
| Lakeside | 17.92 | -7.95 | 23.52 | 6.85 | 57.12 | 7.43 | ||||||
| Minnedosa | 20.65 | -6.54 | 24.77 | 4.96 | 54.58 | 1.58 | ||||||
| Morris | 25.09 | 0.88 | 12.47 | 3.90 | 60.99 | -2.65 | ||||||
| Niakwa | 32.26 | -8.14 | 16.88 | 3.79 | 50.86 | 4.36 | ||||||
| Osborne | 30.66 | -9.55 | 40.86 | 11.67 | 28.48 | -0.70 | ||||||
| Pembina | 32.19 | 20.26 | 5.53 | -3.81 | 62.28 | -16.45 | ||||||
| Point Douglas | 23.05 | -7.47 | 63.03 | 8.32 | 11.77 | 0.45 | ||||||
| Portage la Prairie | 27.34 | -1.99 | 19.62 | 5.86 | 51.36 | -2.49 | ||||||
| Radisson | 25.55 | 3.35 | 52.04 | 5.28 | 22.42 | -8.63 | ||||||
| Riel | 33.43 | 0.28 | 28.42 | 4.88 | 38.15 | -5.17 | ||||||
| River East | 22.44 | 1.61 | 30.36 | 3.92 | 47.20 | -5.53 | ||||||
| River Heights | 39.20 | -8.77 | 11.95 | 1.51 | 47.98 | 7.61 | ||||||
| Roblin-Russell | 14.41 | -6.57 | 31.26 | 4.54 | 54.33 | 2.02 | ||||||
| Rossmere | 9.31 | -16.95 | 44.72 | 15.09 | 45.97 | 3.64 | ||||||
| Rupertsland | 23.00 | 16.74 | 50.80 | -26.57 | 13.98 | -2.40 | ||||||
| Seine River | 33.66 | -6.64 | 16.64 | 0.29 | 49.70 | 8.98 | ||||||
| Selkirk | 20.91 | -8.56 | 43.77 | 7.19 | 35.32 | 1.36 | ||||||
| Springfield | 11.99 | -6.70 | 35.08 | 2.88 | 52.15 | 3.03 | ||||||
| St. Boniface | 45.48 | -9.93 | 32.00 | 8.99 | 19.07 | -2.53 | ||||||
| St. James | 33.67 | -1.42 | 35.63 | 5.52 | 30.70 | -0.96 | ||||||
| St. Johns | 20.88 | -8.17 | 58.53 | 5.67 | 20.58 | 2.50 | ||||||
| St. Norbert | 38.98 | -5.33 | 17.12 | 6.91 | 43.90 | -1.58 | ||||||
| St. Vital | 23.91 | -11.11 | 34.62 | 9.05 | 41.47 | 5.17 | ||||||
| Ste. Rose | 15.66 | -10.97 | 32.35 | 10.56 | 51.99 | 0.41 | ||||||
| Steinbach | 15.14 | -0.85 | 9.88 | 3.28 | 74.99 | -0.65 | ||||||
| Sturgeon Creek | 31.56 | -7.30 | 17.46 | 2.83 | 49.11 | 2.60 | ||||||
| Swan River | 6.44 | -4.93 | 46.31 | 0.62 | 45.89 | 2.95 | ||||||
| The Maples | 48.08 | 8.25 | 29.77 | 2.27 | 22.15 | -10.51 | ||||||
| The Pas | 12.54 | -0.61 | 51.70 | 7.34 | 35.76 | -6.73 | ||||||
| Thompson | 15.79 | 5.58 | 61.71 | 1.78 | 22.51 | -7.36 | ||||||
| Transcona | 13.69 | -15.28 | 58.13 | 8.64 | 26.71 | 7.06 | ||||||
| Turtle Mountain | 22.10 | -3.99 | 16.99 | 3.93 | 60.90 | 2.22 | ||||||
| Tuxedo | 22.67 | -4.52 | 11.10 | 3.43 | 66.23 | 1.09 | ||||||
| Wellington | 28.47 | -2.21 | 54.04 | 8.03 | 17.49 | -2.77 | ||||||
| Wolseley | 21.96 | -11.92 | 56.38 | 12.48 | 21.66 | 1.45 | ||||||
Post-election changes
| Electoral district | Candidates | Incumbent | ||||||||
|---|---|---|---|---|---|---|---|---|---|---|
| PC | NDP | Liberal | Other | |||||||
| Portage la Prairie September 30, 1997 |
David Faurschou 2,422 |
Connie Gretsinger 1,340 |
Dave Quinn 1,657 |
Warren Goodwin (Ind) 1,025 Ralph Jackson (Ind) 49 |
Brian Pallister | |||||
| Charleswood April 28, 1998 |
Myrna Driedger 2,767 |
Barrie Farrow 961 |
Alan McKenzie 1,524 |
Jim Ernst | ||||||
Gary Kowalski left the Liberal caucus on June 5, 1997, and Kevin Lamoureux followed suit on October 1, 1997. Both rejoined the party caucus in 1998.
Neil Gaudry died on February 18, 1999.
See also
References
- ↑ Roberts, David (April 20, 1995). "Liberal support plunges in run to Manitoba election: Ruling Tories cruise comfortably with six days to go". The Globe and Mail. p. A4.
- ↑ Roberts, David (April 3, 1995). "Doer practices for last kick at the political can: Victory has eluded NDP leader so far, but the game in Manitoba runs to April 25". The Globe and Mail. p. A4.
- 1 2 Roberts, David (March 20, 1995). "Manitoba election call imminent: While Filmon's Tories have gained momentum in past weeks, polls indicate a close, three-way race". The Globe and Mail. p. A4.
- ↑ Geddes, John (December 29, 1994). "Liberals set for election wins: Riding the crest of the Chretien government's popularity, provincial Grits gain voter support in what may be a busy election year, poll shows". Financial Post. p. 1.
- ↑ Toulin, Alan (June 29, 1994). "Provincial Liberals lead poll: But COMPAS survey points to Tory gain in Alberta". Financial Post. p. 5.
- 1 2 3 "Thirty-Fifth General Election held September 11, 1990 - Summary of Results" (PDF). Elections Manitoba. Retrieved September 25, 2025.
- 1 2 3 "Thirty-Sixth General Election held April 25, 1995 - Summary of Results" (PDF). Elections Manitoba. Retrieved September 24, 2025.