Transcona (electoral district)
 Manitoba electoral district | |||
|---|---|---|---|
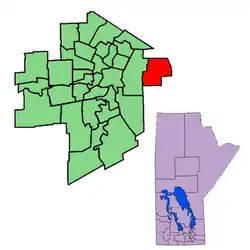
 Location in Winnipeg | |||
| Provincial electoral district | |||
| Legislature | Legislative Assembly of Manitoba | ||
| MLA |
New Democratic | ||
| District created | 1968 | ||
| First contested | 1969 | ||
| Last contested | 2023 | ||
| Demographics | |||
| Population (2016) | 22,920 | ||
| Electors (2019) | 16,701 | ||
| Area (km²) | 28 | ||
| Pop. density (per km²) | 818.6 | ||
| Census subdivision | Winnipeg | ||
Transcona is a provincial electoral district of Manitoba, Canada. The riding was created by redistribution in 1968, and has formally existed since the 1969 provincial election. It was created out of Radisson and a small slice of Springfield.
The riding is named after and contains Transcona, a neighbourhood in the easternmost tip of the city of Winnipeg. It is bordered to the southwest by Southdale, the west by St. Boniface and Radisson, and in all other directions by the rural riding of Springfield-Ritchot.[1]
The population in 1996 was 19,648. The average family income in 1999 was $50,089, with an unemployment rate of 6.70%. About seven percent of the riding's population are Ukrainian Canadians.
The riding is primarily working-class, and includes the Canadian National Railway rail yards. Fifteen percent of the riding's industry is in the manufacturing sector, with a further 14% in retail trade.
The former New Democratic Party (NDP) party leader Russell Paulley represented the riding for the first eight years of its legal existence. Candidates from the NDP have won Transcona in all but two of the provincial elections (1988 and 2016, both of which coincided with large provincewide declines in NDP support) in which it has participated since 1969.
Members of the Legislative Assembly
| Parliament | Years | Member | Party | |
|---|---|---|---|---|
| Riding created from Radisson, and Springfield | ||||
| 29th | 1969–1973 | Russell Paulley | New Democratic | |
| 30th | 1973–1977 | |||
| 31st | 1977–1981 | Wilson Parasiuk | ||
| 32nd | 1981–1986 | |||
| 33rd | 1986–1988 | |||
| 34th | 1988–1990 | Richard Kozak | Liberal | |
| 35th | 1990–1995 | Daryl Reid | New Democratic | |
| 36th | 1995–1999 | |||
| 37th | 1999–2003 | |||
| 38th | 2003–2007 | |||
| 39th | 2007–2011 | |||
| 40th | 2011–2016 | |||
| 41st | 2016–2019 | Blair Yakimoski | Progressive Conservative | |
| 42nd | 2019–2023 | Nello Altomare | New Democratic | |
| 43rd | 2023–2025 | |||
| 2025–present | Shannon Corbett | |||
Electoral results
| Manitoba provincial by-election, March 18, 2025 Death of Nello Altomare | ||||||||
|---|---|---|---|---|---|---|---|---|
| Party | Candidate | Votes | % | ±% | Expenditures | |||
| New Democratic | Shannon Corbett | 3,616 | 64.46 | +5.95 | ||||
| Progressive Conservative | Shawn Nason | 1,569 | 27.97 | -7.48 | ||||
| Liberal | Brad Boudreau | 217 | 3.87 | -2.18 | ||||
| Independent | Susan Auch | 208 | 3.71 | – | ||||
| Total valid votes | 5,610 | 99.63 | – | |||||
| Total rejected and declined ballots | 21 | 0.37 | -0.14 | |||||
| Turnout | 5,631 | 31.44 | -19.96 | |||||
| Eligible voters | 17,962 | |||||||
| New Democratic hold | Swing | +6.72 | ||||||
| 2023 Manitoba general election | ||||||||
|---|---|---|---|---|---|---|---|---|
| Party | Candidate | Votes | % | ±% | Expenditures | |||
| New Democratic | Nello Altomare | 5,235 | 58.50 | +12.09 | $23,820.41 | |||
| Progressive Conservative | Titi Tijani | 3,172 | 35.45 | -9.68 | $33,125.35 | |||
| Liberal | Arthur Bloomfield | 541 | 6.05 | -2.41 | $0.00 | |||
| Total valid votes/expense limit | 8,948 | 99.49 | – | $68,202.00 | ||||
| Total rejected and declined ballots | 46 | 0.51 | –0.37 | |||||
| Turnout | 8,994 | 51.40 | -1.05 | |||||
| Eligible voters | 17,498 | |||||||
| New Democratic hold | Swing | +10.88 | ||||||
Source(s) | ||||||||
| 2019 Manitoba general election | ||||||||
|---|---|---|---|---|---|---|---|---|
| Party | Candidate | Votes | % | ±% | Expenditures | |||
| New Democratic | Nello Altomare | 4,030 | 46.42 | +18.2 | $15,870.22 | |||
| Progressive Conservative | Blair Yakimoski | 3,918 | 45.13 | -4.7 | $28,026.59 | |||
| Liberal | Dylan Bekkering | 734 | 8.45 | -10.1 | $0.00 | |||
| Total valid votes | 8,682 | 99.12 | ||||||
| Total rejected ballots | 47 | 0.88 | ||||||
| Turnout | 8,759 | 52.45 | ||||||
| Eligible voters | 16,701 | |||||||
| New Democratic gain from Progressive Conservative | Swing | +11.4 | ||||||
| 2016 provincial election redistributed results[9] | |||
|---|---|---|---|
| Party | % | ||
| Progressive Conservative | 49.8 | ||
| New Democratic | 28.2 | ||
| Liberal | 18.6 | ||
| Others | 3.5 | ||
| 2016 Manitoba general election | ||||||||
|---|---|---|---|---|---|---|---|---|
| Party | Candidate | Votes | % | ±% | Expenditures | |||
| Progressive Conservative | Blair Yakimoski | 3,948 | 49.38 | +14.76 | $33,019.24 | |||
| New Democratic | Barb Burkowski | 2,281 | 28.53 | -29.70 | $42,927.60 | |||
| Liberal | Chad Panting | 1,465 | 18.32 | +11.17 | $15,578.42 | |||
| Manitoba | Ajit Kumar | 233 | 2.91 | $5,194.78 | ||||
| Communist | Darrell Rankin | 68 | 0.85 | $33.60 | ||||
| Total valid votes/expense limit | 7,995 | 97.97 | $ | |||||
| Total rejected ballots | 166 | 2.03 | +1.50 | |||||
| Turnout | 8,161 | 55.98 | +4.74 | |||||
| Eligible voters | 14,578 | |||||||
| Source: Elections Manitoba[10][11] | ||||||||
| Progressive Conservative gain from New Democratic | Swing | +22,23 | ||||||
| 2011 Manitoba general election | ||||||||
|---|---|---|---|---|---|---|---|---|
| Party | Candidate | Votes | % | ±% | Expenditures | |||
| New Democratic | Daryl Reid | 4,488 | 58.23 | −10.50 | $18,912.01 | |||
| Progressive Conservative | Craig Stapon | 2,668 | 34.62 | +12.46 | $18,099.59 | |||
| Liberal | Faye McLeod-Jashyn | 551 | 7.15 | −1.96 | $4,711.87 | |||
| Total valid votes | 7,707 | 99.47 | ||||||
| Rejected and declined ballots | 41 | 0.53 | +0.02 | |||||
| Turnout | 7,748 | 51.24 | +2.44 | |||||
| Electors on the lists | 15,120 | |||||||
| New Democratic hold | Swing | -11.48 | ||||||
| 2007 Manitoba general election | ||||||||
|---|---|---|---|---|---|---|---|---|
| Party | Candidate | Votes | % | ±% | Expenditures | |||
| New Democratic | Daryl Reid | 4,560 | 68.74 | −0.74 | $19,318.05 | |||
| Progressive Conservative | Bryan McLeod | 1,470 | 22.16 | +7.76 | $2,732.56 | |||
| Liberal | Gerald Basarab | 604 | 9.10 | −7.01 | $848.80 | |||
| Total valid votes | 6,634 | 99.49 | ||||||
| Rejected and declined ballots | 34 | 0.51 | -0.02 | |||||
| Turnout | 6,668 | 48.80 | +0.26 | |||||
| Electors on the lists | 13,664 | |||||||
| New Democratic hold | Swing | -4.25 | ||||||
| 2003 Manitoba general election | ||||||||
|---|---|---|---|---|---|---|---|---|
| Party | Candidate | Votes | % | ±% | Expenditures | |||
| New Democratic | Daryl Reid | 4,414 | 69.48 | +5.60 | $16,221.57 | |||
| Liberal | Betty Ann Watts | 1,024 | 16.12 | +8.01 | $12,517.46 | |||
| Progressive Conservative | Nansy Marsiglia | 915 | 14.40 | −12.98 | $10.69 | |||
| Total valid votes | 6,353 | 99.47 | ||||||
| Rejected and declined ballots | 34 | 0.53 | +0.12 | |||||
| Turnout | 6,387 | 48.54 | −19.44 | |||||
| Electors on the lists | 13,157 | |||||||
| New Democratic hold | Swing | -1.21 | ||||||
| 1999 Manitoba general election | ||||||||
|---|---|---|---|---|---|---|---|---|
| Party | Candidate | Votes | % | ±% | Expenditures | |||
| New Democratic | Daryl Reid | 5,620 | 63.88 | +5.75 | $13,949.00 | |||
| Progressive Conservative | Dan Turner | 2,409 | 27.38 | +0.68 | $19,315.42 | |||
| Liberal | Vibart Stewart | 713 | 8.10 | -5.59 | $2,987.81 | |||
| Communist | Paul Sidon | 56 | 0.64 | $0.00 | ||||
| Total valid votes | 8,798 | 99.59 | ||||||
| Rejected and declined ballots | 36 | 0.41 | +0.17 | |||||
| Turnout | 8,834 | 67.98 | ||||||
| Electors on the lists | 12,995 | |||||||
| New Democratic hold | Swing | +2.54 | ||||||
| 1995 Manitoba general election | ||||||||
|---|---|---|---|---|---|---|---|---|
| Party | Candidate | Votes | % | ±% | Expenditures | |||
| New Democratic | Daryl Reid | 5,163 | 58.13 | +8.64 | $16,554.00 | |||
| Progressive Conservative | Richard Bueckert | 2,372 | 26.71 | +7.06 | $7,384.15 | |||
| Liberal | Ingrid Pokrant | 1,216 | 13.69 | −15.28 | $9,521.05 | |||
| Independent | Jack D. Lang | 131 | 1.47 | $121.01 | ||||
| Total valid votes | 8,882 | 99.76 | ||||||
| Rejected and declined ballots | 21 | 0.24 | +0.01 | |||||
| Turnout | 8,903 | 68.47 | −1.76 | |||||
| Electors on the lists | 13,003 | |||||||
| New Democratic hold | Swing | +0.79 | ||||||
| 1990 Manitoba general election | ||||||||
|---|---|---|---|---|---|---|---|---|
| Party | Candidate | Votes | % | ±% | ||||
| New Democratic | Daryl Reid | 4,363 | 49.48 | +15.83 | ||||
| Liberal | Richard Kozak | 2,554 | 28.97 | -12.16 | ||||
| Progressive Conservative | Ray Hargreaves | 1,732 | 19.64 | -4.30 | ||||
| Progressive | Thomas Bunn | 168 | 1.91 | |||||
| Total valid votes | 8,817 | 99.77 | ||||||
| Rejected and declined ballots | 20 | 0.23 | +0.18 | |||||
| Turnout | 8,837 | 70.22 | −7.49 | |||||
| Electors on the lists | 12,584 | |||||||
| New Democratic gain from Liberal | Swing | +14.00 | ||||||
| 1988 Manitoba general election | ||||||||
|---|---|---|---|---|---|---|---|---|
| Party | Candidate | Votes | % | ±% | ||||
| Liberal | Richard Kozak | 3,900 | 41.13 | +25.74 | ||||
| New Democratic | Wilson Parasiuk | 3,191 | 33.65 | -25.74 | ||||
| Progressive Conservative | Bill Omiucke | 2,270 | 23.94 | -1.27 | ||||
| Independent | Ray Hargreaves | 121 | 1.28 | |||||
| Total valid votes | 9,482 | 99.96 | ||||||
| Rejected and declined ballots | 4 | 0.04 | -0.15 | |||||
| Turnout | 9,486 | 77.72 | +12.16 | |||||
| Electors on the lists | 12,206 | |||||||
| Liberal gain from New Democratic | Swing | +25.74 | ||||||
| 1986 Manitoba general election | ||||||||
|---|---|---|---|---|---|---|---|---|
| Party | Candidate | Votes | % | ±% | ||||
| New Democratic | Wilson Parasiuk | 4,631 | 59.39 | -12.17 | ||||
| Progressive Conservative | Earl Swayzie | 1,966 | 25.21 | -1.79 | ||||
| Liberal | Bob Lee | 1,200 | 15.39 | |||||
| Total valid votes | 7,797 | 99.81 | ||||||
| Rejected and declined ballots | 15 | 0.19 | -0.02 | |||||
| Turnout | 7,812 | 65.56 | -6.43 | |||||
| Electors on the lists | 11,916 | |||||||
| New Democratic hold | Swing | -5.19 | ||||||
| 1981 Manitoba general election | ||||||||
|---|---|---|---|---|---|---|---|---|
| Party | Candidate | Votes | % | ±% | ||||
| New Democratic | Wilson Parasiuk | 6,013 | 71.57 | +17.57 | ||||
| Progressive Conservative | Jo Lopuck | 2,269 | 27.01 | -12.60 | ||||
| Progressive | Albert Smaczylo | 120 | 1.43 | |||||
| Total valid votes | 8,402 | 99.79 | ||||||
| Rejected and declined ballots | 18 | 0.21 | +0.05 | |||||
| Turnout | 8,420 | 71.98 | -5.96 | |||||
| Electors on the lists | 11,697 | |||||||
| New Democratic hold | Swing | +15.09 | ||||||
| 1977 Manitoba general election | ||||||||
|---|---|---|---|---|---|---|---|---|
| Party | Candidate | Votes | % | ±% | ||||
| New Democratic | Wilson Parasiuk | 6,474 | 53.99 | -6.19 | ||||
| Progressive Conservative | Tony Leonard | 4,749 | 39.61 | -0.12 | ||||
| Liberal | Douglas Dennison | 767 | 6.40 | |||||
| Total valid votes | 11,990 | 99.83 | ||||||
| Rejected and declined ballots | 20 | 0.17 | -0.40 | |||||
| Turnout | 12,010 | 77.95 | -3.38 | |||||
| Electors on the lists | 15,408 | |||||||
| New Democratic hold | Swing | -2.99 | ||||||
| 1973 Manitoba general election | ||||||||
|---|---|---|---|---|---|---|---|---|
| Party | Candidate | Votes | % | ±% | ||||
| New Democratic | Russell Paulley | 6,275 | 60.19 | -4.31 | ||||
| Progressive Conservative | Phil Rizzuto | 4,151 | 39.81 | +25.11 | ||||
| Total valid votes | 10,426 | 99.44 | ||||||
| Rejected and declined ballots | 59 | 0.56 | +0.21 | |||||
| Turnout | 10,485 | 81.32 | +15.08 | |||||
| Electors on the lists | 12,893 | |||||||
| New Democratic hold | Swing | -14.71 | ||||||
| 1969 Manitoba general election | ||||||||
|---|---|---|---|---|---|---|---|---|
| Party | Candidate | Votes | % | |||||
| New Democratic | Russell Paulley | 4,614 | 64.50 | |||||
| Liberal | Thelma Call | 1,488 | 20.80 | |||||
| Progressive Conservative | Kenn Gunn-Walberg | 1,052 | 14.71 | |||||
| Total valid votes | 7,154 | 99.65 | ||||||
| Rejected and declined ballots | 25 | 0.35 | ||||||
| Turnout | 7,179 | 66.25 | ||||||
| Electors on the lists | 10,837 | |||||||
Previous boundaries
See also
References
- ↑ Elections Manitoba electoral maps of Winnipeg and Manitoba
- ↑ "Summary of Votes Received" (PDF). Elections Manitoba. Retrieved May 4, 2024.
- ↑ "CANDIDATE ELECTION RETURNS GENERAL ELECTION 2023". Elections Manitoba. Retrieved March 18, 2025.
- ↑ "2023 GENERAL ELECTION CANDIDATE AND REGISTERED PARTY ELECTION EXPENSE LIMITS - FINAL EXPENSE LIMIT" (PDF). Elections Manitoba. Retrieved May 4, 2024.
- ↑ "Summary of Votes Received: 42nd General Election" (PDF). Elections Manitoba. Retrieved March 18, 2025.
- ↑ "CANDIDATE ELECTION RETURNS GENERAL ELECTION 2019". Elections Manitoba. Retrieved January 19, 2025.
- ↑ "RESULTS SUMMARY: 42ND GENERAL ELECTION" (PDF). Elections Manitoba. Retrieved January 19, 2025.
- ↑ Marcoux, Jacques (August 27, 2019). "New Manitoba election boundaries give upper hand to Progressive Conservatives, CBC News analysis finds". CBC. Retrieved September 15, 2019.
- ↑ Marcoux, Jacques (August 27, 2019). "New Manitoba election boundaries give upper hand to Progressive Conservatives, CBC News analysis finds". CBC. Retrieved September 15, 2019.
- ↑ "Statement of Votes" (PDF). Elections Manitoba. 2016. Retrieved March 18, 2025.
- ↑ "Election Returns: 41st General Election". Elections Manitoba. 2016. Retrieved September 10, 2018.
- ↑ "Transcona — Official Results — 2007 Provincial Election". Archived from the original on March 21, 2012. Retrieved November 24, 2010. - 2007 results
- ↑ "Transcona — Official Results — 2003 Provincial Election". Retrieved December 10, 2009.
{{cite web}}: CS1 maint: deprecated archival service (link) - 2003 results - ↑ "Summary of Results - 1999 General Election". Archived from the original on March 6, 2012. Retrieved August 14, 2010. - 1999 results