2026 Sunderland City Council election
 | |||||||||||||||||||||||||||||||||||||||||||||||||||||||||||||||||||||||||||||
7 May 2026
| |||||||||||||||||||||||||||||||||||||||||||||||||||||||||||||||||||||||||||||
All 75 seats to Sunderland City Council 38 seats needed for a majority | |||||||||||||||||||||||||||||||||||||||||||||||||||||||||||||||||||||||||||||
|---|---|---|---|---|---|---|---|---|---|---|---|---|---|---|---|---|---|---|---|---|---|---|---|---|---|---|---|---|---|---|---|---|---|---|---|---|---|---|---|---|---|---|---|---|---|---|---|---|---|---|---|---|---|---|---|---|---|---|---|---|---|---|---|---|---|---|---|---|---|---|---|---|---|---|---|---|---|
| Turnout | 40.5%[1] | ||||||||||||||||||||||||||||||||||||||||||||||||||||||||||||||||||||||||||||
| |||||||||||||||||||||||||||||||||||||||||||||||||||||||||||||||||||||||||||||
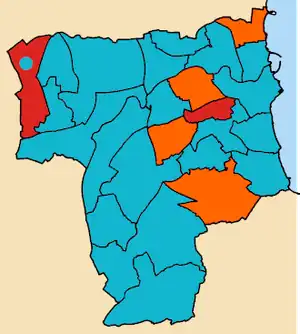 | |||||||||||||||||||||||||||||||||||||||||||||||||||||||||||||||||||||||||||||

The 2026 Sunderland City Council election was held on 7 May 2026, alongside the other local elections across the United Kingdom which were held on the same day. All 75 members of Sunderland City Council were elected.[2] Boundary changes were made for these elections.[3]
Reform UK took control of the council, wiping out the Conservatives and reducing Labour, who had ran the city for fifty years, to just 5 councillors. Liberal Democrats held 12 seats, including making gains from Labour and the Conservatives, returning as the majority opposition party.[4]
Background
Before the election Labour was the largest party with Liberal Democrats forming the official opposition after overtaking the Conservatives at the 2023 and 2024 elections.[5] Since the last election two councillors defected from both Labour and the Conservatives to sit as Independents.[6][7]
In November 2025 Reform UK won their first seat on the council with a 35% swing in the Hetton ward by-election, however their councillor resigned from the party after just 76 days and sat as an independent.[8] There was speculation that Reform would take control of the council like it had the year before in County Durham.[9]
In March 2026, Fiona Miller a Labour councillor first elected in 2011 defected to the Green Party. Her husband Graeme Miller was council leader for Labour between 2018 and 2024 before he was removed by Labour's National Executive Committee.[10]
Election results
 Council composition after the 2024 election
 Council composition after the 2026 election
| 2026 Sunderland City Council election[11] | ||||||||||
|---|---|---|---|---|---|---|---|---|---|---|
| Party | Candidates | Seats | Gains | Losses | Net gain/loss | Seats % | Votes % | Votes | +/− | |
| Reform | 75 | 58 |  58 |
77.33 | 41.31 | 101,732 | 26.87 | |||
| Liberal Democrats | 75 | 12 |  |
16.00 | 12.98 | 31,969 |  2.32 | |||
| Labour | 75 | 5 | 48 |
6.67 | 26.28 | 64,718 | 19.21 | |||
| Conservative | 75 | 0 | 10 |
0.00 | 10.66 | 26,243 | 7.55 | |||
| Green | 64 | 0 | |
0.00 | 8.59 | 21,150 | 3.42 | |||
| Independent | 3 | 0 | |
0.00 | 0.19 | 464 | 1.31 | |||
Ward results
An asterisk next to a candidate's name denotes an incumbent councillor. Each ward elected three candidates, the candidate with the highest number of votes received a four year term until 2030, the candidate with the second highest number of votes received a two year term until May 2028, and the candidate with the third highest number of votes received a one year term until May 2027.[12]
Barnes and Thornhill
| Party | Candidate | Votes | % | ±% | |
|---|---|---|---|---|---|
| Labour Co-op | Ehthesham Haque* | 1,502 | 37.0 | ||
| Labour Co-op | Caroline Comer | 1,483 | 36.5 | ||
| Labour Co-op | Fiona Katharine Tobin* | 1,401 | 34.5 | ||
| Reform | Victor John Skinner | 1,128 | 27.8 | ||
| Reform | Robert Snowdon | 1,114 | 27.4 | ||
| Reform | Lynn Wynn | 1,064 | 26.2 | ||
| Conservative | Benjamin William Davies-Scott | 751 | 18.5 | ||
| Conservative | Nathan Williamson | 724 | 17.8 | ||
| Conservative | Kevin Leonard | 703 | 17.3 | ||
| Liberal Democrats | Syed Mahfuz Ahmed | 502 | 12.4 | ||
| Green | Jake Taylor | 402 | 9.9 | ||
| Green | Alyson Kordbarlag | 398 | 9.8 | ||
| Green | Mark Dominic Tyers | 338 | 8.3 | ||
| Liberal Democrats | Tim Ellis-Dale | 328 | 8.1 | ||
| Liberal Democrats | Kai Lamont Crawford | 308 | 7.6 | ||
| Majority | |||||
| Turnout | |||||
| Labour win (new seat) | |||||
| Labour win (new seat) | |||||
| Labour win (new seat) | |||||
Deptford and Hendon
| Party | Candidate | Votes | % | ±% | |
|---|---|---|---|---|---|
| Reform | David Barker | 1,070 | 34.4 | ||
| Reform | Marie Mccarthy | 990 | 31.8 | ||
| Reform | Lynda Andrews | 964 | 31.0 | ||
| Labour Co-op | Stephen Lewis Elms* | 865 | 27.8 | ||
| Labour Co-op | Syeda Shilpe Chowdhury | 823 | 26.5 | ||
| Labour Co-op | Myles Alfie Mordey | 814 | 26.2 | ||
| Green | Liam Murphy | 399 | 12.8 | ||
| Green | Helmut Izaks | 395 | 12.7 | ||
| Green | Raymond John Moore | 384 | 12.4 | ||
| Liberal Democrats | Colin Wilson | 352 | 11.7 | ||
| Liberal Democrats | Ciaran Morrissey | 304 | 10.1 | ||
| Liberal Democrats | Francesca Hodson | 292 | 9.7 | ||
| Conservative | James Ebere | 144 | 4.8 | ||
| Conservative | Steven Porter | 111 | 3.7 | ||
| Conservative | Gideon Oseremen Eriaye | 108 | 3.6 | ||
| Majority | |||||
| Turnout | |||||
| Reform win (new seat) | |||||
| Reform win (new seat) | |||||
| Reform win (new seat) | |||||
Doxford Park
| Party | Candidate | Votes | % | ±% | |
|---|---|---|---|---|---|
| Liberal Democrats | Heather Fagan* | 1,860 | 50.2 | 0.9 | |
| Liberal Democrats | Paul Gibson* | 1,649 | 44.5 | 4.8 | |
| Liberal Democrats | Michael Peacock | 1,574 | 42.5 | 6.8 | |
| Reform | Lynda Alexander | 1,349 | 36.4 | 24.1 | |
| Reform | Alan Emery | 1,262 | 34.1 | 21.8 | |
| Reform | Bryn Thomas | 1,229 | 33.2 | 20.9 | |
| Labour | Jean Barley | 405 | 10.9 | 17.5 | |
| Labour | Allen Curtis* | 387 | 10.4 | 18.0 | |
| Labour | Duncan Wood | 372 | 10.0 | 18.4 | |
| Green | Keith Brown | 197 | 5.3 | 2.1 | |
| Green | Lily Daniels | 197 | 5.3 | 2.1 | |
| Green | Haley | 171 | 4.6 | 1.4 | |
| Conservative | Adam Aiston | 171 | 4.6 | 2.2 | |
| Conservative | Helen Maddison | 149 | 4.0 | 2.8 | |
| Conservative | Ehis Uwaifo | 119 | 3.2 | 3.6 | |
| Majority | |||||
| Turnout | |||||
| Liberal Democrats hold | Swing | ||||
| Liberal Democrats hold | Swing | ||||
| Liberal Democrats hold | Swing | ||||
Farringdon and Silksworth
| Party | Candidate | Votes | % | ±% | |
|---|---|---|---|---|---|
| Reform | Helen Greener | 1,684 | 40.2 | ||
| Reform | Ian Dury | 1,683 | 40.2 | ||
| Reform | Robert Hutchinson | 1,644 | 39.2 | ||
| Labour | Joanne Laverick* | 1,187 | 28.3 | ||
| Labour | Phil Tye* | 1,124 | 26.8 | ||
| Labour | Lauren Laws | 1,023 | 24.4 | ||
| Green | Scott Burrows | 350 | 8.4 | ||
| Green | Heidi Tolson | 274 | 6.5 | ||
| Green | Billy Howells | 264 | 6.3 | ||
| Conservative | Joesph Austin | 229 | 5.5 | ||
| Conservative | Deborah Mullen | 204 | 4.9 | ||
| Conservative | Kevin de Roche | 203 | 4.8 | ||
| Liberal Democrats | Jess Jenkins | 154 | 3.7 | ||
| Liberal Democrats | Martin Smith | 131 | 3.1 | ||
| Liberal Democrats | Linda Mary Wood | 124 | 3.0 | ||
| Majority | |||||
| Turnout | |||||
| Reform win (new seat) | |||||
| Reform win (new seat) | |||||
| Reform win (new seat) | |||||
Fulwell
| Party | Candidate | Votes | % | ±% | |
|---|---|---|---|---|---|
| Liberal Democrats | Malcolm Bond* | 1,988 | 42.5 | 10.5 | |
| Liberal Democrats | Peter Walton* | 1,738 | 37.1 | 5.1 | |
| Liberal Democrats | Steve Pickering | 1,659 | 35.4 | 3.4 | |
| Reform | Phillip Thompson | 1,424 | 30.4 | 22.5 | |
| Reform | David Owen | 1,376 | 29.4 | 21.5 | |
| Reform | Janet Tyson | 1,199 | 25.6 | 17.7 | |
| Conservative | Michael Hartnack* | 1,186 | 25.3 | 10.5 | |
| Conservative | Nichola Austin-Ratcliffe | 847 | 18.1 | 17.7 | |
| Conservative | Bill Smith | 801 | 17.1 | 18.7 | |
| Labour | Naomi Mather | 380 | 8.1 | 12.5 | |
| Labour | Peter Barley | 376 | 8.0 | 12.6 | |
| Labour | Malcolm Kilner | 368 | 7.9 | 12.7 | |
| Green | Brian Plemper | 254 | 5.4 | 2.1 | |
| Green | Genevieve Johnson | 232 | 5.0 | 1.7 | |
| Green | Sebastian Graca de Silva | 214 | 4.6 | 1.3 | |
| Majority | |||||
| Turnout | |||||
| Liberal Democrats hold | Swing | ||||
| Liberal Democrats hold | Swing | ||||
| Liberal Democrats gain from Conservative | Swing | ||||
Grangetown
| Party | Candidate | Votes | % | ±% | |
|---|---|---|---|---|---|
| Reform | Daniel Cowie | 1,476 | 39.1 | ||
| Reform | Mark Wynn | 1,424 | 37.8 | ||
| Reform | Colin Wright | 1,334 | 35.4 | ||
| Labour | Michael Mordey* | 1,003 | 26.6 | ||
| Conservative | Michael Dixon* | 965 | 25.6 | ||
| Labour | Lynda Scanlan* | 936 | 24.8 | ||
| Labour | Ray Matthews | 917 | 24.3 | ||
| Conservative | Alison Mason | 765 | 20.3 | ||
| Conservative | Hardip Baras | 735 | 19.5 | ||
| Green | Layla-Jayne Laidler | 357 | 9.5 | ||
| Green | Serena Rush | 322 | 8.5 | ||
| Green | Grace Weir | 320 | 8.5 | ||
| Liberal Democrats | Marjorie Ledger | 162 | 4.3 | ||
| Liberal Democrats | Vince Morrison | 138 | 3.7 | ||
| Liberal Democrats | Audrey Smith | 133 | 3.5 | ||
| Majority | |||||
| Turnout | |||||
| Reform win (new seat) | |||||
| Reform win (new seat) | |||||
| Reform win (new seat) | |||||
Grindon and Thorney Close
| Party | Candidate | Votes | % | ±% | |
|---|---|---|---|---|---|
| Liberal Democrats | Paul Edgeworth* | 1,728 | 54.1 | 6.4 | |
| Liberal Democrats | Stephen O'Brien* | 1,678 | 52.5 | 8.0 | |
| Liberal Democrats | Margaret Crosby* | 1,673 | 52.4 | 8.1 | |
| Reform | Steven Mustard | 1,128 | 35.3 | 25.4 | |
| Reform | Michael Gutowski | 1,079 | 33.8 | 23.9 | |
| Reform | Mark Starling | 1,076 | 33.7 | 23.8 | |
| Labour | Dennis Carroll | 343 | 10.7 | 14.2 | |
| Labour | Ellie Young | 332 | 10.4 | 14.5 | |
| Labour | Keith Lakeman | 313 | 9.8 | 15.1 | |
| Conservative | Paula Reed | 91 | 2.8 | − | |
| Conservative | Alex Sinclair | 77 | 2.4 | 0.4 | |
| Conservative | John Wiper | 63 | 2.0 | 0.8 | |
| Majority | |||||
| Turnout | |||||
| Liberal Democrats hold | Swing | ||||
| Liberal Democrats hold | Swing | ||||
| Liberal Democrats hold | Swing | ||||
Herrington and Newbottle
| Party | Candidate | Votes | % | ±% | |
|---|---|---|---|---|---|
| Reform | Bill Blackett | 1,548 | 37.4 | ||
| Reform | Bruce Allcroft | 1,520 | 36.7 | ||
| Reform | Jeffrey Shaw | 1,416 | 34.2 | ||
| Conservative | Dominic McDonough* | 1,085 | 26.2 | ||
| Conservative | Robert Oliver | 1,068 | 25.8 | ||
| Conservative | Chris Burnicle* | 1,038 | 25.1 | ||
| Labour | Paul Jorgenson | 888 | 21.5 | ||
| Labour | Maureen Richardson | 875 | 21.1 | ||
| Labour | Martin Old | 872 | 21.1 | ||
| Green | Donna Brown | 300 | 7.2 | ||
| Green | Hayley Campbell | 297 | 7.2 | ||
| Green | Joella Lynch | 250 | 6.0 | ||
| Liberal Democrats | Michelle Hardie | 181 | 4.4 | ||
| Liberal Democrats | Christopher Marshall | 147 | 3.6 | ||
| Liberal Democrats | Malcolm Waine | 122 | 2.9 | ||
| Majority | |||||
| Turnout | |||||
| Reform win (new seat) | |||||
| Reform win (new seat) | |||||
| Reform win (new seat) | |||||
Hetton
| Party | Candidate | Votes | % | ±% | |
|---|---|---|---|---|---|
| Reform | Alan Davies | 1,340 | 43.4 | ||
| Reform | Jason Lloyd | 1,292 | 41.8 | ||
| Reform | Steven Paterson | 1,241 | 40.2 | ||
| Labour | James Blackburn* | 742 | 24.0 | ||
| Labour | George Callaghan | 587 | 19.0 | ||
| Labour | Christopher Tobin | 535 | 17.3 | ||
| Green | Rachel Lowe | 277 | 9.0 | ||
| Green | Christopher Donaldson | 260 | 8.4 | ||
| Green | Ynez Tulsen | 185 | 6.0 | ||
| Liberal Democrats | Ian Ellis | 153 | 5.0 | ||
| Conservative | Trevor Colgin | 132 | 4.3 | ||
| Liberal Democrats | Kath Gaffney | 121 | 3.9 | ||
| Conservative | Gwynneth Gibson | 113 | 3.7 | ||
| Liberal Democrats | Elizabeth Gaffney | 102 | 3.3 | ||
| Conservative | Henry Ndubuisi | 89 | 2.9 | ||
| Majority | |||||
| Turnout | |||||
Houghton North
| Party | Candidate | Votes | % | ±% | |
|---|---|---|---|---|---|
| Reform | Sandra Louisa Hobson-Tate | 1,584 | 51.1 | ||
| Reform | Joseph Francomb Parkin | 1,542 | 49.7 | ||
| Reform | Donna Sarah Thomas | 1,432 | 46.2 | ||
| Labour | John Price* | 973 | 31.4 | ||
| Labour | Mark Burrell* | 969 | 31.2 | ||
| Labour | Claire Danielle Bryant | 963 | 31.0 | ||
| Green | Steph Langford | 401 | 12.9 | ||
| Green | Pauline Robson | 275 | 8.9 | ||
| Green | Kirsty Elizabeth Younger | 248 | 8.0 | ||
| Conservative | Michaela Rhiannon Peacock | 195 | 6.3 | ||
| Conservative | Mark John Reynoldson | 171 | 5.5 | ||
| Conservative | Christel Rose | 162 | 5.2 | ||
| Liberal Democrats | Felicity Louise Brand | 152 | 4.9 | ||
| Liberal Democrats | Stewart Hardie | 130 | 4.2 | ||
| Liberal Democrats | Steven Render | 111 | 3.6 | ||
| Majority | |||||
| Turnout | |||||
Houghton South and Hetton Downs
| Party | Candidate | Votes | % | ±% | |
|---|---|---|---|---|---|
| Reform | Heather Finlay | 1,477 | 39.1 | ||
| Reform | Jonathon Robert Emerson | 1,339 | 35.4 | ||
| Reform | Michael Quigley | 1,327 | 35.1 | ||
| Labour | Kevin Johnston* | 999 | 26.4 | ||
| Labour | Tracy Dodds* | 975 | 25.8 | ||
| Labour | Melanie Thornton* | 904 | 23.9 | ||
| Green | Andrew Robertson | 466 | 12.3 | ||
| Green | Harrison Hopps | 334 | 8.8 | ||
| Conservative | Connor Sinclair | 233 | 6.2 | ||
| Liberal Democrats | Emma Jane Baker | 217 | 5.7 | ||
| Liberal Democrats | Mia Coupland | 188 | 5.0 | ||
| Conservative | Harry Levi Jordan Brandon Shovlin | 180 | 4.8 | ||
| Conservative | Mickey Mikhimade Olowoko | 179 | 4.7 | ||
| Liberal Democrats | Jan Foster | 175 | 4.6 | ||
| Majority | |||||
| Turnout | |||||
| Reform win (new seat) | |||||
| Reform win (new seat) | |||||
| Reform win (new seat) | |||||
Hylton Castle
| Party | Candidate | Votes | % | ±% | |
|---|---|---|---|---|---|
| Reform | Ian Jones | 1,383 | 47.1 | ||
| Reform | David Laing | 1,302 | 44.4 | ||
| Reform | Glen Gibbons | 1,285 | 43.8 | ||
| Labour | Denny Wilson* | 792 | 27.0 | ||
| Labour | Stephen Foster* | 772 | 26.3 | ||
| Labour | Allison Chisnall* | 767 | 26.1 | ||
| Liberal Democrats | Angela Smith | 178 | 6.1 | ||
| Liberal Democrats | William Douglas | 174 | 5.9 | ||
| Liberal Democrats | Miriam Townsend | 150 | 5.1 | ||
| Conservative | Les Dunn | 135 | 4.6 | ||
| Conservative | Denise Worthy | 128 | 4.4 | ||
| Conservative | Dorothy Hartnack | 127 | 4.3 | ||
| Majority | |||||
| Turnout | |||||
| Reform gain from Labour | Swing | ||||
| Reform gain from Labour | Swing | ||||
| Reform gain from Labour | Swing | ||||
Pallion and Ford
| Party | Candidate | Votes | % | ±% | |
|---|---|---|---|---|---|
| Liberal Democrats | Martin Haswell* | 1,700 | 47.7 | 0.5 | |
| Liberal Democrats | Steve Donkin* | 1,595 | 44.7 | 3.5 | |
| Liberal Democrats | Julia Potts* | 1,557 | 43.7 | 4.5 | |
| Reform | Raymond Lathan | 1,120 | 31.4 | 20.7 | |
| Reform | Emma Margetson | 1,051 | 29.5 | 18.8 | |
| Reform | David Parr | 1,011 | 34.0 | 23.5 | |
| Labour | Kenny Amadasun | 561 | 10.1 | 26.4 | |
| Labour | Angela Smith | 481 | 13.5 | 23.0 | |
| Labour | George Smith* | 425 | 11.9 | 24.6 | |
| Green | Naomi Browne | 313 | 8.8 | 7.2 | |
| Green | Rebecca Grant | 275 | 7.7 | 6.1 | |
| Green | Jamie Lee | 240 | 6.7 | 5.1 | |
| Independent | Karen Noble | 194 | 5.4 | − | |
| Conservative | Phil Avery | 99 | 2.8 | 0.3 | |
| Conservative | Bob Francis | 73 | 2.0 | 1.1 | |
| Conservative | Joy Tennant | 65 | 1.8 | 0.2 | |
| Majority | |||||
| Turnout | |||||
Pennywell and South Hylton
| Party | Candidate | Votes | % | ±% | |
|---|---|---|---|---|---|
| Reform | Carol Giles | 1,570 | 46.0 | ||
| Reform | Russell Giles | 1,551 | 45.4 | ||
| Reform | Julia Ann Irwing | 1,439 | 42.1 | ||
| Labour Co-op | Lynne Dagg* | 605 | 17.7 | ||
| Labour Co-op | Susan Watson* | 539 | 15.8 | ||
| Labour Co-op | Catherine Hunter* | 525 | 15.4 | ||
| Conservative | Greg Peacock | 364 | 10.7 | ||
| Green | Laura Dunning | 291 | 8.5 | ||
| Green | Simon Hughes | 252 | 7.4 | ||
| Conservative | Shaun Cudworth | 239 | 7.0 | ||
| Liberal Democrats | Godwin Ejeh | 196 | 5.7 | ||
| Liberal Democrats | Sunshine Babalola | 183 | 5.4 | ||
| Liberal Democrats | Anthony Usher | 175 | 5.1 | ||
| Conservative | Jake Walker | 172 | 5.0 | ||
| Majority | |||||
| Turnout | |||||
| Reform gain from Labour | Swing | ||||
| Reform gain from Labour | Swing | ||||
| Reform gain from Labour | Swing | ||||
Penshaw and Shiney Row
| Party | Candidate | Votes | % | ±% | |
|---|---|---|---|---|---|
| Reform | Carole Allcroft | 1,718 | 46.1 | ||
| Reform | Abbey Purcell | 1,640 | 44.0 | ||
| Reform | Axel Tye | 1,594 | 42.8 | ||
| Labour | Mel Speding* | 1,065 | 28.6 | ||
| Labour | Katherine Mason-Gage* | 1,005 | 27.0 | ||
| Labour | David Snowdon* | 967 | 25.9 | ||
| Green | Sam Mcbride | 371 | 10.0 | ||
| Green | Carl O'Halloran | 323 | 8.7 | ||
| Conservative | Christopher Rose | 287 | 7.7 | ||
| Conservative | David Oleka | 272 | 7.3 | ||
| Conservative | Irene Onyia | 254 | 6.8 | ||
| Liberal Democrats | Judy Durrant | 221 | 5.9 | ||
| Liberal Democrats | Dorinda Strokes | 172 | 4.6 | ||
| Liberal Democrats | Ringo Taylor | 149 | 4.0 | ||
| Majority | |||||
| Turnout | |||||
Redhouse
| Party | Candidate | Votes | % | ±% | |
|---|---|---|---|---|---|
| Reform | Shaun Conley | 1,329 | 47.4 | ||
| Reform | Chris Eynon | 1,270 | 45.3 | ||
| Reform | Ciera Hudspith | 1,260 | 44.9 | ||
| Labour Co-op | Paul Stewart* | 684 | 24.4 | ||
| Labour Co-op | Alison Smith* | 654 | 23.3 | ||
| Labour Co-op | John Usher* | 545 | 19.4 | ||
| Green | Martha Bradley | 232 | 8.3 | ||
| Green | John Scratcher | 206 | 7.3 | ||
| Independent | Paul Humble | 156 | 5.6 | ||
| Liberal Democrats | Steven Dale | 136 | 4.8 | ||
| Liberal Democrats | Janice Ellis | 122 | 4.4 | ||
| Liberal Democrats | Margaret Stephenson | 118 | 4.2 | ||
| Conservative | Louise Avery | 114 | 4.1 | ||
| Conservative | Bob Forster | 90 | 3.2 | ||
| Conservative | Sue Leishman | 87 | 3.1 | ||
| Majority | |||||
| Turnout | |||||
Roker
| Party | Candidate | Votes | % | ±% | |
|---|---|---|---|---|---|
| Reform | Kirsty Alder | 1,818 | 45.0 | ||
| Reform | Andrew Ramsey | 1,701 | 42.1 | ||
| Reform | Thomas Steele | 1,544 | 38.2 | ||
| Labour | Bev Grainger | 1,352 | 33.5 | ||
| Labour | Matthew Jackson | 1,291 | 32.0 | ||
| Labour | Tom Newton | 1,213 | 30.0 | ||
| Conservative | Sean Chapman | 607 | 15.0 | ||
| Conservative | Emma Porter | 454 | 11.2 | ||
| Green | Justine Merton-Scott | 430 | 10.7 | ||
| Conservative | David Ogundipe | 418 | 10.4 | ||
| Liberal Democrats | John Lennox | 380 | 9.4 | ||
| Green | Helen Schell | 348 | 8.6 | ||
| Liberal Democrats | Craig King | 306 | 7.6 | ||
| Liberal Democrats | Miguel Smith | 251 | 6.2 | ||
| Majority | |||||
| Turnout | |||||
| Reform gain from Labour | Swing | ||||
| Reform gain from Conservative | Swing | ||||
| Reform gain from Conservative | Swing | ||||
Ryhope
| Party | Candidate | Votes | % | ±% | |
|---|---|---|---|---|---|
| Reform | Sharon Surtees | 1,665 | 46.3 | 20.3 | |
| Reform | Pamela Taylor | 1,605 | 44.7 | 18.7 | |
| Reform | James Jackson | 1,549 | 43.1 | 17.1 | |
| Labour Co-op | Helen Glancy* | 1,044 | 29.1 | 24.6 | |
| Labour Co-op | Martyn Herron* | 1,014 | 28.2 | 25.5 | |
| Labour Co-op | Lindsey Leonard* | 969 | 27.0 | 26.7 | |
| Green | Nicola Jacques | 284 | 7.9 | 7.9 | |
| Green | Barry Jacques | 268 | 7.5 | 7.5 | |
| Green | Spencer Rose Cash-Archer | 255 | 7.1 | 7.1 | |
| Liberal Democrats | Lewis Hunter | 202 | 5.6 | 1.0 | |
| Conservative | James Doyle | 196 | 5.5 | 8.2 | |
| Liberal Democrats | David Banks | 179 | 5.0 | 1.6 | |
| Conservative | Pamela Jameson | 178 | 5.0 | 8.7 | |
| Liberal Democrats | Sharon Boddy | 162 | 4.5 | 2.1 | |
| Conservative | Pamela Taylor | 177 | 4.9 | 8.8 | |
| Majority | |||||
| Turnout | |||||
| Reform gain from Labour | Swing | ||||
| Reform gain from Labour | Swing | ||||
| Reform gain from Labour | Swing | ||||
Southwick
| Party | Candidate | Votes | % | ±% | |
|---|---|---|---|---|---|
| Reform | Michael Leadbitter | 1,357 | 50.9 | ||
| Reform | Jannine Morrow | 1,305 | 48.9 | ||
| Reform | Jamie Scott | 1,217 | 45.6 | ||
| Labour | Michael Butler* | 829 | 31.1 | ||
| Labour | Zoe Chandler | 733 | 27.5 | ||
| Labour | Kelly Chequer* | 729 | 27.3 | ||
| Green | Paul Jacques | 270 | 10.1 | ||
| Green | John Appleton | 260 | 9.8 | ||
| Liberal Democrats | Ben Hardie | 227 | 8.5 | ||
| Liberal Democrats | Craig Doughty | 220 | 8.3 | ||
| Green | Rafal Marzec | 195 | 7.3 | ||
| Liberal Democrats | Andrew Wood* | 167 | 6.3 | ||
| Conservative | Jon Reed | 127 | 4.8 | ||
| Conservative | Sheila Smith | 126 | 4.7 | ||
| Conservative | Kath Worthy | 123 | 4.6 | ||
| Independent | Rosalind Copeland | 114 | 4.3 | ||
| Majority | |||||
| Turnout | |||||
| Reform gain from Labour | Swing | ||||
| Reform gain from Labour | Swing | ||||
| Reform gain from Labour | Swing | ||||
Tunstall and Humbledon
| Party | Candidate | Votes | % | ±% | |
|---|---|---|---|---|---|
| Reform | David 'Taff' Wales | 1,225 | 32.1 | ||
| Reform | Richard Vardy | 1,194 | 31.3 | ||
| Reform | Glenda Hall | 1,191 | 31.2 | ||
| Conservative | Adele Graham-King* | 1,050 | 27.5 | ||
| Conservative | Lyall Jonathan Reed* | 1,039 | 27.2 | ||
| Conservative | Antony Mullen* | 1,037 | 27.2 | ||
| Labour | Lennon Airey | 814 | 21.3 | ||
| Labour | Charlie Bell | 789 | 20.7 | ||
| Green | Richard Bradley | 723 | 19.0 | ||
| Green | Dan Sullivan | 700 | 18.3 | ||
| Green | Dale Gillett | 698 | 18.3 | ||
| Labour | Zareen Haque | 672 | 17.6 | ||
| Liberal Democrats | Simon Dawes | 149 | 3.9 | ||
| Liberal Democrats | Janet Wood | 135 | 3.5 | ||
| Liberal Democrats | Robbie Potts | 129 | 3.4 | ||
| Majority | |||||
| Turnout | |||||
Washington Central
| Party | Candidate | Votes | % | ±% | |
|---|---|---|---|---|---|
| Reform | Joseph Phillips | 1,448 | 39.9 | 27.9 | |
| Reform | Janis Berzemnieks | 1,213 | 33.4 | 21.4 | |
| Reform | Saleem Memon | 1,112 | 30.7 | 18.7 | |
| Labour | Dianne Snowdon* | 1,035 | 28.5 | 34.4 | |
| Labour | Linda Williams* | 976 | 26.9 | 36.0 | |
| Labour | Harry Trueman* | 860 | 23.7 | 39.2 | |
| Green | Michael Colling | 360 | 9.9 | 4.9 | |
| Green | Ashley Smith | 349 | 9.6 | 4.6 | |
| Liberal Democrats | Rebecca Armstrong | 337 | 9.3 | 5.9 | |
| Liberal Democrats | Joshua Hall | 294 | 8.1 | 4.7 | |
| Conservative | Valerie Moore | 245 | 6.7 | 10.0 | |
| Green | Mishka Belik | 222 | 6.1 | 1.1 | |
| Conservative | Audrey Jaitay | 190 | 5.2 | 11.5 | |
| Conservative | Mary Ogundipe | 169 | 4.7 | 12.0 | |
| Liberal Democrats | Kelsey Hall | 159 | 4.4 | 1.0 | |
| Majority | |||||
| Turnout | |||||
| Reform gain from Labour | Swing | ||||
| Reform gain from Labour | Swing | ||||
| Reform gain from Labour | Swing | ||||
Washington East
| Party | Candidate | Votes | % | ±% | |
|---|---|---|---|---|---|
| Reform | Ian Hembrough | 1,275 | 43.0 | ||
| Reform | Emily Lopez | 1,123 | 37.9 | ||
| Reform | Anthony Ormond | 1,113 | 37.6 | ||
| Labour Co-op | Beth Jones* | 1,065 | 35.9 | ||
| Labour Co-op | Graeme Miller* | 910 | 30.7 | ||
| Labour Co-op | Jennifer Orji | 789 | 26.6 | ||
| Green | Gary Bridge | 429 | 14.5 | ||
| Green | Anna Snell | 243 | 8.2 | ||
| Green | Michal Chantkowski | 240 | 8.1 | ||
| Liberal Democrats | Lauren Laws | 240 | 8.1 | ||
| Conservative | Ian Francombe | 209 | 7.1 | ||
| Conservative | Finlee Gibbons | 195 | 6.6 | ||
| Conservative | Victor Oluwagbemi | 160 | 5.4 | ||
| Liberal Democrats | Helen Attey | 140 | 4.7 | ||
| Liberal Democrats | Nana Boddy | 126 | 4.3 | ||
| Majority | |||||
| Turnout | 2,963 | 35.5 | |||
| Reform gain from Labour | Swing | ||||
| Reform gain from Labour | Swing | ||||
| Reform gain from Labour | Swing | ||||
Washington North
| Party | Candidate | Votes | % | ±% | |
|---|---|---|---|---|---|
| Reform | Jason King | 1,313 | 37.5 | 15.6 | |
| Reform | Paul Donaghy | 1,311 | 37.4 | 24.7 | |
| Reform | Elizabeth Brown | 1,235 | 35.3 | 13.4 | |
| Labour | Michael Walker* | 935 | 26.7 | 37.5 | |
| Labour | Jill Fletcher* | 917 | 26.2 | 38.0 | |
| Labour | Callum McPake | 840 | 24.0 | 40.2 | |
| Green | Janette Nightingale | 366 | 10.4 | 10.4 | |
| Green | Ross Dargan | 328 | 9.4 | 9.4 | |
| Green | Steven Tolson | 236 | 6.7 | 6.7 | |
| Conservative | Ayobami Adeoye | 209 | 6.0 | 2.2 | |
| Conservative | Patricia Francis | 192 | 5.5 | 2.7 | |
| Conservative | Richard Green | 177 | 5.1 | 3.1 | |
| Liberal Democrats | Karen Laws | 102 | 2.9 | 2.7 | |
| Liberal Democrats | Carlton West | 97 | 2.8 | 2.8 | |
| Liberal Democrats | Kieran Wood | 87 | 2.5 | 3.1 | |
| Majority | |||||
| Turnout | |||||
| Reform gain from Labour | Swing | ||||
| Reform gain from Labour | Swing | ||||
| Reform gain from Labour | Swing | ||||
Washington South
| Party | Candidate | Votes | % | ±% | |
|---|---|---|---|---|---|
| Reform | Robert Pattison | 1,616 | 39.5 | 26.8 | |
| Reform | Elouise Redmayne | 1,591 | 38.9 | 26.2 | |
| Reform | John Watson | 1,518 | 37.1 | 24.4 | |
| Labour | Sean Laws* | 1,259 | 30.8 | 20.9 | |
| Labour | Logan Guy* | 1,154 | 28.2 | 23.5 | |
| Labour | Andrew Rowntree | 881 | 21.5 | 30.2 | |
| Conservative | Brandon Oakland | 705 | 17.2 | 12.4 | |
| Green | Fiona Miller* | 684 | 16.7 | 13.5 | |
| Conservative | Gabriel Green | 676 | 16.5 | 13.1 | |
| Conservative | Thomas Such | 664 | 16.2 | 13.4 | |
| Green | Theo Rose | 525 | 12.8 | 9.6 | |
| Green | Peter Deegan | 455 | 11.1 | 7.9 | |
| Liberal Democrats | Sean Terry | 200 | 4.9 | 2.2 | |
| Liberal Democrats | Jack Docherty | 152 | 3.7 | 1.0 | |
| Liberal Democrats | Amy Wilson | 138 | 3.4 | 0.7 | |
| Majority | |||||
| Turnout | |||||
| Reform gain from Labour | Swing | ||||
| Reform gain from Labour | Swing | ||||
| Reform gain from Labour | Swing | ||||
Washington West
| Party | Candidate | Votes | % | ±% | |
|---|---|---|---|---|---|
| Labour | Brandon Feeley* | 1,662 | 38.8 | 12.8 | |
| Labour | Joanne Chapman* | 1,560 | 36.4 | 15.2 | |
| Reform | Adrian Pickering | 1,508 | 35.2 | 17.2 | |
| Labour | Patricia Raynor | 1,400 | 32.7 | 18.9 | |
| Reform | Lee Redmayne | 1,357 | 31.7 | 13.7 | |
| Reform | Neil Moffitt | 1,350 | 31.5 | 13.5 | |
| Green | Josh Thurlow | 382 | 8.9 | 0.7 | |
| Green | Chloe Harvey | 370 | 8.6 | 0.4 | |
| Green | Paul Leonard | 349 | 8.1 | 0.1 | |
| Conservative | Sam Cosgrove | 269 | 6.3 | 8.1 | |
| Conservative | Neil King | 201 | 4.7 | 9.7 | |
| Conservative | Samson Ibijola | 153 | 3.6 | 10.8 | |
| Liberal Democrats | Viv Lee | 114 | 2.7 | 5.1 | |
| Liberal Democrats | Ernie Peel | 97 | 2.3 | 5.5 | |
| Liberal Democrats | Kairo Pearson | 89 | 2.1 | 5.7 | |
| Majority | |||||
| Turnout | |||||
| Labour hold | Swing | ||||
| Labour hold | Swing | ||||
| Reform gain from Labour | Swing | ||||
References
- ↑ "Reform UK takes control of Sunderland City Council". BBC.
- ↑ "Everything you need to know about landmark Sunderland 2026 local elections". Sunderland Echo. 1 January 2026. Retrieved 27 January 2026.
- ↑ "Sunderland facing 'all-out' elections in 2026 with boundary changes expected for city". Sunderland Echo. 15 November 2022. Retrieved 27 January 2026.
- ↑ Manning, Jonny (8 May 2026). "Reform UK takes control of Sunderland City Council from Labour". BBC News. Retrieved 8 May 2026.
- ↑ "Calderdale Council local election results: Labour retains control". www.bbc.com. 3 May 2024. Retrieved 27 January 2026.
- ↑ "Councillor quits Labour over what he calls 'anti-democratic removal' of former leader". Sunderland Echo. 25 June 2024. Retrieved 21 March 2026.
- ↑ "Conservative councillor resigns to sit as independent". Sunderland Echo. 17 June 2025. Retrieved 21 March 2026.
- ↑ "Reform UK label councillor's decision to quit the party a betrayal". Sunderland Echo. 13 February 2026. Retrieved 21 March 2026.
- ↑ Holland, Daniel (18 March 2026). "Reform to win four more North East councils in May, new polling predicts". Chronicle Live. Retrieved 22 March 2026.
- ↑ "New Sunderland City Council leader begins first day at the job after official vote takes place". Sunderland Echo. 21 May 2024. Retrieved 25 March 2026.
- ↑ "Local election results 2026". sunderland.gov.uk. Retrieved 15 May 2026.
- ↑ "Local Government Elections - Thursday 7 May 2026". Sunderland City Council. Retrieved 10 April 2026.
 Council elections in Tyne and Wear | |
|---|---|
| Gateshead | |
| Newcastle | |
| North Tyneside | |
| South Tyneside | |
| Sunderland | |
| Mayor of the North East | |
| Tyne and Wear CC |
|
| North of Tyne mayor |
|
| |
