Southampton Itchen
| Southampton, Itchen | |
|---|---|
| Borough constituency for the House of Commons | |
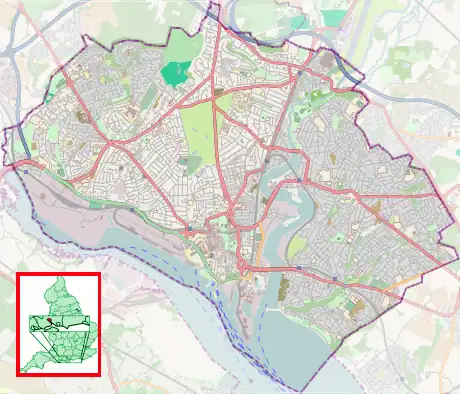
Boundaries since 1997 | |
 Boundary of Southampton Itchen in South East England | |
| County | Hampshire |
| Electorate | 72,150 (2023) [1] |
| Major settlements | Southampton |
| Current constituency | |
| Created | 1950 |
| Member of Parliament | Darren Paffey (Labour) |
| Seats | One |
| Created from | Southampton |
Southampton, Itchen is a constituency[n 1] represented in the House of Commons of the UK Parliament since 2024 by Darren Paffey from the Labour Party (UK). Before then, it had been held since 2015 by Royston Smith GM of the Conservative Party, who had announced his retirement from frontline politics in 2023 and did not seek re-election in 2024.[2]
The constituency is named after the River Itchen, which flows through it and is the lesser of the two major rivers that reach the tidal estuary of Southampton Water at the city.
Constituency profile

Southampton Itchen is a constituency in Hampshire in South East England. It covers the city centre of Southampton, including the Polygon, and the city's eastern suburbs across the River Itchen, including Woolston, Weston, Sholing, Thornhill, Bitterne, Harefield, Midanbury and Townhill Park.
Southampton is a port city on England's south coast and is a major commercial centre for freight and cruise shipping; the RMS Titanic departed from the city on its final journey. Much of the city centre was destroyed in the Southampton Blitz of World War II and has since been redeveloped; the vast majority of residents here live in flats and have average levels of wealth.[3][4] The suburbs east of the River Itchen are largely 20th-century developments with a mixture of housing types,[3] built to house city workers. Bitterne is affluent whilst Thornhill is a council estate with high levels of deprivation.[4] House prices across the constituency are generally lower than the UK average and considerably lower than the rest of South East England.[5]
Southampton Itchen has a low proportion of retirees and large populations of students and young adults; Southampton Solent University is located here and has around 9,000 students.[6] Residents have below-average rates of income and low levels of homeownership.[5] The child poverty rate is above-average.[7] Residents have average levels of education and a high proportion work in the retail and transport sectors.[5][8] The percentage claiming unemployment benefits is in line with the overall UK rate.[7] White people made up 86% of the population at the 2021 census.[9]
At the local city council, the city centre is represented by Labour Party and Green Party councillors whilst the eastern suburbs elected mostly Reform UK and Conservatives. An estimated 59% of voters in Southampton Itchen supported leaving the European Union in the 2016 referendum, higher than the UK-wide figure of 52%.[5]
History
The constituency was created in 1950, when the two-member Southampton constituency was abolished.
Until 1979 it was a safe Labour seat – apart from 1965 to 1971, when Horace King became the first member of the Labour Party to serve as the Speaker of the House of Commons. A Conservative MP, Christopher Chope, was elected in 1983 and 1987 after the sitting MP Bob Mitchell left Labour in 1981 for the SDP. The combination of Mitchell as a strong SDP-Liberal Alliance candidate in both 1983 and 1987, together with Conservative landslides, made Southampton Itchen highly competitive.
Since 1987, campaigns in the seat have resulted in a minimum of 26.8% of votes at each election consistently for the same two parties' choice for candidate, and the next highest-placed share having fluctuated between 3% and 23% of the vote. In those recent elections, save for 2015 when UKIP surged nationally, the third-placed candidate has been a Liberal Democrat, whose candidate lost their deposit in the result perhaps uniquely for an English university city seat in 2017, but which takes in far fewer of the university areas than Southampton Test. The seat attracted nine candidates in 1997; three in 1992. Oldest elections in the seat were sometimes a two-candidate contest, as in comparator mid-twentieth century English elections.
Labour candidate John Denham, defeated Chope by 551 votes in 1992 and held the seat with low-to-average majorities until 2010 when he won by 192 votes. From 2010 to 2017, the three general election results in the seat presented themselves as two-party ultra-marginal (finely-balanced) contests.
Royston Smith GM gained the seat as a Conservative Party candidate in 2015. He had led his party's group on the city council and first contested the seat in 2010. He retained the seat in the 2017 general election with a majority of 31 votes, and subsequently at the 2019 general election with a majority of over 4,000 votes. Following Smith's retirement for the 2024 election, the seat was retaken for Labour by Darren Paffey on a swing of 12.8%, resulting in a majority of over 6,000.
Boundaries
Historic
1950–1955: The County Borough of Southampton wards of Bevois, Bitterne and Peartree, Bitterne and Sholing, Newtown, Northam, Portswood, St Denys, St Mary's, Trinity, and Woolston.[10]
1955–1983: The County Borough of Southampton wards of Bitterne, Harefield, Peartree and Bitterne Manor, St Denys and Bitterne Park, St Luke's, St Mary's, Sholing, Swaythling, and Woolston.[11]
1983–1997: The City of Southampton wards of Bargate, Bitterne, Bitterne Park, Harefield, Peartree, St Luke's, and Sholing.
1997–2023: The City of Southampton wards of Bargate, Bitterne, Bitterne Park, Harefield, Peartree, Sholing, and Woolston.
Current
Following a review of local authority ward boundaries, which became effective in May 2023,[12][13] the constituency now comprises the following:
- The City of Southampton wards of Bargate, Bitterne Park, Harefield, Peartree, Sholing, Thornhill, and Woolston; and two polling districts from the Banister & Polygon ward.[14]
The 2023 review of Westminster constituencies, which was based on the ward structure in place at 1 December 2020, left the boundaries unchanged.[15]
The constituency is bounded to the west by Southampton Test (Labour), to the north by Romsey and Southampton North (Conservative), to the north east by Eastleigh (Lib Dem) and to the south east by Hamble Valley (Conservative).
Members of Parliament
Southampton prior to 1950
| Election | Member[16] | Party | |
|---|---|---|---|
| 1950 | Ralph Morley | Labour | |
| 1955 | Horace King | Labour | |
| 1965 | Speaker | ||
| 1971 by-election | Bob Mitchell | Labour | |
| 1981 | SDP | ||
| 1983 | Christopher Chope | Conservative | |
| 1992 | John Denham | Labour | |
| 2015 | Royston Smith | Conservative | |
| 2024 | Darren Paffey | Labour | |
Elections

Elections in the 2020s
| Party | Candidate | Votes | % | ±% | |
|---|---|---|---|---|---|
| Labour | Darren Paffey | 15,782 | 41.5 | +0.5 | |
| Conservative | Sidney Yankson | 9,677 | 25.4 | –25.1 | |
| Reform | Alex Culley | 6,853 | 18.0 | N/A | |
| Green | Neil Lyon-Kelly | 2,793 | 7.3 | +5.1 | |
| Liberal Democrats | James Batho | 2,684 | 7.1 | +1.8 | |
| TUSC | Declan Clune | 264 | 0.7 | N/A | |
| Majority | 6,105 | 16.1 | N/A | ||
| Turnout | 38,053 | 55.7 | –10.0 | ||
| Registered electors | 68,379 | ||||
| Labour gain from Conservative | Swing |  12.8 |
|||
Elections in the 2010s
| Party | Candidate | Votes | % | ±% | |
|---|---|---|---|---|---|
| Conservative | Royston Smith | 23,952 | 50.5 | +4.0 | |
| Labour | Simon Letts | 19,454 | 41.0 | −5.5 | |
| Liberal Democrats | Liz Jarvis | 2,503 | 5.3 | +2.3 | |
| Green | Osman Sen-Chadun | 1,040 | 2.2 | +0.6 | |
| UKIP | Kim Rose | 472 | 1.0 | −1.4 | |
| Majority | 4,498 | 9.5 | +9.4 | ||
| Turnout | 47,421 | 65.6 | +0.4 | ||
| Conservative hold | Swing | +4.8 | |||
| Party | Candidate | Votes | % | ±% | |
|---|---|---|---|---|---|
| Conservative | Royston Smith | 21,773 | 46.54 | +4.8 | |
| Labour | Simon Letts | 21,742 | 46.47 | +10.0 | |
| Liberal Democrats | Eleanor Bell | 1,421 | 3.0 | −0.6 | |
| UKIP | Kim Rose | 1,122 | 2.4 | −11.0 | |
| Green | Rosie Pearce | 725 | 1.6 | −2.6 | |
| Majority | 31 | 0.07 | −5.1 | ||
| Turnout | 46,783 | 65.2 | +3.4 | ||
| Conservative hold | Swing | -2.6 | |||
| Party | Candidate | Votes | % | ±% | |
|---|---|---|---|---|---|
| Conservative | Royston Smith | 18,656 | 41.7 | +5.4 | |
| Labour | Rowenna Davis | 16,340 | 36.5 | −0.3 | |
| UKIP | Kim Rose | 6,010 | 13.4 | +9.1 | |
| Green | John Spottiswoode | 1,876 | 4.2 | +2.8 | |
| Liberal Democrats | Eleanor Bell | 1,595 | 3.6 | −17.2 | |
| TUSC | Sue Atkins | 233 | 0.5 | +0.1 | |
| Majority | 2,316 | 5.2 | N/A | ||
| Turnout | 44,710 | 61.8 | +2.2 | ||
| Conservative gain from Labour | Swing | +2.8 | |||
| Party | Candidate | Votes | % | ±% | |
|---|---|---|---|---|---|
| Labour | John Denham | 16,326 | 36.8 | −11.5 | |
| Conservative | Royston Smith | 16,134 | 36.3 | +8.5 | |
| Liberal Democrats | David Goodall | 9,256 | 20.8 | −0.3 | |
| UKIP | Alan Kebbell | 1,928 | 4.3 | +0.5 | |
| Green | John Spottiswoode | 600 | 1.4 | New | |
| TUSC | Tim Cutter | 168 | 0.4 | New | |
| Majority | 192 | 0.5 | −21.0 | ||
| Turnout | 44,412 | 59.6 | +4.1 | ||
| Labour hold | Swing | −10.3 | |||
Elections in the 2000s
| Party | Candidate | Votes | % | ±% | |
|---|---|---|---|---|---|
| Labour | John Denham | 20,871 | 48.3 | −6.2 | |
| Conservative | Flick Drummond | 11,569 | 26.8 | −0.6 | |
| Liberal Democrats | David Goodall | 9,162 | 21.2 | +6.2 | |
| UKIP | Kim Rose | 1,623 | 3.8 | +1.8 | |
| Majority | 9,302 | 21.5 | −5.6 | ||
| Turnout | 43,225 | 55.5 | +1.5 | ||
| Labour hold | Swing | −2.8 | |||
| Party | Candidate | Votes | % | ±% | |
|---|---|---|---|---|---|
| Labour | John Denham | 22,553 | 54.5 | −0.3 | |
| Conservative | Caroline Nokes | 11,330 | 27.4 | −1.0 | |
| Liberal Democrats | Mark Cooper | 6,195 | 15.0 | +3.3 | |
| UKIP | Kim Rose | 829 | 2.0 | +1.7 | |
| Socialist Alliance | Gavin Marsh | 241 | 0.6 | New | |
| Socialist Labour | Michael Holmes | 225 | 0.5 | ||
| Majority | 11,223 | 27.1 | +0.7 | ||
| Turnout | 41,373 | 54.0 | −16.0 | ||
| Labour hold | Swing | +0.4 | |||
Electorate: 76,603
Elections in the 1990s
| Party | Candidate | Votes | % | ±% | |
|---|---|---|---|---|---|
| Labour | John Denham | 29,498 | 54.8 | +10.8 | |
| Conservative | Peter Fleet | 15,269 | 28.4 | −13.7 | |
| Liberal Democrats | David Harrison | 6,289 | 11.7 | −2.2 | |
| Referendum | John Clegg | 1,660 | 3.1 | New | |
| Socialist Labour | Kim Rose | 628 | 1.2 | New | |
| UKIP | Clive Hoar | 172 | 0.3 | New | |
| Socialist | Gavin Marsh | 113 | 0.2 | New | |
| Natural Law | Rosemary Barry | 110 | 0.2 | New | |
| ProLife Alliance | Ferdi McDermott | 99 | 0.2 | New | |
| Majority | 14,220 | 26.4 | +21.4 | ||
| Turnout | 53,838 | 70.0 | −5.1 | ||
| Labour hold | Swing | +12.3 | |||
Electorate: 76,869
| Party | Candidate | Votes | % | ±% | |
|---|---|---|---|---|---|
| Labour | John Denham | 24,402 | 44.0 | +11.9 | |
| Conservative | Christopher Chope | 23,851 | 43.0 | −1.3 | |
| Liberal Democrats | James R.T. Hodgson | 7,221 | 13.0 | −10.6 | |
| Majority | 551 | 1.0 | N/A | ||
| Turnout | 55,474 | 76.9 | +1.0 | ||
| Labour gain from Conservative | Swing | +6.6 | |||
Elections in the 1980s
| Party | Candidate | Votes | % | ±% | |
|---|---|---|---|---|---|
| Conservative | Christopher Chope | 24,419 | 44.3 | +2.8 | |
| Labour | John Denham | 17,703 | 32.1 | +5.0 | |
| SDP | Bob Mitchell | 13,006 | 23.6 | −7.9 | |
| Majority | 6,716 | 12.2 | +2.2 | ||
| Turnout | 55,128 | 75.9 | +2.6 | ||
| Conservative hold | Swing | -1.1 | |||
| Party | Candidate | Votes | % | ±% | |
|---|---|---|---|---|---|
| Conservative | Christopher Chope | 21,937 | 41.5 | ||
| SDP | Bob Mitchell | 16,647 | 31.5 | ||
| Labour | John Denham | 14,324 | 27.1 | ||
| Majority | 5,290 | 10.0 | N/A | ||
| Turnout | 52,908 | 73.3 | |||
| Conservative gain from SDP | Swing | ||||
Elections in the 1970s
| Party | Candidate | Votes | % | ±% | |
|---|---|---|---|---|---|
| Labour | Bob Mitchell | 28,036 | 46.3 | −2.6 | |
| Conservative | Andrew Hunter | 26,434 | 43.6 | +8.2 | |
| Liberal | John Pindar | 6,132 | 10.1 | −5.6 | |
| Majority | 1,602 | 2.7 | −10.8 | ||
| Turnout | 60,602 | 74.7 | +4.4 | ||
| Labour hold | Swing | ||||
| Party | Candidate | Votes | % | ±% | |
|---|---|---|---|---|---|
| Labour | Bob Mitchell | 28,168 | 48.9 | +4.9 | |
| Conservative | P. T. James | 20,373 | 35.4 | +0.4 | |
| Liberal | Joseph Cherryson | 9,071 | 15.7 | −5.3 | |
| Majority | 7,795 | 13.5 | +4.5 | ||
| Turnout | 57,612 | 70.3 | −6.9 | ||
| Labour hold | Swing | ||||
| Party | Candidate | Votes | % | ±% | |
|---|---|---|---|---|---|
| Labour | Bob Mitchell | 27,557 | 44.0 | N/A | |
| Conservative | P. T. James | 21,967 | 35.0 | N/A | |
| Liberal | Joseph Cherryson | 13,173 | 21.0 | N/A | |
| Majority | 5,590 | 9.0 | N/A | ||
| Turnout | 62,697 | 77.2 | +23.1 | ||
| Labour gain from Speaker | Swing | ||||
| Party | Candidate | Votes | % | ±% | |
|---|---|---|---|---|---|
| Labour | Bob Mitchell | 22,575 | 55.36 | New | |
| Conservative | James Spicer | 12,900 | 31.63 | New | |
| National Democratic | Edwin Bray | 3,090 | 7.58 | −14.32 | |
| Liberal | Joseph Cherryson | 2,214 | 5.43 | New | |
| Majority | 9,675 | 23.73 | N/A | ||
| Turnout | 40,779 | ||||
| Labour gain from Speaker | Swing | ||||
| Party | Candidate | Votes | % | ±% | |
|---|---|---|---|---|---|
| Speaker | Horace King | 29,417 | 67.2 | −18.2 | |
| National Democratic | Edwin Bray | 9,581 | 21.9 | New | |
| Independent | Brian Henry Phillips | 4,794 | 11.0 | New | |
| Majority | 19,836 | 45.3 | −25.5 | ||
| Turnout | 43,792 | 54.1 | +5.1 | ||
| Speaker hold | Swing | ||||
Elections in the 1960s
| Party | Candidate | Votes | % | ±% | |
|---|---|---|---|---|---|
| Speaker | Horace King | 30,463 | 85.4 | +32.7 | |
| Democratic Non-party Nationalist | Kenneth Douglas Hunt | 5,217 | 14.6 | New | |
| Majority | 25,246 | 70.8 | +52.6 | ||
| Turnout | 35,680 | 49.0 | −27.1 | ||
| Speaker gain from Labour | Swing | ||||
| Party | Candidate | Votes | % | ±% | |
|---|---|---|---|---|---|
| Labour | Horace King | 28,949 | 52.7 | −0.7 | |
| Conservative | Godfrey Olson | 18,974 | 34.5 | −12.1 | |
| Liberal | Joseph Cherryson | 7,007 | 12.8 | New | |
| Majority | 9,975 | 18.2 | +9.4 | ||
| Turnout | 54,930 | 76.1 | −1.9 | ||
| Labour hold | Swing | ||||
Elections in the 1950s
| Party | Candidate | Votes | % | ±% | |
|---|---|---|---|---|---|
| Labour | Horace King | 29,123 | 53.42 | ||
| Conservative | Evelyn King | 25,390 | 46.58 | ||
| Majority | 3,733 | 6.84 | |||
| Turnout | 54,513 | 78.00 | |||
| Labour hold | Swing | ||||
| Party | Candidate | Votes | % | ±% | |
|---|---|---|---|---|---|
| Labour | Horace King | 29,149 | 55.49 | ||
| Conservative | Leslie Loader | 23,378 | 44.51 | ||
| Majority | 5,771 | 10.98 | |||
| Turnout | 52,527 | 78.28 | |||
| Labour hold | Swing | ||||
| Party | Candidate | Votes | % | ±% | |
|---|---|---|---|---|---|
| Labour | Ralph Morley | 30,330 | 54.12 | ||
| National Liberal | Reginald Stranger | 25,708 | 45.88 | ||
| Majority | 4,622 | 8.24 | |||
| Turnout | 56,038 | 83.59 | |||
| Labour hold | Swing | ||||
| Party | Candidate | Votes | % | ±% | |
|---|---|---|---|---|---|
| Labour | Ralph Morley | 29,749 | 53.44 | ||
| National Liberal | Robert Hobart | 24,536 | 44.08 | ||
| Ind. Conservative | William Craven-Ellis | 1,380 | 2.48 | ||
| Majority | 5,213 | 9.36 | |||
| Turnout | 55,665 | 84.0 | |||
| Labour win (new seat) | |||||
See also
Notes
- ↑ A borough constituency (for the purposes of election expenses and type of returning officer)
References
- ↑ "The 2023 Review of Parliamentary Constituency Boundaries in England – Volume two: Constituency names, designations and composition – South East". Boundary Commission for England. Retrieved 13 June 2024.
- ↑ "Royston Smith: MP for Southampton Itchen set to step down". Daily Echo. 9 June 2023. Retrieved 6 July 2024.
- 1 2 "Accommodation type - Census Maps, ONS". ons.gov.uk. Retrieved 1 August 2026.
- 1 2 "Constituency data: Deprivation in England". commonslibrary.parliament.uk. Retrieved 1 July 2026.
- 1 2 3 4 "Seat Details - Southampton Itchen". electoralcalculus.co.uk. Retrieved 1 July 2026.
- ↑ "Where do HE students study?". Higher Education Statistics Agency. Students by HE provider: HE student enrolments by HE provider. Retrieved 27 January 2026.
- 1 2 "Constituency dashboard". House of Commons Library. Retrieved 1 July 2026.
- ↑ "Constituency data: businesses and industries". commonslibrary.parliament.uk. Retrieved 1 July 2026.
- ↑ "2021 census results: Ethnic groups in your constituency". commonslibrary.parliament.uk. 4 July 2024. Retrieved 1 July 2026.
- ↑ Representation of the People Act 1948, Sch 1
- ↑ Craig, F.W.S., ed. (1972). Boundaries of parliamentary constituencies 1985-1972. Chichester, Sussex: Political Reference Publications. ISBN 0-900178-09-4.
- ↑ LGBCE. "Southampton | LGBCE". www.lgbce.org.uk. Retrieved 1 April 2024.
- ↑ "The Southampton (Electoral Changes) Order 2023".
- ↑ "New Seat Details - Southampton Itchen". www.electoralcalculus.co.uk. Retrieved 1 April 2024.
- ↑ "The Parliamentary Constituencies Order 2023". Schedule 1 Part 6 South East region.
- ↑ Leigh Rayment's Historical List of MPs – Constituencies beginning with "I"
- ↑ "Statement of persons nominated, notice of poll and situation of polling stations" (PDF). Archived from the original (PDF) on 8 June 2024.
- ↑ "Southampton Itchen - General election results 2024". BBC News.
- ↑ "Southampton Itchen Parliamentary constituency". BBC News. Retrieved 26 November 2019.
- ↑ "Election Data 2015". Electoral Calculus. Archived from the original on 17 October 2015. Retrieved 17 October 2015.
- ↑ Archived 15 April 2015 at the Wayback Machine
- ↑ "BBC NEWS – Election 2015 – Southampton Itchen". BBC News.
- ↑ "Election Data 2010". Electoral Calculus. Archived from the original on 26 July 2013. Retrieved 17 October 2015.
- ↑ "Election Data 2005". Electoral Calculus. Archived from the original on 15 October 2011. Retrieved 18 October 2015.
- ↑ "Election Data 2001". Electoral Calculus. Archived from the original on 15 October 2011. Retrieved 18 October 2015.
- ↑ "Election Data 1997". Electoral Calculus. Archived from the original on 15 October 2011. Retrieved 18 October 2015.
- ↑ "Politics Resources". Election 1997. Politics Resources. 1 May 1997. Archived from the original on 14 June 2012. Retrieved 7 January 2011.
- ↑ C. Rallings & M. Thrasher, The Media Guide to the New Parliamentary Constituencies, p.150 (Plymouth: LGC Elections Centre, 1995)
- ↑ The 1997 election result is calculated relative to the notional, not the actual, 1992 result.
- ↑ "Election Data 1992". Electoral Calculus. Archived from the original on 15 October 2011. Retrieved 18 October 2015.
- ↑ "Politics Resources". Election 1992. Politics Resources. 9 April 1992. Retrieved 6 December 2010.
- ↑ "Election Data 1987". Electoral Calculus. Archived from the original on 15 October 2011. Retrieved 18 October 2015.
- ↑ "Election Data 1983". Electoral Calculus. Archived from the original on 15 October 2011. Retrieved 18 October 2015.
- ↑ The Times' Guide to the House of Commons. 1966.
- ↑ The Times' Guide to the House of Commons. 1964.
- ↑ The Times' Guide to the House of Commons. 1955.
- ↑ The Times' Guide to the House of Commons. 1951.
- ↑ The Times' Guide to the House of Commons. 1950.
External links
- Southampton, Itchen UK Parliament constituency (boundaries April 1997 – April 2010) at MapIt UK
- Southampton, Itchen UK Parliament constituency (boundaries April 2010 – May 2024) at MapIt UK
- Southampton Itchen UK Parliament constituency (boundaries from June 2024) at MapIt UK
Areas and suburbs of Southampton | |||||||
|---|---|---|---|---|---|---|---|
| |||||||
| Southampton Itchen | |||||||
| Southampton Test | |||||||
| Romsey and Southampton North | |||||||
| |||||||