Sheffield Heeley
| Sheffield Heeley | |
|---|---|
| Borough constituency for the House of Commons | |
Boundaries since 2024 | |
 Boundary of Sheffield Heeley in Yorkshire and the Humber | |
| County | South Yorkshire |
| Electorate | 65,373 (December 2018)[1] |
| Current constituency | |
| Created | 1950 |
| Member of Parliament | Louise Haigh (Labour) |
| Seats | One |
| Created from | Sheffield Ecclesall and Sheffield Park |
Sheffield Heeley is a constituency[n 1] in the city of Sheffield that was created in 1950. The seat has been represented in the House of Commons of the UK Parliament by Louise Haigh of the Labour Party since 2015.[n 2] Haigh has served as First Secretary of State, Chancellor of the Duchy of Lancaster and Minister for the Cabinet Office since July 2026.
Constituency profile

Sheffield Heeley is a constituency in South Yorkshire in England. It covers neighbourhoods to the east and south of Sheffield city centre including Heeley, Park Hill, Arbourthorne, Intake, Norton Lees, Woodseats and Greenhill.
Sheffield is traditionally an industrial city that grew rapidly during the late 18th and early 19th centuries, with steelmaking and coal mining being the predominant industries. Much of the city was redeveloped after World War II; the city's steel industry made it a target for the Luftwaffe in the Sheffield Blitz. This constituency contains a mixture of suburban neighbourhoods. The north of the constituency closer to the city centre consists mostly of 1960s council housing and is highly-deprived. The western and southern neighbourhoods are wealthier; this includes Heeley which is more inner-city in character with dense terraced housing and Greenhill which is highly-affluent.[2][3] House prices across the constituency are generally lower than the rest of Yorkshire and considerably lower than the UK average.[4]
Residents of Sheffield Heeley have a similar age profile to the rest of the country but with a below-average retired population.[5] They have low levels of income and homeownership and the child poverty rate is high.[4][6] Residents have average levels of education and a high proportion work in the education and technology sectors.[4][7] The percentage claiming unemployment benefits is high.[6] White people made up 82% of the population at the 2021 census, with Black people and Asians making up 6% each.[8]
At the local city council, the affluent southern suburbs are represented by Liberal Democrats, the dense urban neighbourhoods by Green Party councillors and the deprived northern estates by Labour Party and Reform UK representatives. An estimated 55% of voters in Sheffield Heeley supported leaving the European Union in the 2016 referendum, marginally higher than the UK-wide rate of 52%.[4]
History
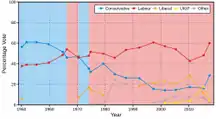
This seat was created in 1950, largely replacing the former Sheffield Ecclesall constituency, its boundaries being significantly altered in 1955 with the abolition of Sheffield Neepsend. At its first five elections, up to but excluding 1966, the seat was won by a Conservative, Peter Roberts; it changed hands three times between 1966 and 1974.
In more recent elections Sheffield Heeley moved from being a marginal Labour seat to having a solid Labour majority. Of the subsequent elections, only the 1983 and 2010 results have been fairly marginal; the others have suggested a safe Labour seat. At the 2010 election the Liberal Democrat had more than a quarter of the vote, whereas the Conservatives, on 17.3%, garnered 3% more votes than in 2005.[n 3]
Boundaries
1950–1955: The County Borough of Sheffield wards of Heeley, Nether Edge, Norton, and Woodseats.
1955–1974: The County Borough of Sheffield wards of Heeley, Nether Edge, Norton, Sharrow, and Woodseats.
1974–1983: The County Borough of Sheffield wards of Beauchief, Gleadless, Heeley, and Intake.
1983–2010: The City of Sheffield wards of Beauchief, Heeley, Intake, Norton, and Park.
2010–2024: The City of Sheffield wards of Arbourthorne, Beauchief and Greenhill, Gleadless Valley, Graves Park, and Richmond (as they existed on 12 April 2005).
2024–present: The City of Sheffield wards of: Beauchief & Greenhill; Gleadless Valley; Graves Park; Manor Castle; Park & Arbourthorne; Richmond (polling districts UB, UC and UE) (as they existed on 1 December 2020).[9]
After adjusting for revised ward boundaries, the Manor Castle ward was added from Sheffield Central, partly offset by the transfer of the majority of the Richmond ward to Sheffield South East.
Members of Parliament
Sheffield Ecclesall and Sheffield Park prior to 1950
| Election | Member | Party | |
|---|---|---|---|
| 1950 | Peter Roberts | Conservative | |
| 1966 | Frank Hooley | Labour | |
| 1970 | John Spence | Conservative | |
| Feb 1974 | Frank Hooley | Labour | |
| 1983 | Bill Michie | ||
| 2001 | Meg Munn | ||
| 2015 | Louise Haigh | ||
Elections
Elections in the 2020s
| Party | Candidate | Votes | % | ±% | |
|---|---|---|---|---|---|
| Labour | Louise Haigh | 21,230 | 55.2 | +1.3 | |
| Green | Alexi Dimond | 5,926 | 15.4 | +11.1 | |
| Conservative | Lorna Maginnis | 5,242 | 13.6 | −13.5 | |
| Liberal Democrats | Rebecca Atkinson | 3,863 | 10.0 | +3.3 | |
| SDP | Helen Jackman | 711 | 1.8 | N/A | |
| Workers Party | Steven Roy | 594 | 1.5 | N/A | |
| Party of Women | Louise McDonald | 482 | 1.3 | N/A | |
| TUSC | Mick Suter | 398 | 1.0 | N/A | |
| Majority | 15,304 | 39.8 | +12.9 | ||
| Turnout | 38,446 | 52.4 | –8.8 | ||
| Registered electors | 73,359 | ||||
| Labour hold | Swing |  4.9 |
|||
Elections in the 2010s
| 2019 notional result[12] | |||
|---|---|---|---|
| Party | Vote | % | |
| Labour | 24,619 | 53.9 | |
| Conservative | 12,399 | 27.1 | |
| Brexit Party | 3,643 | 8.0 | |
| Liberal Democrats | 3,070 | 6.7 | |
| Green | 1,964 | 4.3 | |
| Turnout | 45,695 | 61.2 | |
| Electorate | 74,614 | ||
| Party | Candidate | Votes | % | ±% | |
|---|---|---|---|---|---|
| Labour | Louise Haigh | 21,475 | 50.3 | −9.7 | |
| Conservative | Gordon Gregory | 12,955 | 30.3 | +1.6 | |
| Brexit Party | Tracy Knowles | 3,538 | 8.3 | New | |
| Liberal Democrats | Simon Clement-Jones | 2,916 | 6.8 | +2.2 | |
| Green | Paul Turpin | 1,811 | 4.2 | +2.1 | |
| Majority | 8,520 | 20.0 | −11.3 | ||
| Turnout | 42,695 | 63.8 | −1.3 | ||
| Labour hold | Swing | -5.6 | |||
| Party | Candidate | Votes | % | ±% | |
|---|---|---|---|---|---|
| Labour | Louise Haigh | 26,524 | 60.0 | +11.8 | |
| Conservative | Gordon Gregory | 12,696 | 28.7 | +12.5 | |
| Liberal Democrats | Joe Otten | 2,022 | 4.6 | −6.7 | |
| UKIP | Howard Denby | 1,977 | 4.5 | −12.9 | |
| Green | Declan Walsh | 943 | 2.1 | −4.0 | |
| SDP | Jaspreet Oberoi | 64 | 0.1 | New | |
| Majority | 13,828 | 31.3 | +0.5 | ||
| Turnout | 44,226 | 65.1 | +0.4 | ||
| Labour hold | Swing | -0.4 | |||
| Party | Candidate | Votes | % | ±% | |
|---|---|---|---|---|---|
| Labour | Louise Haigh | 20,269 | 48.2 | +5.6 | |
| UKIP | Howard Denby | 7,315 | 17.4 | +13.7 | |
| Conservative | Stephen Castens | 6,792 | 16.2 | −1.1 | |
| Liberal Democrats | Simon Clement-Jones | 4,746 | 11.3 | −17.1 | |
| Green | Rita Wilcock | 2,566 | 6.1 | +3.7 | |
| TUSC | Alan Munro | 238 | 0.6 | New | |
| English Democrat | David Haslett | 122 | 0.3 | New | |
| Majority | 12,954 | 30.8 | +16.6 | ||
| Turnout | 42,048 | 60.7 | −1.3 | ||
| Labour hold | Swing | ||||
| Party | Candidate | Votes | % | ±% | |
|---|---|---|---|---|---|
| Labour Co-op | Meg Munn | 17,409 | 42.6 | −11.5 | |
| Liberal Democrats | Simon Clement-Jones | 11,602 | 28.4 | +7.0 | |
| Conservative | Anne Crampton | 7,081 | 17.3 | +3.0 | |
| BNP | John Beatson | 2,260 | 5.5 | +2.1 | |
| UKIP | Charlotte Arnott | 1,530 | 3.7 | +1.4 | |
| Green | Gareth Roberts | 989 | 2.4 | −1.2 | |
| Majority | 5,807 | 14.2 | −19.5 | ||
| Turnout | 40,871 | 62.0 | +4.3 | ||
| Labour Co-op hold | Swing | -9.25 | |||
Elections in the 2000s
| Party | Candidate | Votes | % | ±% | |
|---|---|---|---|---|---|
| Labour Co-op | Meg Munn | 18,405 | 54.0 | −3.0 | |
| Liberal Democrats | Colin Ross | 7,035 | 20.6 | −2.0 | |
| Conservative | Aster Crawshaw | 4,987 | 14.6 | +0.4 | |
| BNP | John Beatson | 1,314 | 3.9 | New | |
| Green | Rob Unwin | 1,312 | 3.9 | +1.6 | |
| UKIP | Mark Suter | 775 | 2.3 | +0.4 | |
| Socialist | Mark Dunnell | 265 | 0.8 | New | |
| Majority | 11,370 | 33.4 | −0.9 | ||
| Turnout | 34,093 | 57.1 | +2.0 | ||
| Labour Co-op hold | Swing | -0.5 | |||
| Party | Candidate | Votes | % | ±% | |
|---|---|---|---|---|---|
| Labour Co-op | Meg Munn | 19,452 | 57.0 | −3.7 | |
| Liberal Democrats | Dave Willis | 7,748 | 22.7 | +1.4 | |
| Conservative | Carolyn Abbott | 4,864 | 14.2 | −1.4 | |
| Green | Rob Unwin | 774 | 2.3 | New | |
| Socialist Labour | Brian Fischer | 667 | 2.0 | New | |
| UKIP | David Dunn | 634 | 1.9 | New | |
| Majority | 11,704 | 34.3 | −5.1 | ||
| Turnout | 34,139 | 55.1 | −9.9 | ||
| Labour Co-op hold | Swing | ||||
Elections in the 1990s
| Party | Candidate | Votes | % | ±% | |
|---|---|---|---|---|---|
| Labour | Bill Michie | 26,274 | 60.7 | +5.0 | |
| Liberal Democrats | Roger Davison | 9,196 | 21.3 | +2.9 | |
| Conservative | John Harthman | 6,767 | 15.6 | −10.3 | |
| Referendum | David Mawson | 1,029 | 2.4 | New | |
| Majority | 17,078 | 39.4 | +9.6 | ||
| Turnout | 43,266 | 65.0 | −5.9 | ||
| Labour hold | Swing | ||||
| Party | Candidate | Votes | % | ±% | |
|---|---|---|---|---|---|
| Labour | Bill Michie | 28,005 | 55.7 | +2.3 | |
| Conservative | David Beck | 13,051 | 25.9 | −0.4 | |
| Liberal Democrats | Peter Moore | 9,247 | 18.4 | −1.9 | |
| Majority | 14,954 | 29.8 | +2.7 | ||
| Turnout | 50,303 | 70.9 | −1.1 | ||
| Labour hold | Swing | ||||
Elections in the 1980s
| Party | Candidate | Votes | % | ±% | |
|---|---|---|---|---|---|
| Labour | Bill Michie | 28,425 | 53.4 | +7.6 | |
| Conservative | Nicholas Mearing-Smith | 13,985 | 26.3 | −3.6 | |
| Alliance | Peter Moore | 10,811 | 20.3 | −4.0 | |
| Majority | 14,440 | 27.1 | +11.2 | ||
| Turnout | 53,221 | 72.0 | +1.5 | ||
| Labour hold | Swing | ||||
| Party | Candidate | Votes | % | ±% | |
|---|---|---|---|---|---|
| Labour | Bill Michie | 24,111 | 45.8 | −4.0 | |
| Conservative | Sidney Cordle | 15,743 | 29.9 | −10.2 | |
| Alliance | John Day | 12,813 | 24.3 | +14.8 | |
| Majority | 8,368 | 15.9 | +5.2 | ||
| Turnout | 52,667 | 70.5 | −6.8 | ||
| Labour hold | Swing | ||||
Elections in the 1970s
| Party | Candidate | Votes | % | ±% | |
|---|---|---|---|---|---|
| Labour | Frank Hooley | 24,618 | 49.8 | −1.8 | |
| Conservative | Danny George | 19,845 | 40.1 | +8.1 | |
| Liberal | Rodney Webb | 4,708 | 9.5 | −5.4 | |
| National Front | P. K. Thorpe | 274 | 0.6 | −0.9 | |
| Majority | 4,773 | 9.7 | −9.9 | ||
| Turnout | 49,445 | 77.3 | +3.8 | ||
| Labour hold | Swing | ||||
| Party | Candidate | Votes | % | ±% | |
|---|---|---|---|---|---|
| Labour | Frank Hooley | 24,728 | 51.6 | +3.9 | |
| Conservative | Alan Page | 15,322 | 32.0 | −3.3 | |
| Liberal | Royden Fairfax | 7,151 | 14.9 | −2.1 | |
| National Front | Peter Revell | 723 | 1.5 | New | |
| Majority | 9,406 | 19.6 | +7.2 | ||
| Turnout | 47,924 | 73.5 | −8.5 | ||
| Labour hold | Swing | ||||
| Party | Candidate | Votes | % | ±% | |
|---|---|---|---|---|---|
| Labour | Frank Hooley | 25,317 | 47.7 | +1.8 | |
| Conservative | Robert Ingle | 18,732 | 35.3 | −11.7 | |
| Liberal | Anthony Singleton | 9,061 | 17.0 | +9.9 | |
| Majority | 6,585 | 12.4 | N/A | ||
| Turnout | 53,110 | 82.0 | +8.6 | ||
| Labour gain from Conservative | Swing | ||||
| Party | Candidate | Votes | % | ±% | |
|---|---|---|---|---|---|
| Conservative | John Spence | 27,950 | 47.0 | +1.0 | |
| Labour | Frank Hooley | 27,237 | 45.9 | −8.1 | |
| Liberal | Anthony Singleton | 4,220 | 7.1 | New | |
| Majority | 713 | 1.1 | N/A | ||
| Turnout | 59,407 | 73.4 | −5.3 | ||
| Conservative gain from Labour | Swing | ||||
Elections in the 1960s
| Party | Candidate | Votes | % | ±% | |
|---|---|---|---|---|---|
| Labour | Frank Hooley | 31,996 | 54.0 | +5.5 | |
| Conservative | John Spence | 27,267 | 46.0 | −5.5 | |
| Majority | 4,729 | 8.0 | N/A | ||
| Turnout | 59,263 | 78.7 | +2.7 | ||
| Labour gain from Conservative | Swing | ||||
| Party | Candidate | Votes | % | ±% | |
|---|---|---|---|---|---|
| Conservative | Peter Roberts | 29,587 | 51.5 | −7.5 | |
| Labour | Frank Hooley | 27,883 | 48.5 | +7.5 | |
| Majority | 1,704 | 3.0 | −15.0 | ||
| Turnout | 57,470 | 76.0 | −1.6 | ||
| Conservative hold | Swing | ||||
Elections in the 1950s
| Party | Candidate | Votes | % | ±% | |
|---|---|---|---|---|---|
| National Liberal | Peter Roberts | 33,236 | 59.0 | −1.9 | |
| Labour | Joan Mellors | 23,109 | 41.0 | +1.9 | |
| Majority | 10,127 | 18.0 | −3.8 | ||
| Turnout | 56,345 | 77.6 | +0.6 | ||
| National Liberal hold | Swing | ||||
| Party | Candidate | Votes | % | ±% | |
|---|---|---|---|---|---|
| National Liberal | Peter Roberts | 30,798 | 60.9 | −0.1 | |
| Labour | John Sewell | 19,747 | 39.1 | +0.1 | |
| Majority | 11,051 | 21.8 | −0.2 | ||
| Turnout | 50,545 | 77.0 | −7.6 | ||
| National Liberal hold | Swing | ||||
| Party | Candidate | Votes | % | ±% | |
|---|---|---|---|---|---|
| National Liberal | Peter Roberts | 27,776 | 61.0 | +4.7 | |
| Labour | Arnold Jennings | 17,729 | 39.0 | +1.2 | |
| Majority | 10,047 | 22.0 | +3.5 | ||
| Turnout | 45,505 | 84.6 | −3.5 | ||
| National Liberal hold | Swing | ||||
| Party | Candidate | Votes | % | ±% | |
|---|---|---|---|---|---|
| National Liberal | Peter Roberts | 26,560 | 56.3 | ||
| Labour | Arnold Jennings | 17,856 | 37.8 | ||
| Liberal | Phillip Beckerlegge | 2,779 | 5.9 | ||
| Majority | 8,704 | 18.5 | |||
| Turnout | 47,195 | 88.1 | |||
| National Liberal win (new seat) | |||||
See also
Notes
- ↑ A borough constituency (for the purposes of election expenses and type of returning officer)
- ↑ As with all constituencies, the constituency elects one Member of Parliament (MP) by the first past the post system of election at least every five years.
- ↑ The 8th different candidate, one for each election, since 1979.
References
- ↑ "Constituency data: electorates – House of Commons Library". Parliament UK. 15 June 2020. Retrieved 22 July 2020.
- ↑ "Constituency data: Deprivation in England". commonslibrary.parliament.uk. Retrieved 1 July 2026.
- ↑ "Accommodation type - Census Maps, ONS". ons.gov.uk. Retrieved 1 August 2026.
- 1 2 3 4 "Seat Details - Sheffield Heeley". electoralcalculus.co.uk. Retrieved 1 July 2026.
- ↑ "Constituency data: Population, by age". commonslibrary.parliament.uk. Retrieved 1 July 2026.
- 1 2 "Constituency dashboard". House of Commons Library. Retrieved 1 July 2026.
- ↑ "Constituency data: businesses and industries". commonslibrary.parliament.uk. Retrieved 1 July 2026.
- ↑ "2021 census results: Ethnic groups in your constituency". commonslibrary.parliament.uk. 4 July 2024. Retrieved 1 July 2026.
- ↑ "The Parliamentary Constituencies Order 2023". Schedule 1 Part 9 Yorkshire and the Humber region.
- ↑ "Sheffield Heeley results". BBC News. Retrieved 8 July 2024.
- ↑ "Parliamentary election results". Sheffield City Council. Retrieved 8 July 2024.
- ↑ "Notional results for a UK general election on 12 December 2019". Rallings & Thrasher, Professor David Denver (Scotland), Nicholas Whyte (NI) for Sky News, PA, BBC News and ITV News. UK Parliament. Retrieved 11 July 2024.
- ↑ "Sheffield Heeley Parliamentary constituency". BBC News. BBC. Retrieved 4 December 2019.
- ↑ "Sheffield Heeley". Sheffield City Council. Retrieved 12 May 2017.
- ↑ "Election Data 2015". Electoral Calculus. Archived from the original on 17 October 2015. Retrieved 17 October 2015.
- ↑ "Sheffield Heeley". BBC News. Retrieved 14 May 2015.
- ↑ "Election Data 2010". Electoral Calculus. Archived from the original on 26 July 2013. Retrieved 17 October 2015.
- ↑ "Election Data 2005". Electoral Calculus. Archived from the original on 15 October 2011. Retrieved 18 October 2015.
- ↑ "Election Data 2001". Electoral Calculus. Archived from the original on 15 October 2011. Retrieved 18 October 2015.
- ↑ "Election Data 1997". Electoral Calculus. Archived from the original on 15 October 2011. Retrieved 18 October 2015.
- ↑ "Election Data 1992". Electoral Calculus. Archived from the original on 15 October 2011. Retrieved 18 October 2015.
- ↑ "Election Data 1987". Electoral Calculus. Archived from the original on 15 October 2011. Retrieved 18 October 2015.
- ↑ "Election Data 1983". Electoral Calculus. Archived from the original on 15 October 2011. Retrieved 18 October 2015.
External links
- BBC Election 2005
- BBC Vote 2001
- Guardian Unlimited Politics (Election results from 1992 to the present) The Guardian
- Leigh Rayment's Historical List of MPs – Constituencies beginning with "H" (part 2)
- Politicsresources.net – Official Web Site ✔ (Election results from 1951 to the present)
- F. W. S. Craig, British Parliamentary Election Results 1918 – 1949
- F. W. S. Craig, British Parliamentary Election Results 1950 – 1970
- Sheffield General Election Results 1945 – 2001, Sheffield City Council
- Sheffield, Heeley UK Parliament constituency (boundaries April 1997 – April 2010) at MapIt UK
- Sheffield, Heeley UK Parliament constituency (boundaries April 2010 – May 2024) at MapIt UK
- Sheffield Heeley UK Parliament constituency (boundaries from June 2024) at MapIt UK