Rotherham (constituency)
| Rotherham | |
|---|---|
| Borough constituency for the House of Commons | |
Boundaries since 2024 | |
 Boundary of Rotherham in Yorkshire and the Humber | |
| County | South Yorkshire |
| Electorate | 61,119 (December 2019)[1] |
| Major settlements | Rotherham |
| Current constituency | |
| Created | 1885 |
| Member of Parliament | Sarah Champion (Labour) |
| Seats | One |
| Created from | Southern West Riding of Yorkshire |
Rotherham is a constituency[n 1] represented in the House of Commons of the UK Parliament since 2012 by Sarah Champion of the Labour Party.[n 2]
Constituency profile

Rotherham is a constituency in South Yorkshire in England. It is centred on the town of Rotherham and also includes the outlying villages of Thorpe Hesley, Thrybergh, Bramley, Brinsworth, Waverley and Treeton.
Rotherham is a large market town that forms part of Sheffield's wider urban area. The Industrial Revolution made the town an important centre for coal mining and later for the production of iron and steel. Deindustrialisation in the late 20th century had a negative effect on the town; today this is one of the country's most deprived constituencies with much of the town falling within the top 10% most-deprived areas in England. Most of the town's residents live in dense flats or terraces built to house industrial workers, although some of the town's outer areas like Waverley, Thorpe Hesley and Bramley are more affluent and contain recent suburban development.[2][3] House prices in this constituency are generally lower than the rest of Yorkshire and the average price is less than half the overall UK average.[4]
Residents of Rotherham have a similar age profile to the rest of the country, but with a slightly below-average proportion of retirees.[5] They have low levels of income and homeownership and the child poverty rate is high.[4][6] Residents have very low levels of education and a high proportion work in the health, manufacturing and public sectors.[4][7] The percentage claiming unemployment benefits is above average.[6] White people made up 84% of the population at the 2021 census. Asians, mostly of Pakistani origin, were the largest ethnic minority group at 10% and were largely concentrated in the neighbourhoods south of the town centre where they made up around a third of residents.[8]
At the local borough council, most of the constituency is represented by the Labour Party with some independent councillors elected in the south of the town. Voters in Rotherham strongly supported leaving the European Union in the 2016 referendum; an estimated 69% voted in favour of Brexit compared to the UK-wide figure of 52%, making Rotherham one of the top 25 most Brexit-supporting constituencies out of 650 nationwide according to Electoral Calculus.[4]
History
This constituency was created in the Redistribution of Seats Act 1885.
Rotherham has consistently returned Labour MPs since a by-election in 1933, following the earlier period before 1923 dominated by the Liberal and Conservative parties. The numerical Labour majority in every general election from 1935 onwards has been in five figures, with the exceptions of 2015, 2019 and 2024.
Boundaries
Historic
1885-1918: The Municipal Borough of Rotherham and part of Upper Strafforth and Tickhill petty sessional division, namely the parishes of Aston cum Aughton, Bramley, Brampton en le Morthen, Brinsworth, Catcliffe, Dalton, Denaby, Greasbrough, Hooton Roberts, Kimberworth, Orgreave, Ravenfield, Rawmarsh, Rotherham, Swinton, Thrybergh, Tinsley, Treeton, Ulley, Wallingwells, Whiston and Wickersley.[9]
1918–1950: The County Borough of Rotherham, and the Urban Districts of Greasbrough and Rawmarsh.
1950–1983: The County Borough of Rotherham.[10]
1983–2010: The Borough of Rotherham wards of Boston, Broom, Central, Greasbrough, Herringthorpe, Kimberworth, Park and Thorpe Hesley.
2010–2024: The Rotherham borough electoral wards of Boston Castle, Brinsworth and Catcliffe, Keppel, Rotherham East, Rotherham West, Valley, and Wingfield.[11]
Current
Following the 2023 review of Westminster constituencies which came into effect for the 2024 general election, the constituency comprises the following:
- The Metropolitan Borough of Rotherham wards of: Boston Castle; Brinsworth; Dalton & Thrybergh; Greasbrough; Keppel; Rother Vale; Rotherham East; Rotherham West; Wickersley North.[12]
Seat expanded to bring its electorate within the permitted range primarily by adding parts of the abolished constituency of Wentworth and Dearne, including northern parts of Wickersley and the village of Thrybergh.
It borders Rother Valley, Sheffield South East, Sheffield Brightside and Hillsborough, Penistone and Stocksbridge, and Rawmarsh and Conisbrough.
Members of Parliament
Elections
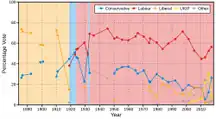

Elections in the 2020s
| Party | Candidate | Votes | % | ±% | |
|---|---|---|---|---|---|
| Labour | Sarah Champion | 16,671 | 45.1 | +4.4 | |
| Reform | John Cronly | 11,181 | 30.3 | +13.3 | |
| Liberal Democrats | Adam Carter | 2,824 | 7.6 | +1.4 | |
| Green | Tony Mabbott | 2,632 | 7.1 | +7.0 | |
| Workers Party | Taukir Iqbal | 1,714 | 4.6 | New | |
| Yorkshire | David Atkinson | 1,363 | 3.7 | +0.8 | |
| Independent | Ishtiaq Ahmad | 547 | 1.5 | New | |
| Majority | 5,490 | 14.9 | +7.3 | ||
| Turnout | 36,932 | 48.6 | −9.2 | ||
| Registered electors | 75,929 | ||||
| Labour hold | Swing | −4.5 | |||
Laila Cunningham was originally selected as the Conservative candidate for the seat, but withdrew shortly before the nominations deadline. As the party did not field a replacement, it is the only seat in Great Britain, aside from the Speaker's seat of Chorley, in which no Conservative candidate was nominated.[18]
Elections in the 2010s
| 2019 notional result[19] | |||
|---|---|---|---|
| Party | Vote | % | |
| Labour | 17,699 | 40.7 | |
| Conservative | 14,402 | 33.1 | |
| Brexit Party | 7,408 | 17.0 | |
| Liberal Democrats | 2,717 | 6.2 | |
| Others | 1,245 | 2.9 | |
| Green | 50 | 0.1 | |
| Turnout | 43,521 | 57.8 | |
| Electorate | 75,345 | ||
| Party | Candidate | Votes | % | ±% | |
|---|---|---|---|---|---|
| Labour | Sarah Champion | 14,736 | 41.3 | −15.1 | |
| Conservative | Gerri Hickton | 11,615 | 32.6 | +6.2 | |
| Brexit Party | Paul Hague | 6,125 | 17.2 | New | |
| Liberal Democrats | Adam Carter | 2,090 | 5.9 | +1.3 | |
| Yorkshire | Dennis Bannan | 1,085 | 3.0 | −0.8 | |
| Majority | 3,121 | 8.7 | −21.2 | ||
| Turnout | 35,651 | 57.8 | −2.4 | ||
| Labour hold | Swing | −10.7 | |||
| Party | Candidate | Votes | % | ±% | |
|---|---|---|---|---|---|
| Labour | Sarah Champion | 21,404 | 56.4 | +3.9 | |
| Conservative | James Bellis | 10,017 | 26.4 | +14.1 | |
| UKIP | Allen Cowles | 3,316 | 8.7 | −21.5 | |
| Liberal Democrats | Adam Carter | 1,754 | 4.6 | +1.7 | |
| Yorkshire | Mick Bower[22] | 1,432 | 3.8 | New | |
| Majority | 11,387 | 29.9 | +7.6 | ||
| Turnout | 38,050 | 60.2 | +0.8 | ||
| Labour hold | Swing | −5.1 | |||
| Party | Candidate | Votes | % | ±% | |
|---|---|---|---|---|---|
| Labour | Sarah Champion | 19,860 | 52.5 | +7.9 | |
| UKIP | Jane Collins | 11,414 | 30.2 | +24.3 | |
| Conservative | Sebastian Lowe | 4,656 | 12.3 | −4.4 | |
| Liberal Democrats | Janice Middleton | 1,093 | 2.9 | −13.1 | |
| TUSC | Pat McLaughlin | 409 | 1.1 | New | |
| BNP | Adam Walker | 225 | 0.6 | −9.8 | |
| English Democrat | Dean Walker | 166 | 0.4 | New | |
| Majority | 8,446 | 22.3 | −5.6 | ||
| Turnout | 37,823 | 59.4 | +0.4 | ||
| Labour hold | Swing | −8.2 | |||
| Party | Candidate | Votes | % | ±% | |
|---|---|---|---|---|---|
| Labour | Sarah Champion | 9,966 | 46.3 | +1.7 | |
| UKIP | Jane Collins | 4,648 | 21.8 | +15.9 | |
| BNP | Marlene Guest | 1,804 | 8.5 | −1.9 | |
| Respect | Yvonne Ridley | 1,778 | 8.3 | New | |
| Conservative | Simon Wilson | 1,157 | 5.4 | −11.3 | |
| English Democrat | David Wildgoose | 703 | 3.3 | New | |
| Independent | Simon Copley | 582 | 2.7 | New | |
| Liberal Democrats | Michael Beckett | 451 | 2.1 | −13.9 | |
| TUSC | Ralph Dyson | 261 | 1.2 | New | |
| Independent | Paul Dickson | 51 | 0.2 | New | |
| no description | Clint Bristow | 29 | 0.1 | New | |
| Majority | 5,318 | 24.5 | −3.4 | ||
| Turnout | 21,430 | 33.63 | −25.37 | ||
| Labour hold | Swing | −7.1 | |||
| Party | Candidate | Votes | % | ±% | |
|---|---|---|---|---|---|
| Labour | Denis MacShane | 16,741 | 44.6 | −13.1 | |
| Conservative | Jackie Whiteley | 6,279 | 16.7 | +3.4 | |
| Liberal Democrats | Rebecca Taylor | 5,994 | 16.0 | −0.4 | |
| BNP | Marlene Guest | 3,906 | 10.4 | +4.5 | |
| Independent | Peter Thirlwall | 2,366 | 6.3 | New | |
| UKIP | Caven Vines | 2,220 | 5.9 | +2.0 | |
| Majority | 10,462 | 27.9 | −7.7 | ||
| Turnout | 37,506 | 59.0 | +4.9 | ||
| Labour hold | Swing | −8.3 | |||
Elections in the 2000s
| Party | Candidate | Votes | % | ±% | |
|---|---|---|---|---|---|
| Labour | Denis MacShane | 15,840 | 52.8 | −11.1 | |
| Liberal Democrats | Tim Gordon | 5,159 | 17.2 | +6.6 | |
| Conservative | Lee Rotherham | 4,966 | 16.6 | −2.8 | |
| BNP | Marlene Guest | 1,986 | 6.6 | New | |
| UKIP | David Cutts | 1,122 | 3.7 | +1.2 | |
| Green | Dick Penycate | 905 | 3.0 | +1.0 | |
| Majority | 10,681 | 35.6 | −8.9 | ||
| Turnout | 29,978 | 55.1 | +4.4 | ||
| Labour hold | Swing | −8.8 | |||
| Party | Candidate | Votes | % | ±% | |
|---|---|---|---|---|---|
| Labour | Denis MacShane | 18,759 | 63.9 | −7.4 | |
| Conservative | Richard Powell | 5,682 | 19.4 | +5.1 | |
| Liberal Democrats | Charles Hall | 3,117 | 10.6 | +0.2 | |
| UKIP | Peter Griffith | 729 | 2.5 | New | |
| Green | Dick Penycate | 577 | 2.0 | New | |
| Socialist Alliance | Freda Smith | 352 | 1.2 | New | |
| John Lilburne Democratic Party | Geoffrey Bartholomew | 138 | 0.5 | New | |
| Majority | 13,077 | 44.5 | −12.5 | ||
| Turnout | 29,354 | 50.7 | −11.8 | ||
| Labour hold | Swing | −6.25 | |||
Elections in the 1990s
| Party | Candidate | Votes | % | ±% | |
|---|---|---|---|---|---|
| Labour | Denis MacShane | 26,852 | 71.3 | +7.4 | |
| Conservative | Simon Gordon | 5,383 | 14.3 | −9.4 | |
| Liberal Democrats | David B. Wildgoose | 3,919 | 10.4 | −1.9 | |
| Referendum | Ray T. Hollebone | 1,132 | 3.0 | New | |
| ProLife Alliance | Andrew Neal | 364 | 1.0 | New | |
| Majority | 21,469 | 57.0 | +16.8 | ||
| Turnout | 37,650 | 62.9 | −8.8 | ||
| Labour hold | Swing | ||||
| Party | Candidate | Votes | % | ±% | |
|---|---|---|---|---|---|
| Labour | Denis MacShane | 14,912 | 55.6 | −8.3 | |
| Liberal Democrats | David B. Wildgoose | 7,958 | 29.7 | +17.4 | |
| Conservative | Nick Gibb | 2,649 | 9.9 | −13.8 | |
| Monster Raving Loony | Screaming Lord Sutch | 1,114 | 4.2 | New | |
| Natural Law | Keith Laycock | 173 | 0.6 | New | |
| Majority | 6,954 | 25.9 | −14.3 | ||
| Turnout | 26,806 | 43.7 | −28.0 | ||
| Labour hold | Swing | −2.8 | |||
| Party | Candidate | Votes | % | ±% | |
|---|---|---|---|---|---|
| Labour | Jimmy Boyce | 27,933 | 63.9 | +4.2 | |
| Conservative | Stephen J.D. Yorke | 10,372 | 23.7 | +1.6 | |
| Liberal Democrats | David B. Wildgoose | 5,375 | 12.3 | −5.9 | |
| Majority | 17,561 | 40.2 | +2.6 | ||
| Turnout | 43,680 | 71.7 | +2.5 | ||
| Labour hold | Swing | +1.3 | |||
Elections in the 1980s
| Party | Candidate | Votes | % | ±% | |
|---|---|---|---|---|---|
| Labour | Stanley Crowther | 25,422 | 59.7 | +5.4 | |
| Conservative | John Stephens | 9,410 | 22.1 | −3.6 | |
| Liberal | Peter Bowler | 7,766 | 18.2 | −1.8 | |
| Majority | 16,012 | 37.6 | +9.0 | ||
| Turnout | 42,598 | 69.2 | +2.2 | ||
| Labour hold | Swing | ||||
| Party | Candidate | Votes | % | ±% | |
|---|---|---|---|---|---|
| Labour | Stanley Crowther | 22,236 | 54.3 | −6.3 | |
| Conservative | Chris Middleton | 10,527 | 25.7 | −4.2 | |
| Liberal | Pete Bowler | 8,192 | 20.0 | +11.6 | |
| Majority | 11,709 | 28.6 | −2.1 | ||
| Turnout | 40,955 | 67.0 | −5.1 | ||
| Labour hold | Swing | ||||
Elections in the 1970s
| Party | Candidate | Votes | % | ±% | |
|---|---|---|---|---|---|
| Labour | Stanley Crowther | 26,580 | 60.6 | −4.0 | |
| Conservative | D. Hinckley | 13,145 | 29.9 | +7.8 | |
| Liberal | I. House | 3,686 | 8.4 | −5.0 | |
| National Front | K. Davies | 490 | 1.1 | N/A | |
| Majority | 13,435 | 30.7 | −11.8 | ||
| Turnout | 43,901 | 72.1 | +6.6 | ||
| Labour hold | Swing | ||||
| Party | Candidate | Votes | % | ±% | |
|---|---|---|---|---|---|
| Labour | Stanley Crowther | 14,351 | 50.69 | −13.89 | |
| Conservative | Douglas Hinckley | 9,824 | 34.70 | +12.64 | |
| Liberal | Beth Graham | 2,214 | 7.82 | −5.53 | |
| National Front | George Wright | 1,696 | 5.99 | New | |
| World Grid Sunshine Room Party | Peter Bishop | 129 | 0.46 | New | |
| English National | Robin Atkinson | 99 | 0.35 | New | |
| Majority | 4,527 | 15.99 | −26.51 | ||
| Turnout | 28,313 | ||||
| Labour hold | Swing | ||||
| Party | Candidate | Votes | % | ±% | |
|---|---|---|---|---|---|
| Labour | Brian O'Malley | 25,874 | 64.6 | +4.6 | |
| Conservative | Richard Hambro | 8,840 | 22.1 | −0.8 | |
| Liberal | V. Bottomley | 5,350 | 13.4 | −3.7 | |
| Majority | 17,034 | 42.5 | +5.4 | ||
| Turnout | 40,064 | 65.5 | −8.8 | ||
| Labour hold | Swing | +2.7 | |||
| Party | Candidate | Votes | % | ±% | |
|---|---|---|---|---|---|
| Labour | Brian O'Malley | 27,088 | 60.0 | −6.4 | |
| Conservative | D. Lewis | 10,354 | 22.9 | −10.7 | |
| Liberal | J. Hughes | 7,726 | 17.1 | New | |
| Majority | 16,734 | 37.1 | +4.3 | ||
| Turnout | 45,168 | 74.3 | +11.4 | ||
| Labour hold | Swing | ||||
| Party | Candidate | Votes | % | ±% | |
|---|---|---|---|---|---|
| Labour | Brian O'Malley | 25,246 | 66.4 | −3.3 | |
| Conservative | Eric R. Cooke | 12,770 | 33.6 | +3.3 | |
| Majority | 12,476 | 32.8 | −5.6 | ||
| Turnout | 38,016 | 62.9 | −5.8 | ||
| Labour hold | Swing | ||||
Elections in the 1960s
| Party | Candidate | Votes | % | ±% | |
|---|---|---|---|---|---|
| Labour | Brian O'Malley | 27,402 | 69.7 | +3.2 | |
| Conservative | Eric R. Cooke | 11,925 | 30.3 | −3.2 | |
| Majority | 15,477 | 39.4 | +6.4 | ||
| Turnout | 39,327 | 68.7 | −2.9 | ||
| Labour hold | Swing | ||||
| Party | Candidate | Votes | % | ±% | |
|---|---|---|---|---|---|
| Labour | Brian O'Malley | 27,585 | 66.5 | +3.7 | |
| Conservative | John Michael Barrass | 13,907 | 33.5 | −3.7 | |
| Majority | 13,678 | 33.0 | +4.4 | ||
| Turnout | 41,492 | 71.6 | −7.3 | ||
| Labour hold | Swing | ||||
| Party | Candidate | Votes | % | ±% | |
|---|---|---|---|---|---|
| Labour | Brian O'Malley | 22,411 | 69.2 | +6.4 | |
| Conservative | John Michael Barrass | 9,209 | 28.5 | −8.7 | |
| Independent | Russell Ernest Eckley | 742 | 2.3 | New | |
| Majority | 13,202 | 40.7 | +15.1 | ||
| Turnout | 32,362 | ||||
| Labour hold | Swing | ||||
Elections in the 1950s
| Party | Candidate | Votes | % | ±% | |
|---|---|---|---|---|---|
| Labour | Jack Jones | 28,298 | 62.8 | −0.5 | |
| Conservative | Ronald Hall | 16,759 | 37.2 | +0.5 | |
| Majority | 11,539 | 25.6 | −1.0 | ||
| Turnout | 45,057 | 78.9 | +1.5 | ||
| Labour hold | Swing | ||||
| Party | Candidate | Votes | % | ±% | |
|---|---|---|---|---|---|
| Labour | Jack Jones | 27,423 | 63.3 | −2.3 | |
| Conservative | William G. Blake | 15,882 | 36.7 | +2.3 | |
| Majority | 11,541 | 26.6 | −4.6 | ||
| Turnout | 43,305 | 77.4 | −6.8 | ||
| Labour hold | Swing | ||||
| Party | Candidate | Votes | % | ±% | |
|---|---|---|---|---|---|
| Labour | Jack Jones | 31,124 | 65.6 | +1.2 | |
| Conservative | William G. Blake | 16,317 | 34.4 | +3.9 | |
| Majority | 14,807 | 31.2 | −2.7 | ||
| Turnout | 47,441 | 84.2 | −3.1 | ||
| Labour hold | Swing | ||||
| Party | Candidate | Votes | % | ±% | |
|---|---|---|---|---|---|
| Labour | Jack Jones | 31,211 | 64.4 | −9.8 | |
| Conservative | Richard Body | 14,744 | 30.5 | +4.7 | |
| Liberal | M. Foster | 2,458 | 5.1 | New | |
| Majority | 16,467 | 33.9 | −14.5 | ||
| Turnout | 48,413 | 87.3 | +10.9 | ||
| Labour hold | Swing | ||||
Elections in the 1940s
| Party | Candidate | Votes | % | ±% | |
|---|---|---|---|---|---|
| Labour | William Dobbie | 35,654 | 74.2 | +6.7 | |
| National Liberal | E. H. Phillips | 12,420 | 25.8 | −6.7 | |
| Majority | 23,234 | 48.4 | +13.4 | ||
| Turnout | 48,074 | 76.4 | −0.3 | ||
| Labour hold | Swing | ||||
Elections in the 1930s
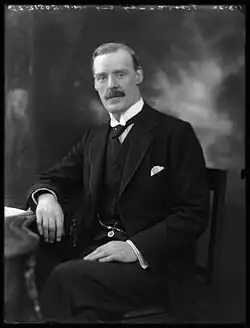
| Party | Candidate | Votes | % | ±% | |
|---|---|---|---|---|---|
| Labour | William Dobbie | 29,725 | 67.5 | −1.6 | |
| National Liberal | Thomas Worrall Casey | 14,298 | 32.5 | +1.6 | |
| Majority | 15,427 | 35.0 | −3.2 | ||
| Turnout | 44,023 | 76.7 | +3.2 | ||
| Labour hold | Swing | ||||
| Party | Candidate | Votes | % | ±% | |
|---|---|---|---|---|---|
| Labour | William Dobbie | 28,767 | 69.1 | +19.9 | |
| Conservative | Henry Drummond Wolff | 12,893 | 30.9 | −19.9 | |
| Majority | 15,874 | 38.2 | N/A | ||
| Turnout | 41,660 | 73.5 | −9.1 | ||
| Labour gain from Conservative | Swing | ||||
| Party | Candidate | Votes | % | ±% | |
|---|---|---|---|---|---|
| Conservative | George Herbert | 23,596 | 50.8 | +28.1 | |
| Labour | Fred Lindley | 22,834 | 49.2 | −11.2 | |
| Majority | 762 | 1.6 | N/A | ||
| Turnout | 46,430 | 82.6 | +1.2 | ||
| Conservative gain from Labour | Swing | ||||
Elections in the 1920s
| Party | Candidate | Votes | % | ±% | |
|---|---|---|---|---|---|
| Labour | Fred Lindley | 26,937 | 60.4 | +5.8 | |
| Unionist | Paul Latham | 10,101 | 22.7 | −26.7 | |
| Liberal | Reeves Charlesworth | 7,534 | 16.9 | New | |
| Majority | 16,836 | 37.7 | +28.5 | ||
| Turnout | 44,572 | 81.4 | −0.4 | ||
| Labour hold | Swing | ||||
| Party | Candidate | Votes | % | ±% | |
|---|---|---|---|---|---|
| Labour | Fred Lindley | 18,860 | 54.6 | +0.7 | |
| Unionist | Henry J Temple | 15,712 | 45.4 | −0.7 | |
| Majority | 3,148 | 9.2 | +1.4 | ||
| Turnout | 34,572 | 81.8 | +6.5 | ||
| Labour hold | Swing | ||||
| Party | Candidate | Votes | % | ±% | |
|---|---|---|---|---|---|
| Labour | Fred Lindley | 16,983 | 53.9 | +4.9 | |
| Unionist | Frederic Kelley | 14,535 | 46.1 | −4.9 | |
| Majority | 2,448 | 7.8 | N/A | ||
| Turnout | 31,518 | 75.3 | −6.3 | ||
| Labour gain from Unionist | Swing | +4.9 | |||
| Party | Candidate | Votes | % | ±% | |
|---|---|---|---|---|---|
| Unionist | Frederic Kelley | 17,093 | 51.0 | +6.2 | |
| Labour | James Walker | 16,449 | 49.0 | +10.9 | |
| Majority | 644 | 2.0 | −4.7 | ||
| Turnout | 33,542 | 81.6 | +18.4 | ||
| Unionist hold | Swing | ||||
Elections in the 1910s

| Party | Candidate | Votes | % | ±% | |
|---|---|---|---|---|---|
| Unionist | Frederic Kelley | 11,473 | 44.8 | +12.3 | |
| Labour | James Walker | 9,757 | 38.1 | New | |
| Liberal | Joseph Kenworthy | 3,805 | 14.9 | −52.6 | |
| National Democratic | Edmund Smith Bardsley | 564 | 2.2 | New | |
| Majority | 1,716 | 6.7 | N/A | ||
| Turnout | 25,599 | 63.2 | −4.6 | ||
| Unionist gain from Liberal | Swing | +32.5 | |||

| Party | Candidate | Votes | % | ±% | |
|---|---|---|---|---|---|
| Lib-Lab | Arthur Richardson | Unopposed | |||
| Lib-Lab hold | |||||

| Party | Candidate | Votes | % | ±% | |
|---|---|---|---|---|---|
| Liberal | Jack Pease | Unopposed | |||
| Liberal hold | |||||
| Party | Candidate | Votes | % | ±% | |
|---|---|---|---|---|---|
| Liberal | Jack Pease | 9,385 | 67.5 | −4.9 | |
| Conservative | James Harrop Dransfield | 4,511 | 32.5 | +4.9 | |
| Majority | 4,874 | 35.0 | −9.8 | ||
| Turnout | 13,896 | 67.8 | −14.7 | ||
| Registered electors | 20,487 | ||||
| Liberal hold | Swing | −4.9 | |||
| Party | Candidate | Votes | % | ±% | |
|---|---|---|---|---|---|
| Liberal | Jack Pease | Unopposed | |||
| Liberal hold | |||||
| Party | Candidate | Votes | % | ±% | |
|---|---|---|---|---|---|
| Liberal | William Holland | 12,225 | 72.4 | N/A | |
| Conservative | James Dransfield | 4,667 | 27.6 | New | |
| Majority | 7,558 | 44.8 | N/A | ||
| Turnout | 16,892 | 82.5 | N/A | ||
| Registered electors | 20,487 | ||||
| Liberal hold | Swing | N/A | |||
Elections in the 1900s
| Party | Candidate | Votes | % | ±% | |
|---|---|---|---|---|---|
| Liberal | William Holland | Unopposed | |||
| Liberal hold | |||||
| Party | Candidate | Votes | % | ±% | |
|---|---|---|---|---|---|
| Liberal | William Holland | 6,926 | 58.0 | N/A | |
| Conservative | R. H. V. Wragge | 5,021 | 42.0 | N/A | |
| Majority | 1,905 | 16.0 | N/A | ||
| Turnout | 11,947 | 78.0 | N/A | ||
| Registered electors | 15,325 | ||||
| Liberal hold | Swing | N/A | |||
Elections in the 1890s

| Party | Candidate | Votes | % | ±% | |
|---|---|---|---|---|---|
| Liberal | William Holland | 6,671 | 58.6 | N/A | |
| Conservative | Robert Horton Vernon Wragge | 4,714 | 41.4 | New | |
| Majority | 1,957 | 17.2 | N/A | ||
| Turnout | 11,385 | 77.1 | N/A | ||
| Registered electors | 14,763 | ||||
| Liberal hold | Swing | N/A | |||
- Caused by Acland's resignation.
| Party | Candidate | Votes | % | ±% | |
|---|---|---|---|---|---|
| Liberal | Arthur Dyke Acland | Unopposed | |||
| Liberal hold | |||||

| Party | Candidate | Votes | % | ±% | |
|---|---|---|---|---|---|
| Liberal | Arthur Dyke Acland | Unopposed | |||
| Liberal hold | |||||
- Caused by Acland's appointment as Vice President of the Committee of the Council on Education
| Party | Candidate | Votes | % | ±% | |
|---|---|---|---|---|---|
| Liberal | Arthur Dyke Acland | 6,567 | 69.8 | −1.5 | |
| Liberal Unionist | George Savile Foljambe | 2,839 | 30.2 | +1.5 | |
| Majority | 3,728 | 39.6 | −3.0 | ||
| Turnout | 9,406 | 69.4 | +2.1 | ||
| Registered electors | 13,551 | ||||
| Liberal hold | Swing | −1.5 | |||
Elections in the 1880s
| Party | Candidate | Votes | % | ±% | |
|---|---|---|---|---|---|
| Liberal | Arthur Dyke Acland | 5,155 | 71.3 | −2.3 | |
| Liberal Unionist | Francis Foljambe | 2,070 | 28.7 | +2.3 | |
| Majority | 3,085 | 42.6 | −4.6 | ||
| Turnout | 7,225 | 67.3 | −12.5 | ||
| Registered electors | 10,730 | ||||
| Liberal hold | Swing | −2.3 | |||
| Party | Candidate | Votes | % | ±% | |
|---|---|---|---|---|---|
| Liberal | Arthur Dyke Acland | 6,301 | 73.6 | ||
| Conservative | William Wright Hoole[36] | 2,258 | 26.4 | ||
| Majority | 4,043 | 47.2 | |||
| Turnout | 8,559 | 79.8 | |||
| Registered electors | 10,730 | ||||
| Liberal win (new seat) | |||||
See also
Notes
- ↑ A borough constituency (for the purposes of election expenses and type of returning officer)
- ↑ As with all constituencies, the constituency elects one Member of Parliament (MP) by the first past the post system of election at least every five years.
References
- ↑ "Constituency data: electorates – House of Commons Library". Parliament UK. 15 June 2020. Retrieved 22 July 2020.
- ↑ "Accommodation type - Census Maps, ONS". ons.gov.uk. Retrieved 1 August 2026.
- ↑ "Constituency data: Deprivation in England". commonslibrary.parliament.uk. Retrieved 1 July 2026.
- 1 2 3 4 "Seat Details - Rotherham". electoralcalculus.co.uk. Retrieved 1 July 2026.
- ↑ "Constituency data: Population, by age". commonslibrary.parliament.uk. Retrieved 1 July 2026.
- 1 2 "Constituency dashboard". House of Commons Library. Retrieved 1 July 2026.
- ↑ "Constituency data: businesses and industries". commonslibrary.parliament.uk. Retrieved 1 July 2026.
- ↑ "2021 census results: Ethnic groups in your constituency". commonslibrary.parliament.uk. 4 July 2024. Retrieved 1 July 2026.
- ↑ Frederic a Youngs (1991). Guide to the Administrative Units of England. Vol. II. p. 855. ISBN 0861931270.
- ↑ Craig, F. W. S., ed. (1972). Boundaries of parliamentary constituencies 1985-1972. Chichester, Sussex: Political Reference Publications. ISBN 0-900178-09-4.
- ↑ 2010 post-revision map Greater London and metropolitan areas of England
- ↑ "The Parliamentary Constituencies Order 2023". Schedule 1 Part 9 Yorkshire and the Humber region.
- ↑ Leigh Rayment's Historical List of MPs – Constituencies beginning with "R" (part 2)
- ↑ Robert Winnett (14 October 2010). "Denis MacShane reported to police over expenses claims". Daily Telegraph. London. Retrieved 14 October 2010.
- ↑ "Expenses probe into MP by Scotland Yard – News". Archived from the original on 17 October 2010.
- ↑ "Rotherham results". BBC News.
- ↑ "RESULTS FOR THE PARLIAMENTARY GENERAL ELECTION: THURSDAY 4 JULY 2024". Rotherham Metropolitan Borough Council. Retrieved 8 July 2024.
- ↑ Gutterdige, Nick (7 June 2024). "Conservatives fail to field candidate in Rotherham". The Daily Telegraph. Retrieved 7 June 2024.
- ↑ "Notional results for a UK general election on 12 December 2019". Rallings & Thrasher, Professor David Denver (Scotland), Nicholas Whyte (NI) for Sky News, PA, BBC News and ITV News. UK Parliament. Retrieved 11 July 2024.
- ↑ Bolton, James (15 November 2019). "Rotherham borough candidates confirmed for the 2019 General Election". Rotherham Metropolitan Borough Council. Retrieved 15 November 2019.
- ↑ "Statement of Persons Nominated – Rotherham Constituency". Rotherham Metropolitan Borough Council. Retrieved 19 May 2017.
- ↑ Party, Yorkshire (24 April 2017). "Mick Bower will be our candidate in Rotherham".
- ↑ "Election Data 2015". Electoral Calculus. Archived from the original on 17 October 2015. Retrieved 17 October 2015.
- ↑ "Rotherham". BBC News. Retrieved 14 May 2015.
- ↑ "Election Data 2010". Electoral Calculus. Archived from the original on 26 July 2013. Retrieved 17 October 2015.
- ↑ "UK > England > Yorkshire & the Humber > Rotherham". Election 2010. BBC News. 7 May 2010. Retrieved 10 May 2010.
- ↑ "Election Data 2005". Electoral Calculus. Archived from the original on 15 October 2011. Retrieved 18 October 2015.
- ↑ "Election Data 2001". Electoral Calculus. Archived from the original on 15 October 2011. Retrieved 18 October 2015.
- ↑ "Election Data 1997". Electoral Calculus. Archived from the original on 15 October 2011. Retrieved 18 October 2015.
- ↑ "Election Data 1992". Electoral Calculus. Archived from the original on 15 October 2011. Retrieved 18 October 2015.
- ↑ "Politics Resources". Election 1992. Politics Resources. 9 April 1992. Retrieved 6 December 2010.
- ↑ "Election Data 1987". Electoral Calculus. Archived from the original on 15 October 2011. Retrieved 18 October 2015.
- ↑ "Election Data 1983". Electoral Calculus. Archived from the original on 15 October 2011. Retrieved 18 October 2015.
- ↑ "1963 By Election Results". by-elections.co.uk. Archived from the original on 25 February 2012.
- 1 2 3 4 5 6 7 8 9 10 11 12 13 Craig, F. W. S., ed. (1974). British Parliamentary Election Results: 1885–1918. London: Macmillan Press. ISBN 9781349022984.
- ↑ "William Wright Hoole". Yorkshire Post and Leeds Intelligencer. 28 November 1885. p. 12. Retrieved 10 December 2017 – via British Newspaper Archive.
Sources
- BBC News, Election 2005
- BBC News, Vote 2001
- Guardian Unlimited Politics
- http://www.psr.keele.ac.uk/ (Election results from 1951 to the present)
- F. W. S. Craig, British Parliamentary Election Results 1918 – 1949
- F. W. S. Craig, British Parliamentary Election Results 1950 – 1970
External links
- Rotherham UK Parliament constituency (boundaries April 1997 – April 2010) at MapIt UK
- Rotherham UK Parliament constituency (boundaries April 2010 – May 2024) at MapIt UK
- Rotherham UK Parliament constituency (boundaries from June 2024) at MapIt UK