Rother Valley (constituency)
| Rother Valley | |
|---|---|
| County constituency for the House of Commons | |
Boundaries since 2024 | |
 Boundary of Rother Valley in Yorkshire and the Humber | |
| County | South Yorkshire |
| Electorate | 74,050 (December 2019)[1] |
| Major settlements | |
| Current constituency | |
| Created | 1918 |
| Member of Parliament | Jake Richards (Labour) |
| Seats | One |
| Created from | Doncaster and Rotherham |
Rother Valley is a constituency represented in the House of Commons of the UK Parliament by Jake Richards, a member of the Labour Party.
Constituency profile

Rother Valley is a constituency in South Yorkshire in England, forming part of the Metropolitan Borough of Rotherham. It is named after the River Rother, which forms part of its western boundary. If taken together with the connected village of Anston, Dinnington is the constituency's largest town, with a population of around 21,000.[2] Other settlements include the town of Maltby and the villages of Aston cum Aughton, Wales, Kiveton Park, Thurcroft, Whiston and Wickersley.
This constituency covers the towns, villages and rural areas to the east of Sheffield and Rotherham. This is traditionally a coal mining region; the settlements here were historically small farming communities but grew rapidly during the Edwardian era after coal was discovered in the area. The decline of the mining industry in the late 20th century affected Rother Valley; Dinnington, Maltby and Thurcroft remain highly-deprived today with most residents living in small terraced or semi-detached properties built to house industrial workers.[3] The rural parts of the constituency are wealthier and Whiston functions as an affluent suburb of Rotherham. This gives the constituency an average level of wealth overall.[4] House prices across the constituency are generally similar to the rest of Yorkshire but lower than the UK average.[5]
Rother Valley has a below-average young adult population and a high proportion of retirees.[6] Residents have below-average rates of income but high levels of homeownership.[5] The child poverty rate is higher than the UK-wide rate.[7] Residents have low levels of education and a high proportion work in the manufacturing, education and construction industries.[5][8] The percentage claiming unemployment benefits is low.[7] White people made up 95% of the population at the 2021 census.[9]
At the local borough council, most of the constituency is represented by Conservatives. Some Labour Party councillors were elected in Aston cum Aughton, and Wales and Kiveton Park elected independents. Voters in Rother Valley strongly supported leaving the European Union in the 2016 referendum; an estimated 66% voted in favour of Brexit compared to the UK-wide figure of 52%.[5]
History
This constituency was created by the Representation of the People Act 1918. Unusually in the light of the events of the Labour Party's early 20th-century years, the seat had been represented by a member of that party continuously since the seat was formed. The size of the majorities historically have not been particularly marginal in the elections, until the 2017 general election in which the majority was less than 4,000 votes. Nonetheless, this was still considered a safe seat for the party, until the 2019 general election in which the Conservatives won the seat for the first time. Labour regained the seat at the 2024 general election.
Boundaries
Historic
1918–1950: The Urban Districts of Handsworth; and Swinton; and the Rural Districts of Kiveton Park; and part of Rotherham.
1950–1983: The Urban Districts of Maltby; and Rawmarsh; and the Rural Districts of Kiveton Park; and Rotherham.[10]
1983–2010: The Borough of Rotherham wards of: Anston and Woodsetts, Aston, Orgreave and Ulley, Brinsworth, Catcliffe and Treeton, Kiveton Park, Maltby, St. John’s and Thurcroft and Whiston.[11]
2010–2024: The Metropolitan Borough of Rotherham wards of: Anston and Woodsetts; Dinnington; Hellaby; Holderness; Maltby; Rother Vale; Sitwell; and Wales[12]
Parliament accepted the Boundary Commission's Fifth Periodic Review of Westminster constituencies which slightly altered this constituency for the 2010 general election.
Current
Following the 2023 periodic review of Westminster constituencies which came into effect for the 2024 general election, the constituency comprises the following:
- The Metropolitan Borough of Rotherham wards of: Anston & Woodsetts; Aston & Todwick; Aughton & Swallownest; Dinnington; Hellaby & Maltby West; Maltby East; Sitwell; Thurcroft & Wickersley South; Wales.[13]
Minor changes to reflect modification of local authority ward boundaries.
Rother Valley constituency covers an area in the Metropolitan Borough of Rotherham south of Rotherham itself. It is bordered by the constituencies of Bassetlaw, Bolsover, Derbyshire North East, Don Valley, Rotherham, Sheffield South East, and Wentworth and Dearne.
Members of Parliament
Elections
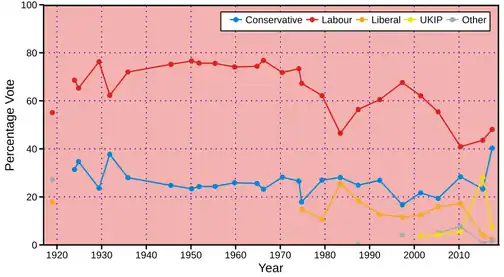
Elections in the 2020s
| Party | Candidate | Votes | % | ±% | |
|---|---|---|---|---|---|
| Labour | Jake Richards | 16,023 | 38.5 | +5.9 | |
| Conservative | Alexander Stafford | 15,025 | 36.1 | −10.0 | |
| Reform | Tony Harrison | 7,679 | 18.5 | +6.8 | |
| Green | Paul Martin | 1,706 | 4.1 | +1.6 | |
| Liberal Democrats | Colin Taylor | 1,175 | 2.8 | −2.0 | |
| Majority | 998 | 2.4 | N/A | ||
| Turnout | 41,608 | 59.9 | −4.9 | ||
| Registered electors | 69,460 | ||||
| Labour gain from Conservative | Swing | +8.0 | |||
Elections in the 2010s
| 2019 notional result[17] | |||
|---|---|---|---|
| Party | Vote | % | |
| Conservative | 20,975 | 46.1 | |
| Labour | 14,840 | 32.6 | |
| Brexit Party | 5,314 | 11.7 | |
| Liberal Democrats | 2,195 | 4.8 | |
| Green | 1,124 | 2.5 | |
| Others | 1,040 | 2.3 | |
| Turnout | 45,488 | 64.8 | |
| Electorate | 70,184 | ||
| Party | Candidate | Votes | % | ±% | |
|---|---|---|---|---|---|
| Conservative | Alexander Stafford | 21,970 | 45.1 | +4.8 | |
| Labour | Sophie Wilson | 15,652 | 32.1 | −16.0 | |
| Brexit Party | Allen Cowles | 6,264 | 12.9 | N/A | |
| Liberal Democrats | Colin Taylor | 2,553 | 5.2 | +2.9 | |
| Green | Emily West | 1,219 | 2.5 | +0.7 | |
| Independent | Nigel Short | 1,040 | 2.1 | N/A | |
| Majority | 6,318 | 13.0 | N/A | ||
| Turnout | 48,698 | 65.1 | −0.7 | ||
| Conservative gain from Labour | Swing | +10.4 | |||
| Party | Candidate | Votes | % | ±% | |
|---|---|---|---|---|---|
| Labour | Kevin Barron | 23,821 | 48.1 | +4.5 | |
| Conservative | Bethan Eddy | 19,939 | 40.3 | +17.0 | |
| UKIP | Lee Hunter | 3,704 | 7.5 | −20.6 | |
| Liberal Democrats | Katie Pruszynski | 1,155 | 2.3 | −1.9 | |
| Green | Paul Martin | 869 | 1.8 | N/A | |
| Majority | 3,882 | 7.8 | −7.7 | ||
| Turnout | 49,595 | 65.8 | +2.5 | ||
| Labour hold | Swing | −6.3 | |||
| Party | Candidate | Votes | % | ±% | |
|---|---|---|---|---|---|
| Labour | Kevin Barron | 20,501 | 43.6 | +2.7 | |
| UKIP | Allen Cowles | 13,204 | 28.1 | +22.5 | |
| Conservative | Gareth Streeter | 10,945 | 23.3 | −5.1 | |
| Liberal Democrats | Robert Teal | 1,992 | 4.2 | −13.1 | |
| English Democrat | Sharon Pilling | 377 | 0.8 | N/A | |
| Majority | 7,297 | 15.5 | +3.0 | ||
| Turnout | 47,019 | 63.3 | −0.9 | ||
| Labour hold | Swing | −9.9 | |||
| Party | Candidate | Votes | % | ±% | |
|---|---|---|---|---|---|
| Labour | Kevin Barron | 19,147 | 40.9 | −10.6 | |
| Conservative | Lynda Donaldson | 13,281 | 28.4 | +5.3 | |
| Liberal Democrats | Wesley Paxton[25] | 8,111 | 17.3 | +1.2 | |
| BNP | William Blair | 3,616 | 7.7 | +2.8 | |
| UKIP | Tina Dowdall | 2,613 | 5.6 | +1.3 | |
| Majority | 5,866 | 12.5 | −23.5 | ||
| Turnout | 46,768 | 64.2 | +6.5 | ||
| Labour hold | Swing | −8.0 | |||
Elections in the 2000s
| Party | Candidate | Votes | % | ±% | |
|---|---|---|---|---|---|
| Labour | Kevin Barron | 21,871 | 55.4 | −6.7 | |
| Conservative | Colin Phillips | 7,647 | 19.4 | −2.3 | |
| Liberal Democrats | Phil Bristow | 6,272 | 15.9 | +3.4 | |
| BNP | Nick Cass | 2,020 | 5.1 | N/A | |
| UKIP | Gordon Brown | 1,685 | 4.3 | +0.6 | |
| Majority | 14,224 | 36.0 | −4.4 | ||
| Turnout | 39,495 | 58.1 | +4.9 | ||
| Labour hold | Swing | −2.2 | |||
| Party | Candidate | Votes | % | ±% | |
|---|---|---|---|---|---|
| Labour | Kevin Barron | 22,851 | 62.1 | −5.5 | |
| Conservative | James Duddridge | 7,969 | 21.7 | +5.0 | |
| Liberal Democrats | Win Knight | 4,603 | 12.5 | +0.9 | |
| UKIP | David Cutts | 1,380 | 3.7 | N/A | |
| Majority | 14,882 | 40.4 | −10.5 | ||
| Turnout | 36,803 | 53.2 | −14.1 | ||
| Labour hold | Swing | ||||
Elections in the 1990s
| Party | Candidate | Votes | % | ±% | |
|---|---|---|---|---|---|
| Labour | Kevin Barron | 31,184 | 67.6 | +6.1 | |
| Conservative | Steven Stanbury | 7,699 | 16.7 | −10.2 | |
| Liberal Democrats | Stan Burgess | 5,342 | 11.6 | −1.1 | |
| Referendum | Stephen Cook | 1,932 | 4.2 | N/A | |
| Majority | 23,485 | 50.9 | +17.3 | ||
| Turnout | 46,157 | 67.3 | −7.7 | ||
| Labour hold | Swing | ||||
| Party | Candidate | Votes | % | ±% | |
|---|---|---|---|---|---|
| Labour | Kevin Barron | 30,977 | 60.5 | +4.1 | |
| Conservative | G. Toby A.W. Horton | 13,755 | 26.9 | +2.0 | |
| Liberal Democrats | Kevin A. Smith | 6,483 | 12.7 | −5.7 | |
| Majority | 17,222 | 33.6 | +2.1 | ||
| Turnout | 51,215 | 75.0 | −0.6 | ||
| Labour hold | Swing | +1.1 | |||
Elections in the 1980s
| Party | Candidate | Votes | % | ±% | |
|---|---|---|---|---|---|
| Labour | Kevin Barron | 28,292 | 56.4 | +9.9 | |
| Conservative | Paul Rayner | 12,502 | 24.9 | −3.2 | |
| SDP | John Boddy | 9,240 | 18.4 | −7.0 | |
| Workers Revolutionary | Michael Driver | 145 | 0.3 | N/A | |
| Majority | 15,790 | 31.5 | +13.1 | ||
| Turnout | 50,179 | 75.6 | +3.7 | ||
| Labour hold | Swing | ||||
| Party | Candidate | Votes | % | ±% | |
|---|---|---|---|---|---|
| Labour | Kevin Barron | 21,781 | 46.5 | ||
| Conservative | John Derrick | 13,156 | 28.1 | ||
| SDP | John Boddy | 11,903 | 25.4 | ||
| Majority | 8,625 | 18.4 | |||
| Turnout | 46,840 | 71.9 | |||
| Labour hold | Swing | ||||
Elections in the 1970s
| Party | Candidate | Votes | % | ±% | |
|---|---|---|---|---|---|
| Labour | Peter Hardy | 45,986 | 62.2 | −5.1 | |
| Conservative | R. Barber | 19,984 | 27.0 | +9.1 | |
| Liberal | C. Sykes | 7,937 | 10.7 | −4.1 | |
| Majority | 26,002 | 35.2 | −14.2 | ||
| Turnout | 73,907 | 74.6 | +2.4 | ||
| Labour hold | Swing | ||||
| Party | Candidate | Votes | % | ±% | |
|---|---|---|---|---|---|
| Labour | Peter Hardy | 44,670 | 67.3 | −6.1 | |
| Conservative | Gary Waller | 11,893 | 17.9 | −8.7 | |
| Liberal | Geoffrey Reid | 9,828 | 14.8 | N/A | |
| Majority | 32,777 | 49.4 | +2.6 | ||
| Turnout | 66,391 | 72.2 | −6.4 | ||
| Labour hold | Swing | ||||
| Party | Candidate | Votes | % | ±% | |
|---|---|---|---|---|---|
| Labour | Peter Hardy | 52,532 | 73.4 | +1.6 | |
| Conservative | Gary Waller | 19,058 | 26.6 | −1.6 | |
| Majority | 33,474 | 46.8 | +3.2 | ||
| Turnout | 71,590 | 78.6 | +8.0 | ||
| Labour hold | Swing | ||||
| Party | Candidate | Votes | % | ±% | |
|---|---|---|---|---|---|
| Labour | Peter Hardy | 44,322 | 71.8 | −5.0 | |
| Conservative | Tony Durant | 17,418 | 28.2 | +5.0 | |
| Majority | 26,904 | 43.6 | −10.0 | ||
| Turnout | 61,740 | 70.6 | −2.9 | ||
| Labour hold | Swing | ||||
Elections in the 1960s
| Party | Candidate | Votes | % | ±% | |
|---|---|---|---|---|---|
| Labour | David Griffiths | 43,634 | 76.82 | +2.40 | |
| Conservative | J Michael Clarke | 13,167 | 23.18 | −2.40 | |
| Majority | 30,467 | 53.64 | +4.80 | ||
| Turnout | 56,801 | 73.46 | +3.93 | ||
| Labour hold | Swing | +2.40 | |||
| Party | Candidate | Votes | % | ±% | |
|---|---|---|---|---|---|
| Labour | David Griffiths | 43,101 | 74.4 | +0.3 | |
| Conservative | Raymond Whitley Hadfield | 14,813 | 25.6 | −0.3 | |
| Majority | 28,288 | 48.8 | +0.6 | ||
| Turnout | 57,914 | 77.4 | −5.4 | ||
| Labour hold | Swing | ||||
Elections in the 1950s
| Party | Candidate | Votes | % | ±% | |
|---|---|---|---|---|---|
| Labour | David Griffiths | 43,962 | 74.1 | −1.5 | |
| Conservative | William Albert V Hoskins | 15,369 | 25.9 | +1.5 | |
| Majority | 28,593 | 48.2 | −3.0 | ||
| Turnout | 59,331 | 82.8 | +4.0 | ||
| Labour hold | Swing | ||||
| Party | Candidate | Votes | % | ±% | |
|---|---|---|---|---|---|
| Labour | David Griffiths | 39,968 | 75.6 | −0.1 | |
| Conservative | William Albert V Hoskins | 12,916 | 24.4 | +0.1 | |
| Majority | 27,052 | 51.2 | −0.2 | ||
| Turnout | 52,884 | 78.8 | −7.5 | ||
| Labour hold | Swing | ||||
| Party | Candidate | Votes | % | ±% | |
|---|---|---|---|---|---|
| Labour | David Griffiths | 41,990 | 75.7 | −0.9 | |
| Conservative | Ronald Hall | 13,470 | 24.3 | +0.9 | |
| Majority | 28,520 | 51.4 | −1.8 | ||
| Turnout | 55,460 | 86.3 | −1.1 | ||
| Labour hold | Swing | ||||
| Party | Candidate | Votes | % | ±% | |
|---|---|---|---|---|---|
| Labour | David Griffiths | 42,222 | 76.6 | +1.4 | |
| Conservative | William Robert Ackrill Breare | 12,887 | 23.4 | −1.4 | |
| Majority | 29,335 | 53.2 | +2.8 | ||
| Turnout | 55,109 | 87.4 | +12.2 | ||
| Labour hold | Swing | ||||
Elections in the 1940s
| Party | Candidate | Votes | % | ±% | |
|---|---|---|---|---|---|
| Labour | David Griffiths | 44,449 | 75.2 | +3.2 | |
| Conservative | J. Howard Bull | 14,669 | 24.8 | −3.2 | |
| Majority | 29,830 | 50.4 | +6.4 | ||
| Turnout | 59,118 | 75.2 | +1.4 | ||
| Labour hold | Swing | ||||
Elections in the 1930s
| Party | Candidate | Votes | % | ±% | |
|---|---|---|---|---|---|
| Labour | Edward Dunn | 33,271 | 72.0 | +9.7 | |
| Conservative | Alwyne Gervase Olliver | 12,907 | 28.0 | −9.7 | |
| Majority | 20,364 | 44.0 | +19.4 | ||
| Turnout | 46,178 | 73.8 | −3.7 | ||
| Labour hold | Swing | ||||
| Party | Candidate | Votes | % | ±% | |
|---|---|---|---|---|---|
| Labour | Thomas Walter Grundy | 26,185 | 62.3 | −14.0 | |
| Conservative | Alwyne Gervase Olliver[34] | 15,812 | 37.7 | +14.0 | |
| Majority | 10,373 | 24.6 | −28.0 | ||
| Turnout | 41,997 | 77.5 | −0.3 | ||
| Labour hold | Swing | ||||
Elections in the 1920s
| Party | Candidate | Votes | % | ±% | |
|---|---|---|---|---|---|
| Labour | Thomas Walter Grundy | 30,405 | 76.3 | +11.0 | |
| Unionist | Cecil Pike | 9,460 | 23.7 | −11.0 | |
| Majority | 20,945 | 52.6 | +22.0 | ||
| Turnout | 39,865 | 77.8 | +1.9 | ||
| Labour hold | Swing | +11.0 | |||
| Party | Candidate | Votes | % | ±% | |
|---|---|---|---|---|---|
| Labour | Thomas Walter Grundy | 18,750 | 65.3 | −3.3 | |
| Unionist | Frances R. Wade | 9,985 | 34.7 | +3.3 | |
| Majority | 8,765 | 30.6 | −6.6 | ||
| Turnout | 28,735 | 75.9 | +11.9 | ||
| Labour hold | Swing | ||||
| Party | Candidate | Votes | % | ±% | |
|---|---|---|---|---|---|
| Labour | Thomas Walter Grundy | 15,967 | 68.6 | N/A | |
| Unionist | Frances R. Wade | 7,323 | 31.4 | N/A | |
| Majority | 8,644 | 37.2 | N/A | ||
| Turnout | 39,865 | 64.0 | N/A | ||
| Labour hold | Swing | ||||
| Party | Candidate | Votes | % | ±% | |
|---|---|---|---|---|---|
| Labour | Thomas Walter Grundy | Unopposed | |||
| Labour hold | |||||
Elections in the 1910s
| Party | Candidate | Votes | % | ±% | |
|---|---|---|---|---|---|
| Labour | Thomas Walter Grundy | 9,917 | 55.1 | ||
| C | National Democratic | Ernest George Bearcroft | 4,894 | 27.2 | |
| Liberal | Albert Edward Mann Turner | 3,177 | 17.7 | ||
| Majority | 5,023 | 27.9 | |||
| Turnout | 17,988 | 56.3 | |||
| Labour win (new seat) | |||||
| C indicates candidate endorsed by the coalition government. | |||||
See also
Notes
References
- ↑ "Constituency data: electorates – House of Commons Library". Parliament UK. 15 June 2020. Archived from the original on 28 July 2020. Retrieved 22 July 2020.
- ↑ "Yorkshire and the Humber". citypopulation.de. Retrieved 12 August 2026.
- ↑ "Accommodation type - Census Maps, ONS". ons.gov.uk. Retrieved 1 August 2026.
- ↑ "Constituency data: Deprivation in England". commonslibrary.parliament.uk. Retrieved 1 July 2026.
- 1 2 3 4 "Seat Details - Rother Valley". electoralcalculus.co.uk. Retrieved 1 July 2026.
- ↑ "Constituency data: Population, by age". commonslibrary.parliament.uk. Retrieved 1 July 2026.
- 1 2 "Constituency dashboard". House of Commons Library. Retrieved 1 July 2026.
- ↑ "Constituency data: businesses and industries". commonslibrary.parliament.uk. Retrieved 1 July 2026.
- ↑ "2021 census results: Ethnic groups in your constituency". commonslibrary.parliament.uk. 4 July 2024. Retrieved 1 July 2026.
- ↑ Craig, F. W. S., ed. (1972). Boundaries of parliamentary constituencies 1985-1972. Chichester, Sussex: Political Reference Publications. ISBN 0-900178-09-4.
- ↑ "The Parliamentary Constituencies (England) Order 1995: Schedule", legislation.gov.uk, The National Archives, 28 June 1995, SI 1995/1626 (sch.), retrieved 22 June 2024
- ↑ "2010 post-revision map Greater London and metropolitan areas of England" (PDF). Archived (PDF) from the original on 3 December 2013. Retrieved 29 January 2013.
- ↑ "The Parliamentary Constituencies Order 2023". Schedule 1 Part 9 Yorkshire and the Humber region.
- ↑ Leigh Rayment's Historical List of MPs – Constituencies beginning with "R" (part 2)
- ↑ "Rother Valley results". BBC News. Retrieved 8 July 2024.
- ↑ "RESULTS FOR THE PARLIAMENTARY GENERAL ELECTION: THURSDAY 4 JULY 2024". Rotherham Metropolitan Borough Council. Retrieved 8 July 2024.
- ↑ "Notional results for a UK general election on 12 December 2019". Rallings & Thrasher, Professor David Denver (Scotland), Nicholas Whyte (NI) for Sky News, PA, BBC News and ITV News. UK Parliament. Retrieved 11 July 2024.
- ↑ "Rother Valley parliamentary constituency – Election 2019". BBC News. Archived from the original on 13 April 2019. Retrieved 22 November 2019.
- ↑ "Rother Valley parliamentary constituency". BBC News. Archived from the original on 13 April 2019. Retrieved 21 June 2018.
- ↑ "Election Data 2015". Electoral Calculus. Archived from the original on 17 October 2015. Retrieved 17 October 2015.
- ↑ "Rother Valley". BBC News. Archived from the original on 11 May 2015. Retrieved 14 May 2015.
- ↑ "Election Data 2010". Electoral Calculus. Archived from the original on 26 July 2013. Retrieved 17 October 2015.
- ↑ "Statement of Persons Nominated". Archived from the original on 15 June 2011. Retrieved 21 April 2010.
- ↑ "Election 2010: Rother Valley Constituency Results". BBC News. Archived from the original on 5 September 2017. Retrieved 10 May 2010.
- ↑ "Wesley Paxton". Liberal Democrats. Archived from the original on 18 September 2012. Retrieved 22 April 2010.
- ↑ "Election Data 2005". Electoral Calculus. Archived from the original on 15 October 2011. Retrieved 18 October 2015.
- ↑ "Election Data 2001". Electoral Calculus. Archived from the original on 15 October 2011. Retrieved 18 October 2015.
- ↑ "Election Data 1997". Electoral Calculus. Archived from the original on 15 October 2011. Retrieved 18 October 2015.
- ↑ "Election Data 1992". Electoral Calculus. Archived from the original on 15 October 2011. Retrieved 18 October 2015.
- ↑ "Politics Resources". Election 1992. Politics Resources. 9 April 1992. Archived from the original on 15 December 2009. Retrieved 6 December 2010.
- ↑ "Election Data 1987". Electoral Calculus. Archived from the original on 15 October 2011. Retrieved 18 October 2015.
- ↑ "Election Data 1983". Electoral Calculus. Archived from the original on 15 October 2011. Retrieved 18 October 2015.
- ↑ Kimber, Richard. "UK General Election results 1966". Political Science Resources. Archived from the original on 4 March 2016. Retrieved 17 April 2016.
- ↑ "Royal Navy (RN) Officers 1939–1945". World War II unit histories & officers. Archived from the original on 17 October 2020. Retrieved 10 October 2020.
Sources
- BBC News, Election 2005
- BBC News, Vote 2001
- Guardian Unlimited Politics[link removed]
- Leigh Rayment's Historical List of MPs – Constituencies beginning with "R" (part 2)
- Election results from 1951 to the present Archived 2 July 2009 at the Wayback Machine
- F. W. S. Craig, British Parliamentary Election Results 1918 – 1949
- F. W. S. Craig, British Parliamentary Election Results 1950 – 1970
External links
- Rother Valley UK Parliament constituency (boundaries April 1997 – April 2010) at MapIt UK
- Rother Valley UK Parliament constituency (boundaries April 2010 – May 2024) at MapIt UK
- Rother Valley UK Parliament constituency (boundaries from June 2024) at MapIt UK