Orpington (constituency)
| Orpington | |
|---|---|
| Borough constituency for the House of Commons | |
Interactive map of boundaries since 2024 | |
 Location within Greater London | |
| County | Greater London |
| Electorate | 71,571 (March 2020)[1] |
| Major settlements | Orpington and Farnborough |
| Current constituency | |
| Created | 1945 |
| Member of Parliament | Gareth Bacon (Conservative) |
| Seats | One |
| Created from | Chislehurst |
| During its existence contributed to new seat(s) of | Bromley and Biggin Hill |
Orpington is a constituency[n 1] represented in the House of Commons of the UK Parliament since 2019 by Gareth Bacon, a Conservative.[n 2] Created in 1945, it is the largest constituency in Greater London by area, covering the east and south of the London Borough of Bromley.[2]
Constituency profile

Orpington is a constituency in Greater London in England within the Borough of Bromley. It covers the town of Orpington and the small, rural villages to its south.
Orpington is a large, suburban town located around 13 miles (21 km) south-east of central London. It has historic origins and was a rural settlement until the interwar period when much of the suburban development took place.[3] Today, the town is mostly affluent, especially so in its western neighbourhoods like Petts Wood. There is some deprivation in the north and east of the town (St Paul's Cray and St Mary Cray) which contain some post-war council estate development.[4] The constituency is well-connected by rail to Kent and the rest of London, being served by four railway stations. Whilst only making up a tiny proportion of the population today, Orpington traditionally has a Romani community; the town hosted the first World Romani Congress at which the International Romani Union was established.[5] House prices across the constituency are generally lower than the London average but still considerably higher than the UK average.[6]
Orpington has a low proportion of young adults and an above-average population of middle-aged adults with children.[7] Residents have high levels of income and homeownership and the child poverty rate is less than half the UK-wide figure.[6][8] They have average levels of education and a high proportion work in the health and business administration sectors.[6][9] The percentage claiming unemployment benefits is below-average.[8] White people made up 78% of the population at the 2021 census. Asians, mostly of Indian origin, were the largest ethnic minority group at 10% and Black people were 6%.[10]
Most of the constituency's representatives at the local borough council are Conservatives, although some Reform UK councillors were elected in St Paul's Cray. An estimated 56% of voters in Orpington supported leaving the European Union in the 2016 referendum, higher than the UK-wide rate of 52%.[6]
History
Orpington was created in a major boundary review enacted at the 1945 general election, which followed an absence of reviews since 1918. The seats of Dartford and Chislehurst had both seen their electorate grow enormously into newly built houses since the 1918 review and were treated as one and reformed into four seats, creating the additional seats of Bexley and this one in 1945.
- Political history
The seat has been won by a Conservative since creation except for the 1962, 1964 and 1966 Liberal Party wins of Eric Lubbock.
The 2015 result made the seat the 43rd safest of the Conservative Party's 331 seats by percentage of majority.[11]
- Role in the Liberal Party revival
The seat is famous for its 1962 by-election when it was taken in a shock result and substantial victory by the Liberal Party candidate Eric Lubbock.[12] He lost the seat in the 1970 general election.
The constituency shared boundaries with the Orpington electoral division for election of councillors to the Greater London Council at elections in 1973, 1977 and 1981.
Boundaries and boundary changes
| Dates | Local authority | Maps | Wards |
|---|---|---|---|
| 1945–1950 | Orpington Urban District Municipal Borough of Beckenham Municipal Borough of Bromley |
 | The urban district of Orpington, and part of the municipal boroughs of Beckenham and Bromley.[13] |
| 1950–1955 | Orpington Urban District Dartford Rural District |
 | The urban district of Orpington, and the rural district of Dartford except the parishes of Darenth, Stone, Sutton at Hone, and Wilmington.[14] |
| 1955–1974 | Orpington Urban District (before 1965) London Borough of Bromley (after 1965) London Borough of Bexley (after 1965) |
 | The urban district of Orpington.[15] |
| 1974–1983 | London Borough of Bromley |  | Biggin Hill, Chelsfield, Darwin, Farnborough, Goddington, Petts Wood, and St Mary Cray.[16] |
| 1983–1997 | London Borough of Bromley |  | Chelsfield and Goddington, Crofton, Farnborough, Orpington Central, Petts Wood and Knoll, and St Mary Cray. |
| 1997–2010 | London Borough of Bromley |  | Biggin Hill, Chelsfield and Goddington, Crofton, Darwin, Farnborough, Orpington Central, Petts Wood and Knoll, St Mary Cray, and St Paul's Cray. |
| 2010–2024 | London Borough of Bromley |  | Biggin Hill, Chelsfield and Pratts Bottom, Cray Valley East, Darwin, Farnborough and Crofton, Orpington, and Petts Wood and Knoll. |
| 2024– | London Borough of Bromley | | Chelsfield, Darwin (except polling district DAR1), Farnborough and Crofton, Orpington, Petts Wood and Knoll, St Mary Cray, St Paul's Cray.[17] |
Historic
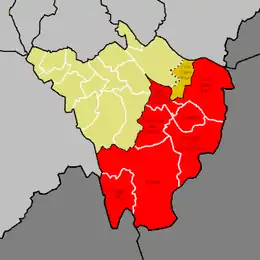
1945–1950
The constituency was formed entirely from the existing of constituency Chislehurst
1950–1955
The part of the municipal borough of Beckenham included in the seat was transferred to the new constituency of Beckenham, part of the municipal borough of Bromley included in the seat was transferred to the constituency of Bromley while the Dartford Rural District (expect the parishes of Darenth, Stone, Sutton at Hone and Wilmington) was transferred from Chislehurst
1955–1974
The part of the Dartford Rural District included in the seat was transferred to the constituency of Dartford
1974–1983
1983–1997
The wards of Biggin Hill and Darwin were transferred to the constituency of Ravensbourne
1997–2010
The wards of Biggin Hill and Darwin were transferred from the abolished constituency of Ravensbourne. The St Paul's Cray ward was transferred from the abolished constituency of Chislehurst
2010–2024
The ward of Cray Valley West was transferred to the constituency of Bromley and Chislehurst
Summary
The seat has changed a little in subsequent boundary reviews since 1955. For the 1997 general election the Ravensbourne seat which had emerged in the west by Bromley was divided between three constituencies which before then overshot the London Borough of Bromley, adding to Orpington the community of Biggin Hill.
Current
Further to the 2023 review of Westminster constituencies, which came into effect for the 2024 general election, the constituency was defined as comprising the following wards of the London Borough of Bromley as they existed on 1 December 2020:
- Chelsfield and Pratts Bottom; Cray Valley East; Cray Valley West; Darwin (part1); Farnborough and Crofton; Crockenhill; Well Hill; Hockenden; Orpington; Petts Wood and Knoll.[18]
1.Area marked “4” on the map of the Orpington constituency produced by the Boundary Commission for England[19]
The boundary with Bromley and Chislehurst (renamed Bromley and Biggin Hill) was realigned with Cray Valley West ward being transferred in (thus uniting the two Cray Valley wards), offset by the loss of Biggin Hill.
Following a local government boundary review which came into effect in May 2022,[20][21] the constituency now comprises the following wards of the London Borough of Bromley from the 2024 general election:
- Chelsfield; Darwin (except polling district DAR1); Farnborough and Crofton; Orpington; Petts Wood and Knoll; St Mary Cray; St Paul's Cray.[17]
Members of Parliament
| Election | Member[22] | Party | Notes | |
|---|---|---|---|---|
| 1945 | Waldron Smithers | Conservative | Member for Chislehurst (1924–1945), Died in December 1954 | |
| 1955 by-election | Donald Sumner | Conservative | Seat vacated after Sumner accepted an appointment as a County Court judge | |
| 1962 by-election | Eric Lubbock | Liberal | Liberal Chief Whip (1963–1970) | |
| 1970 | Ivor Stanbrook | Conservative | ||
| 1992 | John Horam | Conservative | Parliamentary Secretary for the Public Service (1995) Under-Secretary of State for Health and Social Security (1995–1997) | |
| 2010 | Jo Johnson | Conservative | Minister of State at the Cabinet Office (2014–2015) Minister of State for Universities, Science, Research and Innovation (2015–2018, 2019) Minister of State for Transport (2018) | |
| 2019 | Gareth Bacon | Conservative | Under-Secretary of State for Sentencing (2023–2024) Shadow Secretary of State for Transport (2024–2025) Shadow Minister for London (2024–) Shadow Minister of State for Housing and Planning (2025–) | |
Elections

Elections in the 2020s
| Party | Candidate | Votes | % | ±% | |
|---|---|---|---|---|---|
| Conservative | Gareth Bacon | 17,504 | 38.0 | −23.9 | |
| Labour | Ju Owens | 12,386 | 26.9 | +7.1 | |
| Reform | Mark James | 8,896 | 19.3 | New | |
| Liberal Democrats | Graeme Casey | 4,728 | 10.3 | −4.3 | |
| Green | Seamus McCauley | 2,319 | 5.0 | +1.3 | |
| SDP | John Bright | 240 | 0.5 | New | |
| Majority | 5,118 | 11.1 | −34.8 | ||
| Turnout | 46,073 | 64.7 | −3.7 | ||
| Registered electors | 71,203 | ||||
| Conservative hold | Swing | −15.5 | |||
Elections in the 2010s
| 2019 notional result[24] | |||
|---|---|---|---|
| Party | Vote | % | |
| Conservative | 30,308 | 61.9 | |
| Labour | 9,681 | 19.8 | |
| Liberal Democrats | 7,145 | 14.6 | |
| Green | 1,824 | 3.7 | |
| Turnout | 48,958 | 68.4 | |
| Electorate | 71,571 | ||
| Party | Candidate | Votes | % | ±% | |
|---|---|---|---|---|---|
| Conservative | Gareth Bacon | 30,882 | 63.4 | +0.5 | |
| Labour | Simon Jeal | 8,504 | 17.5 | −6.9 | |
| Liberal Democrats | Allan Tweddle | 7,552 | 15.5 | +8.9 | |
| Green | Karen Wheller | 1,783 | 3.7 | +1.6 | |
| Majority | 22,378 | 45.9 | +7.4 | ||
| Turnout | 48,721 | 70.7 | −3.6 | ||
| Registered electors | 68,884 | ||||
| Conservative hold | Swing | +3.7 | |||
| Party | Candidate | Votes | % | ±% | |
|---|---|---|---|---|---|
| Conservative | Jo Johnson | 31,762 | 62.9 | +5.5 | |
| Labour | Nigel de Gruchy | 12,309 | 24.4 | +8.8 | |
| Liberal Democrats | Alex Feakes | 3,315 | 6.6 | −0.2 | |
| UKIP | Brian Philp | 2,023 | 4.0 | −12.7 | |
| Green | Tamara Galloway | 1,060 | 2.1 | −1.4 | |
| Majority | 19,453 | 38.5 | −2.2 | ||
| Turnout | 50,469 | 74.3 | +1.7 | ||
| Registered electors | 67,902 | ||||
| Conservative hold | Swing | −1.6 | |||
By numerical vote share, the 2017 general election saw Orpington become the safest Conservative seat in London.
| Party | Candidate | Votes | % | ±% | |
|---|---|---|---|---|---|
| Conservative | Jo Johnson | 28,152 | 57.4 | −2.3 | |
| UKIP | Idham Ramadi[31] | 8,173 | 16.7 | +13.9 | |
| Labour | Nigel de Gruchy | 7,645 | 15.6 | +6.6 | |
| Liberal Democrats | Peter Brooks | 3,330 | 6.8 | −17.7 | |
| Green | Tamara Galloway[32] | 1,732 | 3.5 | +2.5 | |
| Majority | 19,979 | 40.7 | +5.6 | ||
| Turnout | 49,032 | 72.6 | −0.2 | ||
| Registered electors | 68,129 | ||||
| Conservative hold | Swing | −8.1 | |||
| Party | Candidate | Votes | % | ±% | |
|---|---|---|---|---|---|
| Conservative | Jo Johnson | 29,200 | 59.7 | +7.2 | |
| Liberal Democrats | David McBride | 12,000 | 24.5 | −16.1 | |
| Labour | Stephen Morgan | 4,400 | 9.0 | +3.2 | |
| UKIP | Mick Greenhough | 1,360 | 2.8 | +1.6 | |
| BNP | Tess Culnane | 1,241 | 2.5 | New | |
| Green | Tamara Galloway | 511 | 1.0 | New | |
| English Democrat | Chris Snape | 199 | 0.4 | New | |
| Majority | 17,200 | 35.2 | +26.2 | ||
| Turnout | 48,911 | 72.2 | +2.3 | ||
| Registered electors | 67,732 | ||||
| Conservative hold | Swing | +11.7 | |||
Elections in the 2000s
| 2005 notional result | |||
|---|---|---|---|
| Party | Vote | % | |
| Conservative | 24,370 | 52.5 | |
| Liberal Democrats | 18,859 | 40.6 | |
| Labour | 2,674 | 5.8 | |
| UKIP | 559 | 1.2 | |
| Turnout | 46,462 | 69.9 | |
| Electorate | 66,448 | ||
| Party | Candidate | Votes | % | ±% | |
|---|---|---|---|---|---|
| Conservative | John Horam | 26,718 | 48.8 | +4.9 | |
| Liberal Democrats | Chris Maines | 21,771 | 39.8 | −3.6 | |
| Labour | Emily Bird | 4,914 | 9.0 | −1.9 | |
| UKIP | Mick Greenhough | 1,331 | 2.4 | +0.5 | |
| Majority | 4,947 | 9.0 | +8.5 | ||
| Turnout | 54,734 | 70.0 | +5.4 | ||
| Registered electors | 78,240 | ||||
| Conservative hold | Swing | +4.2 | |||
| Party | Candidate | Votes | % | ±% | |
|---|---|---|---|---|---|
| Conservative | John Horam | 22,334 | 43.9 | +3.3 | |
| Liberal Democrats | Chris Maines | 22,065 | 43.3 | +7.7 | |
| Labour | Chris Purnell | 5,517 | 10.8 | −7.0 | |
| UKIP | John Youles | 996 | 2.0 | +1.1 | |
| Majority | 269 | 0.5 | −4.4 | ||
| Turnout | 50,912 | 64.6 | −11.8 | ||
| Registered electors | 78,853 | ||||
| Conservative hold | Swing | −2.2 | |||
Elections in the 1990s
| Party | Candidate | Votes | % | ±% | |
|---|---|---|---|---|---|
| Conservative | John Horam | 24,417 | 40.6 | −14.7 | |
| Liberal Democrats | Chris Maines | 21,465 | 35.7 | +7.4 | |
| Labour | Sue Polydorou | 10,753 | 17.9 | +3.1 | |
| Referendum | David Clark | 2,316 | 3.8 | New | |
| UKIP | James Carver | 526 | 0.9 | New | |
| Liberal | Robin Almond | 494 | 0.8 | −0.3 | |
| ProLife Alliance | Nicholas Wilton | 191 | 0.3 | New | |
| Majority | 2,952 | 4.8 | −22.1 | ||
| Turnout | 60,162 | 76.3 | −4.8 | ||
| Registered electors | 78,831 | ||||
| Conservative hold | Swing | −11.0 | |||
| 1992 notional result | |||
|---|---|---|---|
| Party | Vote | % | |
| Conservative | 36,770 | 55.3 | |
| Liberal Democrats | 18,840 | 28.3 | |
| Labour | 9,837 | 14.8 | |
| Others | 1,085 | 1.6 | |
| Turnout | 66,532 | 81.1 | |
| Electorate | 82,032 | ||
| Party | Candidate | Votes | % | ±% | |
|---|---|---|---|---|---|
| Conservative | John Horam | 27,421 | 57.2 | −1.0 | |
| Liberal Democrats | Chris Maines | 14,486 | 30.2 | −0.8 | |
| Labour | Stephen Cowan | 5,512 | 11.5 | +0.8 | |
| Liberal | Robin Almond | 539 | 1.1 | New | |
| Majority | 12,935 | 27.0 | −0.2 | ||
| Turnout | 47,958 | 83.7 | +5.1 | ||
| Registered electors | 57,318 | ||||
| Conservative hold | Swing | −0.1 | |||
Elections in the 1980s
| Party | Candidate | Votes | % | ±% | |
|---|---|---|---|---|---|
| Conservative | Ivor Stanbrook | 27,261 | 58.2 | +1.0 | |
| Liberal | Jonathan Fryer | 14,529 | 31.0 | −3.5 | |
| Labour | Steven Cowan | 5,020 | 10.7 | +3.0 | |
| Majority | 12,732 | 27.2 | +4.5 | ||
| Turnout | 46,810 | 78.5 | +2.6 | ||
| Registered electors | 59,608 | ||||
| Conservative hold | Swing | +2.2 | |||
| Party | Candidate | Votes | % | ±% | |
|---|---|---|---|---|---|
| Conservative | Ivor Stanbrook | 25,569 | 57.3 | +0.0 | |
| Liberal | John Cook | 15,418 | 34.5 | +5.2 | |
| Labour | David Bean | 3,439 | 7.7 | −4.5 | |
| BNP | L.T. Taylor | 215 | 0.5 | New | |
| Majority | 10,151 | 22.8 | −5.2 | ||
| Turnout | 44,641 | 76.0 | −5.7 | ||
| Registered electors | 58,759 | ||||
| Conservative hold | Swing | −2.6 | |||
Elections in the 1970s
| 1979 notional result[40] | |||
|---|---|---|---|
| Party | Vote | % | |
| Conservative | 26,735 | 57.2 | |
| Liberal | 13,692 | 29.3 | |
| Labour | 5,719 | 12.2 | |
| Others | 558 | 1.2 | |
| Turnout | 46,704 | ||
| Electorate | |||
| Party | Candidate | Votes | % | ±% | |
|---|---|---|---|---|---|
| Conservative | Ivor Stanbrook | 32,150 | 58.0 | +11.0 | |
| Liberal | John Cook[41] | 16,074 | 29.0 | −8.4 | |
| Labour | Anne Weyman[41] | 6,581 | 11.9 | −3.8 | |
| National Front | Frank Hitches[41] | 516 | 0.9 | New | |
| Homeland Party | Ian MacKillian[41] | 146 | 0.3 | New | |
| Majority | 16,076 | 29.0 | +19.3 | ||
| Turnout | 55,467 | 81.7 | +2.7 | ||
| Registered electors | 67,917 | ||||
| Conservative hold | Swing | +9.7 | |||
| Party | Candidate | Votes | % | ±% | |
|---|---|---|---|---|---|
| Conservative | Ivor Stanbrook | 24,394 | 47.0 | −0.2 | |
| Liberal | Kina-Maria Lubbock[42] | 19,384 | 37.3 | −3.3 | |
| Labour | C. Spillane | 8,121 | 15.6 | +3.6 | |
| Majority | 5,010 | 9.7 | +3.1 | ||
| Turnout | 51,899 | 79.0 | −7.1 | ||
| Registered electors | 65,686 | ||||
| Conservative hold | Swing | +1.6 | |||
| Party | Candidate | Votes | % | ±% | |
|---|---|---|---|---|---|
| Conservative | Ivor Stanbrook | 26,435 | 47.2 | −0.1 | |
| Liberal | Robin Young | 22,771 | 40.7 | −4.0 | |
| Labour | David Grant | 6,752 | 12.1 | +4.1 | |
| Majority | 3,664 | 6.6 | +4.0 | ||
| Turnout | 55,598 | 86.1 | +7.0 | ||
| Registered electors | 64,967 | ||||
| Conservative hold | Swing | +2.0 | |||
| 1970 notional result[43] | |||
|---|---|---|---|
| Party | Vote | % | |
| Conservative | 23,900 | 47.3 | |
| Liberal | 22,600 | 44.8 | |
| Labour | 4,000 | 7.9 | |
| Turnout | 50,500 | 78.9 | |
| Electorate | 64,041 | ||
| Party | Candidate | Votes | % | ±% | |
|---|---|---|---|---|---|
| Conservative | Ivor Stanbrook | 24,385 | 47.3 | +4.0 | |
| Liberal | Eric Lubbock | 23,063 | 44.7 | −1.9 | |
| Labour | David Grant | 4,098 | 8.0 | −2.1 | |
| Majority | 1,322 | 2.6 | N/A | ||
| Turnout | 51,546 | 79.1 | −7.8 | ||
| Registered electors | 65,191 | ||||
| Conservative gain from Liberal | Swing | +3.0 | |||
Elections in the 1960s
| Party | Candidate | Votes | % | ±% | |
|---|---|---|---|---|---|
| Liberal | Eric Lubbock | 22,615 | 46.7 | −1.7 | |
| Conservative | Norris McWhirter | 20,993 | 43.3 | +1.5 | |
| Labour | David Sleigh | 4,870 | 10.0 | +0.2 | |
| Majority | 1,622 | 3.4 | −3.2 | ||
| Turnout | 48,478 | 86.9 | +1.6 | ||
| Registered electors | 55,776 | ||||
| Liberal hold | Swing | −1.6 | |||
| Party | Candidate | Votes | % | ±% | |
|---|---|---|---|---|---|
| Liberal | Eric Lubbock | 22,637 | 48.4 | +27.2 | |
| Conservative | Norris McWhirter | 19,565 | 41.8 | −14.8 | |
| Labour | Peter Merriton | 4,609 | 9.8 | −12.4 | |
| Majority | 3,072 | 6.6 | N/A | ||
| Turnout | 46,811 | 85.3 | +2.6 | ||
| Registered electors | 54,846 | ||||
| Liberal gain from Conservative | Swing | +20.1 | |||
| Party | Candidate | Votes | % | ±% | |
|---|---|---|---|---|---|
| Liberal | Eric Lubbock | 22,846 | 52.9 | +31.7 | |
| Conservative | Peter Goldman | 14,991 | 34.7 | −21.9 | |
| Labour | Alan Jinkinson | 5,350 | 12.4 | −9.8 | |
| Majority | 7,855 | 18.2 | N/A | ||
| Turnout | 43,187 | 80.3 | −2.5 | ||
| Registered electors | 53,779 | ||||
| Liberal gain from Conservative | Swing | +26.8 | |||
Elections in the 1950s
| Party | Candidate | Votes | % | ±% | |
|---|---|---|---|---|---|
| Conservative | Donald Sumner | 24,303 | 56.6 | −3.3 | |
| Labour | Norman Hart | 9,543 | 22.2 | −5.4 | |
| Liberal | Jack Galloway | 9,092 | 21.2 | +8.7 | |
| Majority | 14,760 | 34.4 | +2.1 | ||
| Turnout | 42,938 | 82.8 | +3.3 | ||
| Registered electors | 51,872 | ||||
| Conservative hold | Swing | +1.1 | |||
| Party | Candidate | Votes | % | ||
|---|---|---|---|---|---|
| Conservative | Donald Sumner | 22,166 | 59.9 | ||
| Labour | Norman Hart | 10,230 | 27.6 | ||
| Liberal | Alfred Howard | 4,610 | 12.5 | ||
| Majority | 11,936 | 32.3 | |||
| Turnout | 37,006 | 79.4 | |||
| Registered electors | 46,581 | ||||
| Conservative win (new boundaries) | |||||
| Party | Candidate | Votes | % | ±% | |
|---|---|---|---|---|---|
| Conservative | Donald Sumner | 20,082 | 65.8 | +3.2 | |
| Labour | R. David Vaughan Williams | 10,426 | 34.2 | −3.2 | |
| Majority | 9,656 | 31.6 | +6.3 | ||
| Turnout | 30,508 | 55.4 | −26.6 | ||
| Registered electors | 55,069 | ||||
| Conservative hold | Swing | +3.2 | |||
| Party | Candidate | Votes | % | ±% | |
|---|---|---|---|---|---|
| Conservative | Waldron Smithers | 27,244 | 62.7 | +6.0 | |
| Labour | R. David Vaughan Williams | 16,241 | 37.3 | +4.5 | |
| Majority | 11,003 | 25.3 | +1.4 | ||
| Turnout | 43,485 | 82.0 | −3.1 | ||
| Registered electors | 53,023 | ||||
| Conservative hold | Swing | +0.7 | |||
| Party | Candidate | Votes | % | ±% | |
|---|---|---|---|---|---|
| Conservative | Waldron Smithers | 24,450 | 56.7 | +8.0 | |
| Labour | George Vaughan | 14,161 | 32.8 | −5.0 | |
| Liberal | Ruth Abrahams | 4,523 | 10.5 | −1.8 | |
| Majority | 10,289 | 23.9 | +13.0 | ||
| Turnout | 43,134 | 85.1 | +12.4 | ||
| Registered electors | 50,704 | ||||
| Conservative hold | Swing | +6.5 | |||
Elections in the 1940s
| Party | Candidate | Votes | % | |
|---|---|---|---|---|
| Conservative | Waldron Smithers | 20,388 | 48.7 | |
| Labour | Alan Mais | 15,846 | 37.8 | |
| Liberal | Edward Goodfellow | 5,140 | 12.3 | |
| Independent | Guy Milner | 528 | 1.3 | |
| Majority | 4,542 | 10.8 | ||
| Turnout | 41,902 | 72.7 | ||
| Registered electors | 57,625 | |||
| Conservative win (new seat) | ||||
See also
Notes
- ↑ A borough constituency (for the purposes of election expenses and type of returning officer).
- ↑ As with all constituencies, Orpington elects one Member of Parliament (MP) by the first past the post system of election at least every five years.
References
- ↑ "The 2023 Review of Parliamentary Constituency Boundaries in England – Volume two: Constituency names, designations and composition – London". Boundary Commission for England. Retrieved 22 June 2024.
- ↑ "PM's brother quits as MP and minister". BBC. 5 September 2019. Archived from the original on 5 September 2019. Retrieved 5 September 2019.
- ↑ "History of Orpington". ideal-homes.gre.ac.uk. Retrieved 17 July 2026.
- ↑ "Constituency data: Deprivation in England". commonslibrary.parliament.uk. Retrieved 1 July 2026.
- ↑ Timeline of Romani History Archived 2010-06-24 at the Wayback Machine - Patrin
- 1 2 3 4 "Seat Details - Orpington". electoralcalculus.co.uk. Retrieved 1 July 2026.
- ↑ "Constituency data: Population, by age". commonslibrary.parliament.uk. Retrieved 1 July 2026.
- 1 2 "Constituency dashboard". House of Commons Library. Retrieved 1 July 2026.
- ↑ "Constituency data: businesses and industries". commonslibrary.parliament.uk. Retrieved 1 July 2026.
- ↑ "2021 census results: Ethnic groups in your constituency". commonslibrary.parliament.uk. 4 July 2024. Retrieved 1 July 2026.
- ↑ "Conservative Members of Parliament 2015". UK Political.info. Archived from the original on 8 June 2017. Retrieved 12 February 2017.
- ↑ On This Day - "1962: Liberals seize Orpington" BBC News
- ↑ "The House of Commons (Redistribution of Seats) Order 1945. SR&O 1945/701". Statutory Rules and Orders 1945. Vol. I. London: His Majesty's Stationery Office. 1946. pp. 682–698.
- ↑ "Representation of the People Act 1948: Schedule 1", legislation.gov.uk, The National Archives, 1948 c. 65 (sch. 1), retrieved 23 July 2023
- ↑ "The Parliamentary Constituencies (North Kent) Order 1955. SI 1955/13". Statutory Instruments 1955. Part II. London: Her Majesty's Stationery Office. 1956. pp. 2155–2156.
- ↑ "The Parliamentary Constituencies (London Borough of Bromley) Order 1971. SI 1971/2112". Statutory Instruments 1971. Part III Section 2. London: Her Majesty's Stationery Office. 1972. pp. 6228–6230.
- 1 2 "New Seat Details - Orpington". www.electoralcalculus.co.uk. Retrieved 28 March 2024.
- ↑ "The Parliamentary Constituencies Order 2023". Schedule 1 Part 3 London region.
- ↑ "The 2023 Review of Parliamentary Constituency Boundaries in England – Volume three: Maps | Boundary Commission for England | Page 4". boundarycommissionforengland.independent.gov.uk. Map 164. Retrieved 28 December 2023.
- ↑ LGBCE. "Bromley | LGBCE". www.lgbce.org.uk. Retrieved 28 March 2024.
- ↑ "The London Borough of Bromley (Electoral Changes) Order 2021".
- ↑ Leigh Rayment's Historical List of MPs – Constituencies beginning with "O"
- ↑ "Orpington Constituency". Sky News. 5 July 2024.
- ↑ "Notional results for a UK general election on 12 December 2019". Rallings & Thrasher, Professor David Denver (Scotland), Nicholas Whyte (NI) for Sky News, PA, BBC News and ITV News. UK Parliament. Retrieved 11 July 2024.
- ↑ "Statement of Persons Nominated General Election 2019 - Orpington constituency". London Borough of Bromley. Retrieved 19 November 2019.
- ↑ "Commons Briefing Paper 8749. General Election 2019: results and analysis" (PDF). London: House of Commons Library. 28 January 2020. Archived (PDF) from the original on 18 November 2021. Retrieved 19 January 2022.
- ↑ "Orpington parliamentary constituency". BBC News. Archived from the original on 10 June 2017. Retrieved 22 June 2018.
- ↑ "Commons Briefing Paper 7979. General Election 2017: results and analysis" (PDF) (Second ed.). House of Commons Library. 29 January 2019 [7 April 2018]. Archived (PDF) from the original on 12 November 2019.
- ↑ "Election Data 2015". Electoral Calculus. Archived from the original on 17 October 2015. Retrieved 17 October 2015.
- ↑ Bromley, London Borough of. "Orpington Constituency result of poll May 2015 - London Borough of Bromley". www.bromley.gov.uk. Archived from the original on 23 September 2015. Retrieved 22 August 2015.
- ↑ "Tweets with replies by Idham Ramadi (@idhamramadi) - Twitter". twitter.com. Archived from the original on 7 June 2019. Retrieved 2 December 2017.
- ↑ london.greenparty.org.uk/elections/2015-general-election.html
- ↑ "Election Data 2010". Electoral Calculus. Archived from the original on 26 July 2013. Retrieved 17 October 2015.
- ↑ "Election Data 2005". Electoral Calculus. Archived from the original on 15 October 2011. Retrieved 18 October 2015.
- ↑ "Election Data 2001". Electoral Calculus. Archived from the original on 15 October 2011. Retrieved 18 October 2015.
- ↑ "Election Data 1997". Electoral Calculus. Archived from the original on 15 October 2011. Retrieved 18 October 2015.
- ↑ "Election Data 1992". Electoral Calculus. Archived from the original on 15 October 2011. Retrieved 18 October 2015.
- ↑ "Election Data 1987". Electoral Calculus. Archived from the original on 15 October 2011. Retrieved 18 October 2015.
- ↑ "Election Data 1983". Electoral Calculus. Archived from the original on 15 October 2011. Retrieved 18 October 2015.
- ↑ "BBC/ITN NOTIONAL ELECTION 1979". election.demon.co.uk. BBC/ITN. Archived from the original on 28 May 2004. Retrieved 7 March 2025.
- 1 2 3 4 Election Expenses. Parliament of the United Kingdom. 1980. p. 10. ISBN 0102374805.
- ↑ "LIBERAL/LIBERAL DEMOCRAT CANDIDATES in the GREATER LONDON REGION 1945-2019" (PDF). liberalhistory.org.uk. Liberal Democrat History Group. pp. 6–98. Retrieved 29 April 2025.
- ↑ Michael Stead. "1970 notional general election & February 1974 general election". BBC. Retrieved 18 March 2025.
- 1 2 3 4 5 6 7 8 9 Craig, Fred W. S (1983). British parliamentary election results, 1950-1973 (2nd ed.). Parliamentary Research Services. ISBN 0900178078. Retrieved 5 April 2025.
- ↑ "1962 By Election Results". Archived from the original on 5 February 2012. Retrieved 15 August 2015.
- ↑ "1955 By Elections - part 1". 31 August 2009. Archived from the original on 31 August 2009. Retrieved 28 June 2022.
{{cite web}}: CS1 maint: bot: original URL status unknown (link) - ↑ Craig, Fred W. S (1969). British parliamentary election results, 1918-1949. Political Reference Publications. ISBN 0900178019. Retrieved 5 April 2025.
External links
- Politics Resources (Election results from 1922 onwards)
- Electoral Calculus (Election results from 1955 onwards)
- UK Constituency Maps
- BBC Vote 2001 Includes 1997 and 2001 results
- BBC Election 2005
- Political Science Resources Archived 2 July 2009 at the Wayback Machine
- Orpington UK Parliament constituency (boundaries April 1997 – April 2010) at MapIt UK
- Orpington UK Parliament constituency (boundaries April 2010 – May 2024) at MapIt UK
- Orpington UK Parliament constituency (boundaries from June 2024) at MapIt UK