Demographics of Paraguay
| Demographics of Paraguay | |
|---|---|
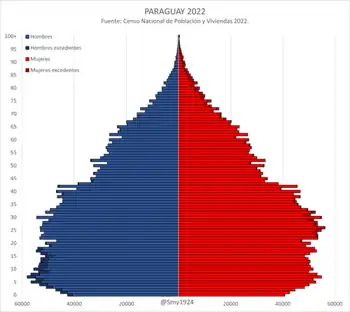 Population pyramid of Paraguay in 2022 | |
| Population | 6,460,159 (2026)[1] |
| Growth rate | 0.67% (2026)[1] |
| Birth rate | 15.1 births/1,000 population (2026) |
| Death rate | 6.3 deaths/1,000 population (2026) |
| Life expectancy | 75.8 years |
| Fertility rate | 1.90 children born/woman (2026)[1] |
| Infant mortality | 13.7 deaths/1,000 live births |
| Net migration rate | -2.2 migrant(s)/1,000 population (2026) |
| Immigrant share | 2.6% (2024)[2] |
| Age structure | |
| 0–14 years | 24.66% |
| 15–64 years | 66.48% |
| 65 and over | 8.86% |
| Nationality | |
| Nationality | Paraguayan |
| Major ethnic |
|
| Minor ethnic | |
| Language | |
| Official | Spanish and Guarani |
| Spoken | Languages of Paraguay |
Paraguay's population is distributed unevenly through the country. The vast majority of the people live in the eastern region, most within 160 kilometres (99 mi) of Asunción, the capital and largest city, which borders on Argentina to the south and west. The Gran Chaco in the north-west, which accounts for about 60% of Paraguayan territory, is home to less than 4% of the population.
Ethnically, culturally, and socially, Paraguay has one of the most homogeneous populations in South America. About 75% of the people are mestizo (mixed Spanish and Guaraní Native American descent), 20% are Whites, and the rest are small minorities of Indigenous or Afro Paraguayan origin.[3] Little trace is left of the original Guaraní culture except the language, which is spoken by 90% of the population. About 75% of all Paraguayans also speak Spanish. Guaraní and Spanish are official languages.
Paraguay has a history of foreign settlement, especially in the 20th century: Italians (around 40% of the total Paraguayan population is of full or partial Italian descent);[6][7][8] Germans (the majority are Mennonites) with long-time Paraguayan dictator Alfredo Stroessner (President, 1954–1989) himself of German ancestry; Japanese with Okinawans; Koreans; Chinese; Arabs, Ukrainians; Poles; Southern Europeans; Jews; Brazilians; and Argentines are among those who have settled in Paraguay. There are also an estimated 234,000 Afro-Paraguayans, or 4% of the population.[9]
European and Middle Eastern immigrants began making their way to Paraguay in the decades following the Paraguayan War of 1864–1870 (from 1870 onward). Only 28,000 men and 200,000 women had survived the war, the reason why Paraguay had since then a high rate of illegitimate births. The government pursued a pro-immigration policy in an effort to increase population. Government records indicated that approximately 12,000 immigrants entered the port of Asunción between 1882 and 1907, of whom almost 9,000 came from Italy, Germany, France, and Spain. Migrants also arrived from neighboring Spanish American countries, especially Argentina. The immigrant ethnic groups kept their cultures and languages to some extent, especially Brazilians – known as "Brasiguayos".[10][11]
Official records gave an imprecise sense of the number of Brazilians who came to the country. According to the 1982 census, 99,000 Brazilians resided in Paraguay. Most analysts discounted this figure, however, and contended that between 300,000 and 350,000 Brazilians lived in the eastern border region.
Analysts also rejected government figures on the number of immigrants from South Korea, Hong Kong and Taiwan. The 1982 census reported that there were 2,700 Koreans in Paraguay, along with another 1,100 non-Japanese or non-Korean Asian immigrants. Virtually all Koreans and Chinese lived in Ciudad del Este or Asunción and played a major role in the importation and sale of electronic goods manufactured in Asia.
Paraguay became the site of radical and progressive colonies inspired by political thinkers of the late 19th and early 20th centuries. A group of radical socialist Australians in the 1890s voluntarily went to create a failed master-planned community, known as Nueva (New) Australia (1893 -1897); and Elisabeth Nietzsche, a German racial ideologist and sister of philosopher Friedrich Nietzsche came to Paraguay in her attempt to build a colony, Nueva Germania (Neues Deutschland) (founded 1886) devoted to a hypothetical pure white "Nordic" society.
A 2022 census found that Paraguay's population shrank as a production of migration and having smaller families, as well as better data integrity, resulting in a loss of over one million.[12]
Population size and structure
| Year | Pop. | ±% p.a. |
|---|---|---|
| 1950 | 1,328,452 | — |
| 1962 | 1,819,103 | +2.65% |
| 1972 | 2,357,955 | +2.63% |
| 1982 | 3,029,830 | +2.54% |
| 1992 | 4,152,588 | +3.20% |
| 2002 | 5,163,198 | +2.20% |
| 2012 | 5,756,397 | +1.09% |
| 2022 | 6,284,020 | +0.88% |
| 2026 | 6,460,159 | +0.69% |
| Source:[13][14] | ||


According to the National Institute of Statistics of Paraguay, based on the 2022 census, the total population was 6,460,159 in 2026, compared to only 1,473,000 in 1950. The proportion of children below the age of 15 in 2025 was 25%, 66.4% was between 15 and 64 years of age, while 8.6% was 65 years or older.[15]
| Year | Total population ( × 1000) |
Population percentage in age bracket | ||
|---|---|---|---|---|
| 0–14 | 15–64 | 65+ | ||
| 1950 | 1 473 | |||
| 1955 | 1 674 | |||
| 1960 | 1 906 | |||
| 1965 | 2 176 | |||
| 1970 | 2 483 | |||
| 1975 | 2 802 | |||
| 1980 | 3 195 | |||
| 1985 | 3 698 | |||
| 1990 | 4 244 | |||
| 1995 | 4 795 | |||
| 2000 | 5 155 | |||
| 2005 | 5 467 | |||
| 2010 | 5 668 | |||
| 2015 | 5 912 | |||
| 2020 | 6 202 | |||
| 2025 | 6 417 | |||
| 2030 | 6 618 | |||
Vital statistics
Registered births and deaths
Births and deaths according to the National Institute of Statistics of Paraguay, based on the 2022 census.[16]
| Year | Population | Live births | Deaths | Natural increase | Crude birth rate | Crude death rate | Rate of natural increase | Annual migration | Total increase | Total fertility rate |
|---|---|---|---|---|---|---|---|---|---|---|
| 2006 | 5,511,383 | 119,776 | 31,293 | 88,483 | 21.7 | 5.7 | 16.0 | -46,796 | 41,687 | 2.84 |
| 2007 | 5,551,108 | 117,679 | 31,698 | 85,981 | 21.2 | 5.7 | 15.5 | -48,210 | 37,771 | 2.75 |
| 2008 | 5,588,470 | 115,997 | 32,124 | 83,873 | 20.8 | 5.7 | 15.1 | -46,913 | 36,960 | 2.67 |
| 2009 | 5,627,047 | 114,895 | 32,574 | 82,321 | 20.4 | 5.8 | 14.6 | -42,118 | 40,203 | 2.60 |
| 2010 | 5,668,042 | 114,460 | 33,062 | 81,398 | 20.2 | 5.8 | 14.4 | -39,613 | 41,785 | 2.55 |
| 2011 | 5,710,913 | 114,693 | 33,582 | 81,111 | 20.1 | 5.9 | 14.2 | -37,109 | 44,002 | 2.52 |
| 2012 | 5,756,397 | 115,689 | 34,134 | 81,555 | 20.1 | 5.9 | 14.2 | -34,605 | 46,950 | 2.50 |
| 2013 | 5,805,006 | 117,095 | 34,708 | 82,387 | 20.2 | 6.0 | 14.2 | -32,101 | 50,286 | 2.50 |
| 2014 | 5,856,972 | 118,638 | 35,354 | 83,284 | 20.3 | 6.0 | 14.3 | -29,597 | 53,687 | 2.50 |
| 2015 | 5,912,082 | 119,627 | 36,009 | 83,618 | 20.2 | 6.1 | 14.1 | -27,093 | 56,525 | 2.50 |
| 2016 | 5,969,497 | 119,508 | 36,657 | 82,851 | 20.0 | 6.1 | 13.9 | -24,589 | 58,262 | 2.47 |
| 2017 | 6,028,083 | 118,278 | 37,276 | 81,002 | 19.6 | 6.2 | 13.4 | -22,084 | 58,918 | 2.43 |
| 2018 | 6,086,887 | 116,073 | 37,840 | 78,233 | 19.1 | 6.2 | 12.9 | -19,580 | 58,653 | 2.36 |
| 2019 | 6,144,832 | 113,041 | 38,690 | 74,351 | 18.4 | 6.3 | 12.1 | -17,076 | 57,275 | 2.28 |
| 2020 | 6,202,478 | 109,451 | 43,179 | 66,272 | 17.6 | 7.0 | 10.6 | -8,226 | 58,046 | 2.19 |
| 2021 | 6,247,916 | 105,422 | 64,274 | 41,148 | 16.9 | 10.3 | 6.6 | -8,226 | 32,922 | 2.10 |
| 2022 | 6,284,020 | 100,984 | 45,995 | 54,989 | 16.1 | 7.3 | 8.8 | -15,555 | 39,434 | 2.00 |
| 2023 | 6,326,825 | 100,271 | 38,567 | 61,704 | 15.8 | 6.1 | 9.7 | -15,269 | 46,435 | 1.97 |
| 2024 | 6,372,623 | 99,346 | 39,225 | 60,121 | 15.6 | 6.2 | 9.4 | -14,995 | 45,126 | 1.95 |
| 2025 | 6,417,076 | 98,388 | 39,904 | 58,484 | 15.3 | 6.2 | 9.1 | -14,712 | 43,772 | 1.92 |
| 2026 | 6,460,159 | |||||||||
Fertility
Total Fertility Rate (Wanted Fertility Rate):[1]
| Year | TFR (Total) |
|---|---|
| 1990 | 4.6 |
| 1995 | 4.0 |
| 2000 | 3.57 |
| 2005 | 2.94 |
| 2010 | 2.55 |
| 2015 | 2.50 |
| 2020 | 2.19 |
| 2025 | 1.92 |
| 2030 | 1.84 |
| 2035 | 1.79 |
| 2040 | 1.75 |
| 2045 | 1.73 |
| 2050 | 1.72 |
Ethnic groups
 Indigenous population, 2022 census; TFR: 3.77
The Paraguay's predominant ancestry is European, which represents a large part of the population, mainly descendants of Spaniards and Italians (who have contributed to repopulating the country after the Triple Alliance War) but there are also a large number of people of German ancestry, due to the German Mennonites (majority in the western part of the territory). There are 17 Mennonite colonies, only in the Paraguayan Chaco. It is one of the Latin American countries with the least indigenous traits (due to the fact that the traditional Paraguayan population; the Spanish mixture of Guaraní, had been annihilated by the war in 1870, which is why the country had to repopulate by resorting to immigration, especially the Italian in that country.) Taking into account the high fertility, Paraguay registers a majority young population structure. Of every ten people, four are under the age of 15 (2,339,000) and the population aged 15 to 29 represents a quarter of the total population. According to the Census (ECLAC, 1998), the population of indigenous nature that year was 29,482 people, that is, about 0.7% of the national population. There is a low percentage of people with distinctively Amerindian features and the absence of people with African features. The majority of the population is made up of mestizos who are descendants of the original population, the Guarani, and Europeans.
— Paraguay Embassy in Germany[17]
Religion
Languages
 German speakers, 2022 census; TFR: 1,66.
References
- 1 2 3 4 "Paraguay: Estimated population, 2000–2035". INE Paraguay (in Spanish). 3 January 2025.
- ↑ "International Migrant Stock". United Nations Population Division. Retrieved 12 June 2026.
- 1 2 3 Francisco Lizcano Fernández (2005). "Composición Étnica de las Tres Áreas Culturales del Continente Americano al Comienzo del Siglo XXI" [Ethnic Composition of the Three Cultural Areas of the American Continent at the Beginning of the 21st Century]. Convergencia. Revista de Ciencias Sociales (in Spanish). 12 (38): 185–232.
- ↑ "Censo Indígena 2022 – INE" (PDF). Instituto Nacional de Estadística – Paraguay. Retrieved 9 September 2023.
- ↑ "Editorial".
- ↑ "Italianos en el Paraguay elegirán representantes" (in Spanish). 1 December 2014. Archived from the original on 31 March 2019. Retrieved 17 December 2018.
- ↑ "Los italianos y su aporte a la nación – Articulos – ABC Color".
- ↑ "Ya se puede sacar la nacionalidad italiana" (in Spanish). Retrieved 29 May 2020.
- ↑ "Afro-Latino: A deeply rooted identity among U.S. Hispanics". March 2016.
- ↑ Hilton, Ronald (15 June 2001). "BRAZIL: Brazilians in Paraguay". Retrieved 19 January 2017.
- ↑ "Culture of Paraguay – history, people, clothing, traditions, women, beliefs, food, customs, family". www.everyculture.com. Retrieved 19 January 2017.
- ↑ "Over a million Paraguayans disappear in the latest census". The Americas. The Economist. 6 October 2023. Retrieved 15 November 2023.
- ↑ "Evolución de la Población Total". DGEEC. Retrieved 27 July 2017.
- ↑ "The 2012 census was declared "unvalid" by the National Institute of Statistics". ABC en el Este. Retrieved 15 January 2025.
- ↑ "Estimaciones y Proyecciones Departamentales, 2000-2035". Instituto Nacional de Estadística de Paraguay. Retrieved 5 July 2026.
- ↑ "Estimaciones y Proyecciones Departamentales, 2000-2035". Instituto Nacional de Estadística de Paraguay. Retrieved 5 July 2026.
- ↑ "Paraguay population's ethnicity & data".
External links
- (in Spanish) Official website – Instituto Nacional de Estadística e Informática
