Crime in Chicago
| Chicago | |
|---|---|
| Crime rates* (2024) | |
| Violent crimes | |
| Homicide | 21.1 |
| Rape | 76.0 |
| Robbery | 336.4 |
| Aggravated assault | 240.0 |
| Total violent crime | 673.5 |
| Property crimes | |
| Burglary | 282.2 |
| Larceny-theft | 748.1 |
| Motor vehicle theft | 801.6 |
Note: Reported crimes per 100,000 population Source: Chicago Crime statistics (2024) | |
Crime in Chicago has been tracked by the Chicago Police Department's Bureau of Records since the beginning of the 20th century.
The city's overall crime rate, especially the violent crime rate, is higher than the US average.[1] Gangs in Chicago have a role in the city's crime rate.[2][3][4][5] Chicago gangs prefer to do business with Indiana gun stores because Indiana has significantly weaker laws than Illinois.[6][7][8]
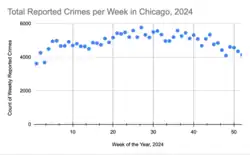
The number of homicides in Chicago hit a 25-year high in 2021,[9] but reached a five year low in 2024 with a continued downward trend into 2025.[10][11]
Overview
Chicago saw a major rise in violent crime starting in the late 1960s. Homicides in the city peaked in 1974, with 970 homicides when the city's population was over three million, resulting in a homicide rate of around 29 per 100,000, and again in 1992, with 948 homicides when the city had fewer than three million people, resulting in a homicide rate of 34 per 100,000 citizens.
After 1992, the homicide count steadily decreased to 415 murders by the mid-2000s, a reduction of over 50 percent. In 2021, there were 805 homicides recorded, representing a homicide rate of 29.8 per 100,000. The year of 2022 saw a decline in homicides, followed by another 15% decline in 2023, ending the year with a total of 621.[12]
Violent crime
Chicago experienced major rises in the 1920s, in the late 1960s, and in the 2020s, [13] a decline in overall crime in the 2000s,[14] and then a rise in murders in 2016.[15] Murder, rape, and robbery are the most common violent crimes in the city, and occurrences of such incidents are documented by the Chicago Police Department and indexed in annual crime reports.[16]
Violent Crime Totals 2010-Present
| Year[17] | Homicide | Shooting | Criminal Sexual Assault | Robbery | Vehicular Hijacking | Aggravated Battery | Aggravated Assault | All Violent Crime |
|---|---|---|---|---|---|---|---|---|
| 2025 |  417 |
1,871 |
 2,011 |
6,099 |
571 |
6,679 |
8,018 |
25,287 |
| 2024 | 587 |
2,853 |
2,000 |
9,489 |
1,148 |
7,319 |
9,906 |
32,709 |
| 2023 | 623 |
2,991 |
2,065 |
11,874 |
1,540 |
6,972 |
9,801 |
35,207 |
| 2022 | 719 |
3,533 |
2,061 |
8,486 |
1,937 |
5,935 |
9,085 |
31,024 |
| 2021 | 805 |
4,457 |
1,939 |
6,871 |
2,151 |
6,217 |
8,983 |
30,555 |
| 2020 | 781 |
4,090 |
1,671 |
7,071 |
1,684 |
6,484 |
7,768 |
28,729 |
| 2019 | 500 |
2,639 |
2,076 |
8,138 |
736 |
6,859 |
7,149 |
27,574 |
| 2018 | 579 |
2,876 |
2,170 |
9,855 |
910 |
6,556 |
7,342 |
29,718 |
| 2017 | 661 |
3,384 |
2,106 |
12,251 |
1,150 |
6,314 |
7,104 |
32,226 |
| 2016 | 778 |
4,271 |
1,954 |
12,616 |
809 |
5,916 |
7,065 |
32,556 |
| 2015 | 494 |
2,922 |
1,822 |
10,415 |
412 |
5,710 |
5,577 |
26,822 |
| 2014 |  425 |
2,558 |
1,718 |
10,620 |
379 |
5,517 |
5,369 |
26,100 |
| 2013 | 425 |
2,263 |
1,652 |
12,829 |
429 |
5,656 |
5,164 |
27,943 |
| 2012 | 512 |
2,955 |
1,776 |
14,670 |
603 |
6,617 |
5,896 |
32,423 |
| 2011 | 441 |
2,670 |
1,821 |
15,085 |
694 |
7,638 |
6,380 |
34,207 |
| 2010 | 439 |
2,799 |
1,727 |
15,491 |
687 |
8,599 |
6,484 |
35,717 |
After adopting crime-fighting techniques in 2004 that were recommended by the Los Angeles Police Department and the New York City Police Department, Chicago recorded 453 homicides, the lowest total since 1965. This homicide rate of 15.8 per 100,000 population was still above the U.S. average, an average which takes in many small towns and suburbs.[18]
By 2010, Chicago's homicide rate had surpassed that of Los Angeles (16.3 per 100,000), and was more than twice that of New York City (7.0 per 100,000).[19] By the end of 2015, Chicago's homicide rate rose to 18.6 per 100,000. By 2016, Chicago had recorded more homicides and shooting victims than New York City and Los Angeles combined.[20] By the end of 2020, Chicago's homicide rate rose to 28.4 per 100,000. Chicago recorded 779 homicides in 2020. This figure represents an increase of more than 55% over 2019. On the Fourth of July weekend 2021, at least 100 people, mostly African-American, were shot, 18 of them fatally.[21]
Chicago's biggest criminal justice challenges have changed little over the last 50 years, and statistically reside with homicide, armed robbery, gang violence, and aggravated battery.
Murder and shootings 1991-Present
| Year | Chicago population (millions) |
Murders / Homicides (count) |
Murder / Homicide rate (per 100,000 population) |
Reported murder clearance rate (%) |
Total Shootings (count) | Non-fatal Shootings (count) |
|---|---|---|---|---|---|---|
| 2025 | 2.721 | 416 |
15.3 |
|||
| 2024 | 2.721 | 586 |
21.5 |
56%[26] | 2,853 |
2,336 |
| 2023 | 2.699 | 623 |
23.1 |
52% [16] | 2,991 |
2,430 |
| 2022 | 2.684 | 719 |
26.8 |
50% [16] | 3,533 |
2,887 |
| 2021 | 2.706 | 805 |
29.7 |
50% [27] | 4,457 |
3,707 |
| 2020 | 2.746 | 781 |
28.4 |
45.8% [28] | 4,090 |
3,390 |
| 2019 | 2.694 | 500 |
18.6 |
53.4% | 2,639 |
2,193 |
| 2018 | 2.701 | 579 |
21.4 |
45.1% [29] | 2,876 |
2,395 |
| 2017 | 2.711 | 661 |
24.4 |
34.8% [30] | 3,384 |
2,780 |
| 2016 | 2.717 | 778 |
28.6 |
20.1% [31] | 4,271 |
3,576 |
| 2015 | 2.724 | 494 |
18.1 |
26% [32] | 2,922 |
2,489 |
| 2014 | 2.727 | 425 |
15.6 |
2,558 |
2,193 | |
| 2013 | 2.726 | 425 |
15.6 |
2,263 |
1,910 | |
| 2012 | 2.719 | 512 |
18.8 |
2,955 |
2,515 | |
| 2011 | 2.708 | 441 |
16.3 |
34% | 2,670 |
2,300 |
| 2010 | 2.696 | 439 |
16.3 |
33.9% [33] | 2,799 | 2,445 |
| 2009 | 2.851 | 461 |
16.2 |
34.7% | ||
| 2008 | 2.830 | 517 |
18.3 |
|||
| 2007 | 2.811 | 448 |
15.9 |
|||
| 2006 | 2.806 | 474 |
16.9 |
|||
| 2005 | 2.825 | 446 |
15.8 |
|||
| 2004 | 2.849 | 453 |
15.9 |
|||
| 2003 | 2.866 | 603 |
21.0 |
|||
| 2002 | 2.881 | 652 |
22.6 |
|||
| 2001 | 2.895 | 671 |
23.2 |
|||
| 2000 | 2.896 | 636 |
22.0 |
|||
| 1999 | 2.799 | 640 |
22.9 |
|||
| 1998 | 2.803 | 709 |
25.3 |
|||
| 1997 | 2.808 | 758 |
27.0 |
|||
| 1996 | 2.814 | 798 |
28.4 |
|||
| 1995 | 2.801 | 821 |
29.3 |
|||
| 1994 | 2.797 | 932 |
33.3 |
|||
| 1993 | 2.794 | 867 |
31.0 |
|||
| 1992 | 2.792 | 948 |
34.0 |
|||
| 1991 | 2.790 | 930 |
33.3 |
|||
Homicide statistics | |||||||||||||||||||||||||||||||||||
|---|---|---|---|---|---|---|---|---|---|---|---|---|---|---|---|---|---|---|---|---|---|---|---|---|---|---|---|---|---|---|---|---|---|---|---|
|
Former Chicago Police Superintendent Garry McCarthy said a pervasive "no-snitch code" on the street remains the biggest reason more murders aren't being solved in Chicago, adding, "We're not doing well because we're not getting cooperation [...] They don't feel protected when they come forward. They feel that police will throw them under a bus, and they still have to live in the neighborhood."[63] By 2016, Chicago's murder clearance rate had dropped to only 21%, and its detective force had dwindled from 1,151 in 2009 to 863 as of July 2016.[64] Warmer months have significantly higher homicide rates, and over 70% of homicides take place between 7 pm and 5 am.[65]

In 2011, 83% of homicides involved a firearm, and 6.4% were the result of a stabbing. 10% of homicides in 2011 were the result of an armed robbery and at least 60% were gang or gang narcotics altercations. Over 40% of victims and 60% of offenders were between the ages of 17 and 25. 90.1% of victims were male. 75.3% of victims and 70.5% of offenders were African American, 18.9% were Hispanic (20.3% of offenders), and whites were 5.6% of victims (3.5% of offenders).[65]
Chicago Police Superintendent Garry McCarthy was terminated by Rahm Emanuel following the fall out from the shooting of Laquan McDonald.[66]

A gunshot wound to the body's center of mass can quickly prove fatal without immediate medical attention due to blood loss and internal injuries.[67] In September 2015, University of Chicago Medicine and Sinai Health Systems announced a joint $40 million venture to convert Holy Cross Hospital into a Level 1 trauma center on the South side, making some of Chicago's most violent neighborhoods less than five miles from high-quality care.[68] Non-fatal gunshot victims in Chicago had an overall rate of occurrence of 46.5 per 100,000 from 2006 to 2012, with a demographic breakdown of 1.62 per 100,000 for whites; 28.72 for Hispanics, and 112.83 for blacks.[69] It was estimated in 2013 that the medical expenses associated with gun violence costs the city of Chicago $2.5 billion a year.[70][71]
August 2016 marked the most violent month Chicago had recorded in over two decades with 92 homicides, included the murder of Nykea Aldridge, cousin of NBA star Dwyane Wade.[20][72] Chicago's 2016 murder and shooting surge attracted national media attention from CNN, The New York Times, USA Today, Time magazine and PBS.[73][74][75][76][77] Filmmaker Spike Lee's 2015 release, Chi-Raq, highlights Chicago's gun violence using a narrative inspired by the Greek comedy Lysistrata.[78]
Chicago's deadliest day since reliable digital records began in 1991 was on May 31, 2020, with 18 murders committed. That day was part of a three-day weekend that had 85 shootings, and 24 murders, the all-time highest number killed on a Chicago weekend.[79] Reports indicated that the victims were of various ages and occupations, but mostly Black. The violence was framed by the George Floyd protests, but researchers said it was unheard of and unable to be contextualized. The city's second-deadliest day had 13 murders, and occurred in 1991 shortly after digital records were introduced. There is no deadlier day recorded in the past 60 years, but records prior to 1991 may be unreliable.[80]
Crime rates by community area
The seventy-seven Chicago community areas were defined cooperatively by the U.S. Census Bureau and the University of Chicago Department of Sociology following the 1920 Census. Although there have been substantial changes in population and infrastructure since then, the community areas remain the most widely used geographic units by Chicago planning agencies, advocacy groups, and service providers.
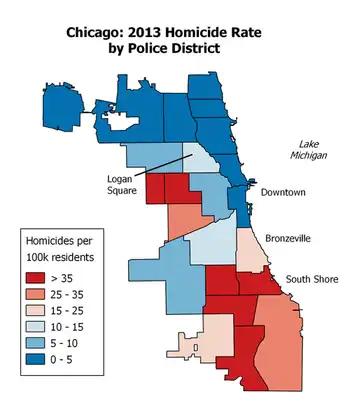
Homicide rates in Chicago vary greatly depending on the community area. Many of the predominantly African American community areas on the South Side are impoverished, lack educational resources, and are noted for high levels of street gang activity.[81] The community areas of Englewood on the South Side, and Austin on the West side, for example, have homicide rates that are ten times higher than other parts of the city.[82] In September 2015, West Garfield Park was named "America's mass shooting capital", citing 18 occasions in 2015 in which at least four people were shot in a single incident.[83]
Violence in these community areas has had a detrimental impact on the academic performance of children in schools, as well as a higher financial burden for school districts in need of counselors, social workers, and psychiatrists to help children cope with the violence.[84] In 2014, Chicago Public Schools adopted the "Safe Passage Route" program to place unarmed volunteers, police officers and firefighters along designated walking routes to provide security for children en route to school.[85] From 2010 to 2014, 114 school children were murdered in Chicago.[86]
The table below shows population, crime totals and per capita crime rates by community area for 2020, the most recent Census year.
General crime rates by community area
| No. | Name | Crimes[87] | Population[88] | Per Capita | Change 24-25 | %Change |
|---|---|---|---|---|---|---|
| 01 | Rogers Park | 1,709 | 54,173 | .0315 | 391 | 19% |
| 02 | West Ridge | 1,488 | 78,373 | .0190 | 217 | 13% |
| 03 | Uptown | 1,998 | 56,344 | .0355 | 287 | 13% |
| 04 | Lincoln Square | 909 | 41,651 | .0218 | 67 | 7% |
| 05 | North Center | 587 | 36,014 | .0163 | 133 | 18% |
| 06 | Lake View | 3,416 | 102,827 | .0332 | 540 | 14% |
| 07 | Lincoln Park | 2,364 | 67,987 | .0348 | 450 | 16% |
| 08 | Near North Side | 5,990 | 107,331 | .0559 | 44 | 1% |
| 09 | Edison Park | 98 | 11,558 | .0085 | 10 | 9% |
| 10 | Norwood Park | 465 | 39,840 | .0117 | 76 | 14% |
| 11 | Jefferson Park | 302 | 26,649 | .0113 | 138 | 31% |
| 12 | Forest Glen | 188 | 19,901 | .0094 | 61 | 24% |
| 13 | North Park | 506 | 18,356 | .0276 | 6 | 1% |
| 14 | Albany Park | 932 | 45,538 | .0205 | 175 | 16% |
| 15 | Portage Park | 1,363 | 63,031 | .0216 | 120 | 8% |
| 16 | Irving Park | 968 | 53,332 | .0182 | 297 | 23% |
| 17 | Dunning | 523 | 41,233 | .0127 | 137 | 21% |
| 18 | Montclare | 304 | 14,280 | .0213 | 17 | 6% |
| 19 | Belmont Cragin | 1,719 | 72,088 | .0238 | 328 | 16% |
| 20 | Hermosa | 459 | 22,576 | .0203 | 158 | 26% |
| 21 | Avondale | 1,193 | 35,533 | .0336 | 148 | 11% |
| 22 | Logan Square | 2,513 | 71,192 | .0353 | 789 | 24% |
| 23 | Humboldt Park | 2,072 | 56,153 | .0369 | 491 | 19% |
| 24 | West Town | 3,946 | 88,164 | .0448 | 858 | 18% |
| 25 | Austin | 4,685 | 97,452 | .0481 | 626 | 12% |
| 26 | West Garfield Park | 1,142 | 15,096 | .0756 | 124 | 10% |
| 27 | East Garfield Park | 1,286 | 20,731 | .0620 | 205 | 14% |
| 28 | Near West Side | 5,181 | 68,165 | .0760 | 524 | 9% |
| 29 | North Lawndale | 1,947 | 33,958 | .0573 | 533 | 21% |
| 30 | South Lawndale | 1,338 | 69,884 | .0191 | 387 | 22% |
| 31 | Lower West Side | 1,185 | 33,446 | .0354 | 258 | 18% |
| 32 | Loop (The) | 4,458 | 42,550 | .1048 | 465 | 9% |
| 33 | Near South Side | 992 | 30,482 | .0325 | 213 | 18% |
| 34 | Armour Square | 564 | 13,885 | .0406 | 10 | 2% |
| 35 | Douglas | 1,346 | 21,088 | .0638 | 47 | 4% |
| 36 | Oakland | 349 | 6,937 | .0503 | 46 | 12% |
| 37 | Fuller Park | 318 | 2,345 | .1356 | 8 | 3% |
| 38 | Grand Boulevard | 1,459 | 25,181 | .0579 | 314 | 18% |
| 39 | Kenwood | 939 | 18,417 | .0510 | 91 | 9% |
| 40 | Washington Park | 952 | 12,313 | .0773 | 98 | 9% |
| 41 | Hyde Park | 1,509 | 30,599 | .0493 | 95 | 7% |
| 42 | Woodlawn | 1,542 | 23,801 | .0648 | 90 | 6% |
| 43 | South Shore | 3,431 | 53,588 | .0640 | 376 | 10% |
| 44 | Chatham | 2,415 | 29,942 | .0807 | 202 | 8% |
| 45 | Avalon Park | 449 | 9,024 | .0498 | 81 | 15% |
| 46 | South Chicago | 1,520 | 27,551 | .0552 | 204 | 12% |
| 47 | Burnside | 115 | 2,304 | .0499 | 1 | 1% |
| 48 | Calumet Heights | 614 | 11,229 | .0547 | 61 | 9% |
| 49 | Roseland | 2,062 | 36,635 | .0563 | 207 | 9% |
| 50 | Pullman | 453 | 6,744 | .0672 | 71 | 14% |
| 51 | South Deering | 835 | 12,854 | .0650 | 30 | 3% |
| 52 | East Side | 580 | 22,613 | .0256 | 21 | 4% |
| 53 | West Pullman | 1,253 | 24,549 | .0510 | 208 | 14% |
| 54 | Riverdale | 378 | 7,518 | .0503 | 74 | 16% |
| 55 | Hegewisch | 334 | 8,927 | .0374 | 23 | 6% |
| 56 | Garfield Ridge | 713 | 36,732 | .0194 | 271 | 28% |
| 57 | Archer Heights | 599 | 13,414 | .0447 | 16 | 3% |
| 58 | Brighton Park | 780 | 42,994 | .0181 | 157 | 17% |
| 59 | McKinley Park | 466 | 14,854 | .0314 | 107 | 19% |
| 60 | Bridgeport | 720 | 33,638 | .0214 | 5 | 1% |
| 61 | New City | 1,446 | 40,065 | .0361 | 319 | 18% |
| 62 | West Elsdon | 346 | 17,901 | .0193 | 94 | 21% |
| 63 | Gage Park | 1,011 | 36,081 | .0280 | 44 | 4% |
| 64 | Clearing | 384 | 23,629 | .0163 | 57 | 13% |
| 65 | West Lawn | 841 | 31,942 | .0263 | 114 | 12% |
| 66 | Chicago Lawn | 1,710 | 54,409 | .0314 | 260 | 13% |
| 67 | West Englewood | 1,485 | 28,144 | .0528 | 285 | 16% |
| 68 | Englewood | 1,827 | 23,195 | .0788 | 221 | 11% |
| 69 | Greater Grand Crossing | 2,364 | 29,143 | .0811 | 339 | 13% |
| 70 | Ashburn | 787 | 42,007 | .0187 | 337 | 30% |
| 71 | Auburn Gresham | 2,412 | 43,779 | .0551 | 112 | 4% |
| 72 | Beverly | 401 | 19,521 | .0205 | 24 | 6% |
| 73 | Washington Heights | 1,120 | 24,851 | .0451 | 251 | 18% |
| 74 | Mount Greenwood | 179 | 19,059 | .0094 | 13 | 7% |
| 75 | Morgan Park | 755 | 20,873 | .0362 | 35 | 4% |
| 76 | O'Hare | 690 | 14,394 | .0479 | 17 | 2% |
| 77 | Edgewater | 1,485 | 56,563 | .0263 | 329 | 18% |
| - | Chicago | 104,367 | 2,711,226 | .0385 | 14,573 | 12% |
Homicide rates by community area
| No. | Name | Side | Homicides [12] | Population [90] | Rate | Change 24-25 |
|---|---|---|---|---|---|---|
| 01 | Rogers Park | North | 3 | 55,711 | 5.38 | 5 |
| 02 | West Ridge | North | 2 | 79,265 | 2.52 | 2 |
| 03 | Uptown | North | 2 | 57,464 | 3.48 | 0 |
| 04 | Lincoln Square | North | 1 | 42,271 | 2.37 | 1 |
| 05 | North Center | North | 1 | 35,814 | 2.79 | 1 |
| 06 | Lake View | North | 0 | 101,739 | 0 | 2 |
| 07 | Lincoln Park | North | 1 | 69,099 | 1.45 | 0 |
| 08 | Near North Side | Central | 12 | 101,208 | 11.86 | 5 |
| 09 | Edison Park | North | 0 | 11,402 | 0 | 0 |
| 10 | Norwood Park | North | 1 | 39,641 | 2.52 | 1 |
| 11 | Jefferson Park | North | 0 | 27,032 | 0 | 2 |
| 12 | Forest Glen | North | 0 | 19,855 | 0 | 0 |
| 13 | North Park | North | 0 | 19,855 | 0 | 0 |
| 14 | Albany Park | North | 2 | 47,663 | 4.20 | 4 |
| 15 | Portage Park | North | 2 | 64,213 | 3.11 | 1 |
| 16 | Irving Park | North | 1 | 53,584 | 1.87 | 1 |
| 17 | Dunning | North | 0 | 42,574 | 0 | 0 |
| 18 | Montclare | North | 0 | 13,765 | 0 | 0 |
| 19 | Belmont Cragin | North | 4 | 73,991 | 5.41 | 1 |
| 20 | Hermosa | North | 0 | 23,157 | 0 | 2 |
| 21 | Avondale | North | 3 | 36,374 | 8.25 | 3 |
| 22 | Logan Square | North | 2 | 71,252 | 2.81 | 1 |
| 23 | Humboldt Park | West | 18 | 55,416 | 32.48 | 2 |
| 24 | West Town | West | 3 | 86,482 | 3.47 | 1 |
| 25 | Austin | West | 45 | 100,120 | 44.95 | 2 |
| 26 | West Garfield Park | West | 13 | 16,374 | 79.39 | 5 |
| 27 | East Garfield Park | West | 12 | 19,901 | 60.30 | 5 |
| 28 | Near West Side | West | 19 | 65,581 | 28.97 | 4 |
| 29 | North Lawndale | West | 20 | 30,409 | 65.77 | 8 |
| 30 | South Lawndale | West | 13 | 69,708 | 18.65 | 11 |
| 31 | Lower West Side | West | 3 | 34,237 | 8.76 | 5 |
| 32 | Loop (The) | Central | 7 | 41,671 | 16.80 | 3 |
| 33 | Near South Side | Central | 4 | 28,216 | 14.18 | 1 |
| 34 | Armour Square | South | 2 | 13,228 | 15.12 | 3 |
| 35 | Douglas | South | 4 | 21,355 | 18.73 | 5 |
| 36 | Oakland | South | 0 | 6,977 | 0 | 2 |
| 37 | Fuller Park | South | 3 | 2,219 | 135.20 | 1 |
| 38 | Grand Boulevard | South | 3 | 24,813 | 12.09 | 4 |
| 39 | Kenwood | South | 0 | 18,637 | 0 | 2 |
| 40 | Washington Park | South | 6 | 12,366 | 48.52 | 4 |
| 41 | Hyde Park | South | 2 | 29,559 | 6.77f | 0 |
| 42 | Woodlawn | South | 7 | 23,865 | 29.33 | 6 |
| 43 | South Shore | South | 23 | 55,754 | 41.22 | 10 |
| 44 | Chatham | South | 11 | 31,382 | 35.05 | 14 |
| 45 | Avalon Park | South | 2 | 9,606 | 20.82 | 1 |
| 46 | South Chicago | South | 8 | 30,315 | 26.39 | 8 |
| 47 | Burnside | South | 2 | 2,246 | 89.05 | 2 |
| 48 | Calumet Heights | South | 5 | 12,087 | 41.37 | 0 |
| 49 | Roseland | South | 18 | 37,610 | 47.86 | 6 |
| 50 | Pullman | South | 0 | 6,856 | 0 | 4 |
| 51 | South Deering | South | 5 | 15,218 | 32.86 | 2 |
| 52 | East Side | South | 6 | 23,870 | 25.14 | 4 |
| 53 | West Pullman | South | 8 | 25,449 | 31.44 | 11 |
| 54 | Riverdale | South | 8 | 7,817 | 102.34 | 7 |
| 55 | Hegewisch | South | 2 | 9,097 | 21.99 | 2 |
| 56 | Garfield Ridge | South | 1 | 36,401 | 2.75 | 3 |
| 57 | Archer Heights | South | 2 | 13,867 | 14.42 | 2 |
| 58 | Brighton Park | South | 3 | 42,243 | 7.10 | 2 |
| 59 | McKinley Park | South | 1 | 15,479 | 6.46 | 1 |
| 60 | Bridgeport | South | 3 | 33,186 | 9.04 | 0 |
| 61 | New City | South | 6 | 40,971 | 14.64 | 9 |
| 62 | West Elsdon | South | 0 | 18,366 | 0 | 1 |
| 63 | Gage Park | South | 4 | 34,788 | 11.50 | 4 |
| 64 | Clearing | South | 1 | 24,728 | 4.04 | 1 |
| 65 | West Lawn | South | 2 | 32,594 | 6.14 | 2 |
| 66 | Chicago Lawn | South | 5 | 52,464 | 9.53 | 9 |
| 67 | West Englewood | South | 8 | 25,772 | 31.04 | 9 |
| 68 | Englewood | South | 12 | 21,378 | 56.13 | 9 |
| 69 | Greater Grand Crossing | South | 22 | 28,991 | 75.89 | 14 |
| 70 | Ashburn | South | 2 | 42,745 | 4.68 | 4 |
| 71 | Auburn Gresham | South | 20 | 44,878 | 44.57 | 10 |
| 72 | Beverly | South | 1 | 19,781 | 5.06 | 0 |
| 73 | Washington Heights | South | 3 | 26,456 | 11.34 | 5 |
| 74 | Mount Greenwood | South | 0 | 19,121 | 0 | 0 |
| 75 | Morgan Park | South | 5 | 20,724 | 24.13 | 4 |
| 76 | O'Hare | North | 0 | 13,997 | 0 | 0 |
| 77 | Edgewater | North | 4 | 56,099 | 7.13 | 1 |
| - | Chicago | - | 524 | 2,711,226 | 19.33 | 165 |
Street gangs
Chicago has an estimated population of over 100,000 active gang members from nearly 60 factions according to studies from 2011/2012.[91][92] Gangs were responsible for 32% of the homicides in Chicago in 2011, however this has fluctuated over time. In 2023, 24% of criminal homicides could be attributed to a gang altercation, a decrease from 2022's 30%.[93]
Former Chicago Police Superintendent Garry McCarthy blamed Chicago's gang culture in 2015 for its high rates of homicide and other violent crime, stating "It's very frustrating to know that it's like 7% of the population causes 80% of the violent crime...The gangs here are traditional gangs that are generational, if you will. The grandfather was a gang member, the father's a gang member, and the kid right now is going to be a gang member."[94]
Mayor Rahm Emanuel disbanded the Chicago Police Department's anti-gang unit in 2012 in order to focus on beat patrols, which he said would have a more long-term solution to violence than anti-gang units.[95][96]
As many as 70 active and inactive Chicago street gangs with 753 factions were identified in 2016.[97][98] Some of the gangs that contribute most of the crime on the streets of Chicago:
- Gangster Disciples
- Vice Lords
- Black P. Stones
- Latin Kings
- Black Disciples
- Maniac Latin Disciples
- Spanish Cobras
- Almighty Saints
- Spanish Gangster Disciples
- Four Corner Hustlers
- Norridge Hearts
Detailed analysis of the homicides timeline by month show that homicides (of all races) went up right after Martin Luther King was killed in 1968 (still for reasons unknown). However, Hispanic-on-Hispanic homicides, did not notably start until the summer of 1971, due to the Latin Kings gang election meetings.[99] However, this claim can't be immediately proven, as homicides by race are not made public for those time periods.
Political corruption
Chicago has a long history of public corruption that regularly draws the attention of federal law enforcement and federal prosecutors.[100] Chicago's political landscape has been firmly under the control of the Democratic Party for over 85 years and has been widely described as a political machine.[101][102][103][104] In the 1980s, the FBI's Operation Greylord uncovered massive and systemic corruption in Chicago's judicial system. Greylord was the longest and most successful undercover operation in the history of the FBI, and resulted in 92 federal indictments, including 17 judges, 48 lawyers, eight policemen, ten deputy sheriffs, eight court officials, and one state legislator. Nearly all were convicted on a variety of charges including bribery, kickbacks, fraud, vote buying, racketeering, and drug trafficking.[105][106][107]
The late 1980s and 1990s saw further efforts by the FBI to prosecute Chicago's public crime syndicates. Operation Incubator obtained about a dozen convictions or guilty pleas, including those from five members of the City Council and an aide to former Mayor Harold Washington.[108] Later Operation Gambat brought a wide range of charges against a Chicago judge, a state senator, an alderman, and two others relating to corruption in the Cook County Circuit Court, the Illinois Senate, and the Chicago City Council. Four were convicted and a fifth died during trial.[109] The most extensive operation by the FBI of the 1990s, Operation Silver Shovel, sought to uncover corruption within Chicago labor unions, organized crime, and other city government officials. Operation Silver Shovel resulted in the conviction of six Chicago aldermen and a dozen other local officials on a wide range of corruption related charges.[109][110][111]
From 2012 to 2019, 33 Chicago aldermen were convicted on corruption charges, roughly one third of those elected in the time period. A report from the Office of the Legislative Inspector General noted that over half of Chicago's elected alderman took illegal campaign contributions in 2013.[112] In 2015, mayor appointed Barbara Byrd-Bennett, the CEO of Chicago Public Schools, was convicted in a $23 million kickback scheme and was sentenced to seven and a half years in prison.[113] In addition to the Bennett conviction, a joint investigative report issued by the Office of the Inspector General and federal authorities documented widespread corruption within Chicago Public Schools in 2015. The audit noted the criminal shakedown of a CPS vendor, a records forgery scheme by a principal, numerous instances of employees abusing CPS's tax-exempt status to purchase personal items at big-box retailers, illegally using taxpayer-funded resources to campaign for political causes and stealing from taxpayer-funded accounts intended for purchasing student materials.[114]
A 2015 report released by the University of Illinois at Chicago's political science department declared Chicago the "corruption capital of America", citing that the Chicago-based Federal Judicial District for Northern Illinois reported 45 public corruption convictions for 2013 and a total of 1,642 convictions for the 38 years since 1976 when the U.S. Department of Justice began compiling the statistics. UIC Professor and former Chicago alderman Dick Simpson noted in the report that "To end corruption, society needs to do more than convict the guys that get caught. A comprehensive anti-corruption strategy must be forged and carried out over at least a decade. A new political culture in which public corruption is no longer tolerated must be created".[115][116]

Examples of other high-profile Chicago political figures convicted on corruption related charges include Rod Blagojevich, Jesse Jackson Jr., Isaac Carothers, Arenda Troutman, Edward Vrdolyak, Otto Kerner, Jr., Constance Howard, Fred Roti and Dan Rostenkowski.
In October 2015, the FBI announced that Michael Anderson would take over for a retiring Robert Holley as Special Agent in Charge of the Chicago Bureau. Anderson, a corruption veteran who wrote the FBI Public Corruption Field Guide, called Chicago "target rich" for cases in an interview with the Chicago Tribune. Anderson commands a team of 850 agents in Chicago along with analysts and support staff.[117][118]
Most corruption cases in Chicago are prosecuted by the US Attorney's office, as legal jurisdiction makes most offenses punishable as a federal crime.[119] As of April 7, 2025, the US Attorney for the Northern district of Illinois was Andrew S. Boutros.
Policing
During the Progressive Era, the first juvenile system was created by Chicago officials and, to make the court system more organized and specific, specialized courts, like those for domestic disputes, were created.[120] Not only did the court and corrections systems change, there was also a change in policing. Divisions and squads became specialized on particular types of crime. The courts began to incorporate specialists, like scientists and psychologists, to make the trial and evidence more reliable and trustworthy.[120]

Chicago was among the first U.S. cities to create an integrated emergency-response center to coordinate the response to natural disasters, gang violence, and terrorist attacks. Built in 1995, the center is integrated with more than 2,000 cameras, communications with all levels of city government, and a direct link to the National Counterterrorism Center. Police credited surveillance cameras with contributing to decreased crime in 2004.[121]

In 2003, the Chicago Police Department began installing POD's (Police Observation Devices) in high-crime areas. The cameras are able to rotate 360 degrees and zoom to a fine level of detail. The devices are also bulletproof, operable in any weather condition, record continuously and switch into night-vision mode after dark. POD's are used to monitor street crime and direct police deployment. Data from the cameras is wirelessly transmitted to the Chicago Crime Prevention and Information Center (CPIC) which can individually control any camera.[122][123] Over 20,000 cameras currently operate in Chicago. In addition to PODs, colloquially referred to as "blue-light cameras", the city has added general surveillance cameras to CTA stations, buses, Chicago Housing Authority buildings, public buildings and schools.[124] This has prompted harsh criticism from privacy advocates and the ACLU who called the program "A pervasive and poorly regulated threat to our privacy".[125]
The Chicago Police Department has also been criticized for its liberal use of the controversial "stop-and-frisk" policy.[126] For decades, the policy gave officers much more autonomy to conduct stops and pat-downs if there exists a reasonable suspicion that a suspect might be armed and dangerous.[127][128] The ACLU has claimed that the policy unfairly targets African Americans, who accounted for nearly 75% of those stopped in 2014, even though they account for a third of the city's population.[129] The Chicago Police Department confiscated almost 7,000 firearms in 2014, about 583 per month.[130] The stop-and-frisk policy was largely abandoned by CPD in early 2016.[128]
Because the Chicago Police Department tallies data differently than police in other cities, the FBI often does not accept its crime statistics . Chicago police officers record all criminal sexual assaults, as opposed to only rape . They count aggravated battery together with the standard category of aggravated assault . As a result, Chicago is often omitted from studies such as Morgan Quitno's annual "Safest/Most Dangerous City" survey, which relies on FBI-collected data.[131]
The Chicago Police Department's CLEAR (Citizen Law Enforcement Analysis and Reporting) system is a web application enabling the public to search the Chicago Police Department's database of reported crime. Individuals are able to see maps, graphs, and tables of reported crime. The database contains 90 days of information, which can be accessed in blocks of up to 14 days. Data is refreshed daily. However, the most recent information is always six days old.
The police use "guardian-like" intervention, a method relying on information from an individual's criminal history in order to predict the likelihood of becoming a victim or perpetrator of violence, to "build public trust and legitimacy."[132]
CPD tallied 22 police-involved shootings in 2015, eight of which resulted in fatalities.[133] Fatality cases involving an African American perpetrator often gave rise to a media sensation, both in Chicago and elsewhere.[134] In December 2015, the US Department of Justice opened a civil rights investigation of the Chicago Police Department in the aftermath of the Laquan McDonald case. The "pattern and practice" probe evaluated the use of force, deadly force, accountability and tracking procedures of the department. A 190-page report issued in April 2016 deemed the Chicago Police Department a racist organization. Chairman of the Chicago Fraternal Order of Police, Dean Angelo called the report "totally biased" and "utterly ridiculous".[135][136][137][138]
2016's surge in murders and shootings, coupled with a decline in gun seizures, led former Police Superintendent John Escalante to express concerns in March 2016 that officers might be hesitant to engage in proactive policing due to fear of retribution. Officers anonymously reported to the Chicago Sun-Times that they have been afraid to make investigatory stops because the Justice Department and American Civil Liberties Union of Illinois have been scrutinizing police practices. Data of the supposed pullback was reflected with an 80 percent decrease in the number of street stops that officers made since the beginning of 2016. Dean Angelo has claimed that part of the problem is politicians and groups like the ACLU who don't know much about policing, and yet are "dictating what police officers do".[139][140][141]
Professors Paul Cassell and Richard Fowles at the University of Utah later analyzed the 2016 Chicago homicide "spike" and concluded that the most likely cause was a consent decree entered into by the American Civil Liberties Union (ACLU) with the Chicago Police Department restricting stop and frisks. Cassell and Fowles concluded that 239 additional victims were killed and 1129 additional shootings occurred in 2016 because of the reduction in stop and frisks.[142] This study, however, failed to identify such spikes in the large number of other cities subject to similar consent decrees,[143] leading to questions about whether they had really identified a causal relationship.
Crime reporting accuracy
In 2014 and 2015, Chicago Magazine and The Economist conducted investigations into the CompStat data reporting of crime statistics for the city and reported irregularities. In addition, an audit conducted by Chicago's Office of the Inspector General found significant problems in the accuracy of CPD's crime data.
According to Chicago Magazine, superiors often pressure officers to under-report crime. An unnamed police source quoted in the magazine says there are "a million tiny ways to do it", such as misclassifying and downgrading offenses, counting multiple incidents as single events, and discouraging residents from reporting crime. The police department has responded that their statistics are generally accurate and that the discrepancies can be explained by differences in the Uniform Crime Reporting used by the FBI and CompStat.[144][145][146][147][148]
Gun laws and dealers
The city of Chicago has one of the highest homicide rates among large cities. Despite generally strict gun laws compared to neighboring areas, there are still many illegal guns in Chicago. It is estimated that 80% of homicides in Chicago are committed with firearms.[149]
Chicago passed a citywide handgun ban in 1982 that was in effect until a decision in McDonald v. City of Chicago by the Supreme Court of the United States in 2008. Chicago has a ban on guns designated as "assault weapons" and laser sights.[150][151] Additionally, under Illinois law, to own a firearm one must possess a firearms owners’ identification (FOID) card, undergo a background check, and wait 72 hours before taking possession of a purchased firearm.[152][153] Lost or stolen guns must also be reported to law enforcement within 72 hours.[154] There are currently no gun stores within Chicago city limits and Federal firearms laws already make it illegal to buy firearms out of state without an FFL transfer and background check from that state. Access to guns is likely occurring via neighboring Indiana, a state with lax gun laws, and the many other areas through already illegal straw purchases.[155]
About 7000 guns are recovered by Chicago police each year at crime scenes. An estimated 45% of these guns are bought by straw buyers in states with lax gun laws, namely Indiana.[156] In April 2021, the City of Chicago filed a lawsuit against Westforth Sports of Gary, Indiana, alleging that it consistently ranks as one of the highest suppliers of guns used in crimes. The city claims that during the period from 2009 to 2016, 850 recovered guns were originally purchased from Westforth Sports.[157]
See also
References
- ↑ "Crime in Chicago, Illinois (IL): murders, rapes, robberies, assaults, burglaries, thefts, auto thefts, arson, law enforcement employees, police officers, crime map".
- ↑ Ford, Matt (January 25, 2017). "What's Actually Causing Chicago's Homicide Spike?". The Atlantic. Retrieved April 18, 2022.
- ↑ "Downtown shootings up 220%, biggest spike in city: 'People are fed up'". Chicago Sun-Times. October 29, 2021. Retrieved April 18, 2022.
- ↑ "Examining The Reasons For Chicago's Violence". NPR.org. Retrieved April 18, 2022.
- ↑ "Fractured Chicago Gangs Lead to Anarchic Culture of Violence". WTTW News. Retrieved April 18, 2022.
- ↑ "Inside the Notorious Gun Shop Linked to Hundreds of Chicago Guns". ProPublica. 2023 [Décember 2023].
- ↑ "Majority of Guns Used in Chicago Crimes Come From Outside Illinois". NBC Chicago. October 29, 2017.
- ↑ "'Eye-popping numbers': Chicago sues Indiana gun store tied to 850 firearms recovered from crime scenes". USA Today.
- ↑ "Brandon Johnson's Chicago election win is the police's worst nightmare". Newsweek. April 5, 2023.
- ↑ "Chicago sees fewer than 600 murders in 2024 for 1st time since 2019; shootings, carjackings down". ABC7 Chicago. January 1, 2025.
- ↑ "Chicago shootings, homicides down in February compared to 2024, police say". FOX 32 Chicago. March 5, 2025. Retrieved March 19, 2025.
- 1 2 3 4 5 "Violence Reduction - Victims of Homicides and Non-Fatal Shootings". Chicago Data Portal. Retrieved June 4, 2025.
- ↑ "Chicago Police Annual Report 1967" (PDF). Chicago Police Department. Archived from the original (PDF) on March 4, 2016. Retrieved July 26, 2015.
- ↑ "Chicago Police Annual Report 1996" (PDF). Chicago Police Department. Archived from the original (PDF) on March 4, 2016. Retrieved July 26, 2015.
- ↑ "Chicago Police Annual Report 2017" (PDF). chicagopolice.org. Chicago Police Department. p. 68. Archived from the original (PDF) on December 3, 2018. Retrieved December 24, 2018.
- 1 2 3 "2023 Chicago Police Annual Report" (PDF). Chicago Police Department. February 20, 2024. p. 135. Retrieved April 19, 2025.
- ↑ "Violence Reduction Dashboard". City of Chicago. 2025.
- ↑ "Chicago Police Department News Release" (PDF). Ci.chi.il.us. January 19, 2007. Retrieved December 17, 2015.
- ↑ "Chicago violence continues to outpace NYC, LA". Chicago Tribune. July 2014.
- 1 2 Tribune, Chicago (August 29, 2016). "August most violent month in Chicago in nearly 20 years". Chicago Tribune.
- ↑ "Chicago's Top Cop Says Courts 'Making Us All Less Safe' After Bloody Fourth of July Weekend". WTTW News. Retrieved July 16, 2021.
- ↑ "Annual Estimates of the Resident Population for Incorporated Places in Illinois: April 1, 2020 to July 1, 2024" (XLS). United States Census Bureau. Retrieved May 26, 2025.
- ↑ "Annual Estimates of the Resident Population for Incorporated Places in Illinois: April 1, 2010 to July 1, 2019" (XLS). United States Census Bureau. Retrieved April 27, 2025.
- ↑ "Annual Estimates of the Resident Population for Incorporated Places in Illinois: April 1, 2000 to July 1, 2009" (XLS). United States Census Bureau. Retrieved April 27, 2025.
- ↑ "Population Estimates for States, Counties, Places, and Minor Civil Divisions: Annual Time Series, July 1, 1990 to July 1, 1999" (TXT). United States Census Bureau. Retrieved April 27, 2025.
- ↑ "2024 Annual Chicago Police Report" (PDF). Retrieved September 29, 2025.
- ↑ "2022 Chicago Police Annual Report" (PDF). March 3, 2023. p. 129. Retrieved April 19, 2025.
- ↑ "2021 Chicago Police Annual Report" (PDF). Chicago Police Department. March 1, 2022. p. 98. Retrieved April 19, 2025.
- ↑ "2019 Chicago Police Annual Report" (PDF). Chicago Police Department. p. 44. Retrieved April 19, 2025.
- ↑ "2018 Chicago Police Annual Report" (PDF). Chicago Police Department. p. 62. Retrieved April 19, 2025.
- ↑ "2017 Chicago Police Annual Report" (PDF) (PDF). Chicago Police Department. p. 80. Retrieved April 19, 2025.
- ↑ Feinman, Joel; Murder Clearance Rates
- ↑ "CHICAGO POLICE DEPARTMENT ANNUAL REPORT 2010 A Year In Review" (PDF). home.chicagopolice.org.
- ↑ "Reading Eagle - Google News Archive Search".
- 1 2 3 4 5 6 7 "Chicago Tribune Homicide Data". Chicago Tribune. March 2, 2016. Retrieved January 1, 2018.
- 1 2 "Chicago Police Annual Report 1965" (PDF). Portal.chicagopolice.org. p. 8. Retrieved June 21, 2016.
- 1 2 "Chicago Police Annual Report 1966" (PDF). Portal.chicagopolice.org. p. 6. Archived from the original (PDF) on September 17, 2016. Retrieved September 6, 2018.
- 1 2 "Chicago Police Annual Report 1967" (PDF). Portal.chicagopolice.org. p. 9. Archived from the original (PDF) on September 17, 2016. Retrieved September 6, 2018.
- ↑ "Chicago Police Annual Report 1968" (PDF). Portal.chicagopolice.org. p. 12. Archived from the original (PDF) on September 17, 2016. Retrieved September 6, 2018.
- ↑ "Chicago Police Annual Report 1969" (PDF). Portal.chicagopolice.org. p. 10. Archived from the original (PDF) on September 17, 2016. Retrieved September 6, 2018.
- ↑ "Chicago Police Annual Report 1970" (PDF). Portal.chicagopolice.org. p. 10. Archived from the original (PDF) on September 17, 2016. Retrieved September 6, 2018.
- ↑ "Chicago Police Annual Report 1971" (PDF). Portal.chicagopolice.org. p. 11. Archived from the original (PDF) on September 17, 2016. Retrieved September 6, 2018.
- ↑ "Chicago Police Annual Report 1972" (PDF). Portal.chicagopolice.org. p. 6. Archived from the original (PDF) on September 17, 2016. Retrieved September 6, 2018.
- ↑ "Chicago Police Annual Report 1973" (PDF). Portal.chicagopolice.org. p. 6. Archived from the original (PDF) on September 17, 2016. Retrieved September 6, 2018.
- ↑ "Chicago Police Annual Report 1974" (PDF). Portal.chicagopolice.org. p. 7. Archived from the original (PDF) on September 17, 2016. Retrieved September 6, 2018.
- ↑ "Chicago Police Annual Report 1975" (PDF). Portal.chicagopolice.org. p. 9. Archived from the original (PDF) on September 17, 2016. Retrieved September 6, 2018.
- ↑ "Chicago Police Annual Report 1976" (PDF). Portal.chicagopolice.org. p. 9. Archived from the original (PDF) on September 17, 2016. Retrieved September 6, 2018.
- ↑ "Chicago Police Annual Report 1977" (PDF). Portal.chicagopolice.org. p. 12. Archived from the original (PDF) on September 17, 2016. Retrieved September 6, 2018.
- ↑ "Chicago Police Annual Report 1978" (PDF). Portal.chicagopolice.org. p. 12. Archived from the original (PDF) on September 17, 2016. Retrieved September 6, 2018.
- ↑ "Chicago Police Annual Report 1979" (PDF). Portal.chicagopolice.org. p. 12. Archived from the original (PDF) on September 17, 2016. Retrieved September 6, 2018.
- ↑ "Chicago Police Annual Report 1980" (PDF). Portal.chicagopolice.org. p. 7. Archived from the original (PDF) on September 17, 2016. Retrieved September 6, 2018.
- ↑ "Chicago Police Annual Report 1981" (PDF). Portal.chicagopolice.org. p. 7. Archived from the original (PDF) on September 17, 2016. Retrieved September 6, 2018.
- ↑ "Chicago Police Annual Report 1982" (PDF). Portal.chicagopolice.org. p. 2. Archived from the original (PDF) on September 17, 2016. Retrieved September 6, 2018.
- ↑ "Chicago Police Annual Report 1983" (PDF). Portal.chicagopolice.org. p. 2. Archived from the original (PDF) on September 17, 2016. Retrieved September 6, 2018.
- ↑ "Chicago Police Annual Report 1984" (PDF). Portal.chicagopolice.org. p. 2. Archived from the original (PDF) on September 17, 2016. Retrieved September 6, 2018.
- ↑ "Chicago Police Annual Report 1985" (PDF). Portal.chicagopolice.org. p. 2. Archived from the original (PDF) on September 17, 2016. Retrieved September 6, 2018.
- ↑ "Chicago Police Annual Report 1986" (PDF). Portal.chicagopolice.org. p. 8. Archived from the original (PDF) on September 17, 2016. Retrieved September 6, 2018.
- ↑ "Chicago Police Annual Report 1987" (PDF). Portal.chicagopolice.org. p. 4. Archived from the original (PDF) on September 17, 2016. Retrieved September 6, 2018.
- ↑ Recktenwald, William (January 1, 1998). "Total Is Lowest In Chicago In Years". Chicago Tribune. Retrieved June 20, 2020.
- ↑ "Chicago Police Annual Report 1988" (PDF). Portal.chicagopolice.org. p. 4. Archived from the original (PDF) on September 17, 2016. Retrieved September 6, 2018.
- ↑ "Chicago Handgun Homicides Increase In 1989". Chicago Tribune. May 24, 1990. Retrieved June 20, 2020.
- ↑ Official Count Shows 851 Slain In Chicago Last Year May 30, 1991; Chicago Tribune
- ↑ "Chicago Murder Clearance Rate Worst in More Than 2 Decades – Chicago". Dnainfo.com. January 4, 2013. Archived from the original on December 22, 2015. Retrieved December 17, 2015.
- ↑ "Chicago's crime conundrum: More homicides, fewer detectives". The Guardian. Associated Press. September 10, 2016.
- 1 2 "2011 Chicago Murder Analysis" (PDF). Home.chicagopolice.org. Retrieved December 17, 2015.
- ↑ "Chicago Police Chief Garry McCarthy fired by Mayor Rahm Emanuel". Fox News. September 11, 2001. Retrieved December 1, 2015.
- ↑ "How Do People Survive Gunshot Wounds? | Colorado Shooting". Livescience.com. July 23, 2012. Retrieved December 17, 2015.
- ↑ "South Side to get adult trauma center after years of protest". Chicago Tribune. September 10, 2015. Retrieved December 17, 2015.
- ↑ "Tragic, but not Random: The Social Contagion of Nonfatal Gunshot Injuries – Institution for Social and Policy Studies".
- ↑ "Analysis: Homicides Cost Chicago $2.5 Billion". Huffington Post. May 23, 2013.
- ↑ Jones, Tim; McCormick, John (May 23, 2013). "Chicago Killings Cost $2.5 Billion as Murders Top N.Y.'s". Bloomberg.com – via www.bloomberg.com.
- ↑ Ralph Ellis; Vivian Kuo (August 28, 2016). "Dwyane Wade's cousin Nykea Aldridge killed". CNN.
- ↑ "Chicago's murder rate soars 72% in 2016; shootings up more than 88%". USA Today.
- ↑ "Violence Surges in Chicago Even as Policing Debate Rages On". The New York Times. March 29, 2016.
- ↑ Kirkos, Bill (April 2016). "Residents fear Chicago will set new deadly record". CNN.
- ↑ Worl, Justin (April 2016). "Chicago Murders Have Jumped 71% So Far in 2016".
- ↑ "Chicago grapples with worst murder rate in two decades". PBS. April 3, 2016.
- ↑ "ABC7 Exclusive: Spike Lee talks about Chiraq". November 10, 2015.
- ↑ "85 shot, 24 fatally, over Chicago's most violent weekend of 2020". Chicago Sun Times. June 2, 2020. Retrieved June 22, 2023.
- ↑ "Chicago sees deadliest day of violence in decades". BBC News. June 9, 2020. Retrieved June 10, 2020.
- ↑ Moser, Whet (August 14, 2012). "Gawker Glosses Chicago's Murder Problem". Chicago (August 2012). Chicago Tribune Media Group. Archived from the original on September 3, 2014. Retrieved August 28, 2014.
- ↑ Christensen, Jen (March 14, 2014). "Tackling Chicago's 'crime gap'". CNN. Retrieved August 28, 2014.
- ↑ Ray, Justin (October 8, 2015). "New Report Declares Chicago Neighborhood as 'America's Mass-Shooting Capital'". NBC Chicago. Retrieved December 17, 2015.
- ↑ Sharkey, P. T.; Tirado-Strayer, N; Papachristos, A. V.; Raver, C. C. (2012). "The effect of local violence on children's attention and impulse control". American Journal of Public Health. 102 (12): 2287–93. doi:10.2105/AJPH.2012.300789. PMC 3519330. PMID 23078491.
- ↑ "Chicago's "Safe Passage" program put to test on first day of school". CBS News. August 30, 2013. Retrieved December 17, 2015.
- ↑ "'Safe Passage' for students through Chicago's violent streets". CBS News. September 5, 2014. Retrieved December 17, 2015.
- ↑ "Chicago Police Department 2024 Annual Report" (PDF). Chicago Police Department Office of Constitutional Policing. Retrieved May 25, 2026.
- ↑ "Combined Community Data Snapshots". Chicago Metropolitan Agency for Planning. pp. 3s. Archived from the original on December 22, 2017. Retrieved May 25, 2026.
- ↑ "Boundaries – Community Areas (current)". City of Chicago. Archived from the original on July 12, 2019. Retrieved May 8, 2020.
- ↑ "Community Data Snapshots". Chicago Metropolitan Agency for Planning.
- ↑ "Chicago Gang Violence: By The Numbers". Abcnews.go.com. 2011. Retrieved December 17, 2015.
- ↑ "Chicago Most Gang-Infested City in U.S., Officials Say". NBC Chicago. January 26, 2012. Retrieved December 17, 2015.
- ↑ "2023 Chicago Police Annual Report" (PDF). March 13, 2024. p. 124. Retrieved June 11, 2025.
- ↑ "Gangs and guns fuel Chicago's summer surge of violence | PBS NewsHour". Pbs.org. July 20, 2015. Retrieved December 17, 2015.
- ↑ "Chicago Mayor Rahm Emanuel is defending his decision in the first days of his administration to disband anti-gang units like the Mobile Strike Force | WBEZ 91.5 Chicago". Wbez.org. July 9, 2012. Archived from the original on December 11, 2015. Retrieved December 17, 2015.
- ↑ "Terrorised Chicago residents plead for police crackdown as gang war murders soar". Telegraph. July 15, 2012. Archived from the original on January 12, 2022. Retrieved December 17, 2015.
- ↑ "Chicago Street Gangs". Chicago Gang History. Retrieved December 6, 2016.
- ↑ "Gang Areas in Chicago". Uic.edu. Archived from the original on March 1, 2016. Retrieved December 17, 2015.
- ↑ "Latin Kings 1971–72 Election Meetings". Retrieved October 3, 2019.
- ↑ "Chicago's 'hall of shame'". Chicago Tribune. February 24, 2012. Retrieved June 20, 2020.
- ↑ Tritsch, Shane (December 9, 2010). "Why Is Illinois So Corrupt?". Chicago Magazine.
- ↑ "Chicago Democrats Make Appeal To Republican Candidates". NPR. June 13, 2015.
- ↑ "Politics".
- ↑ "Machine Politics". Encyclopedia of Chicago.
- ↑ "FBI — Operation Greylord". Fbi.gov. Retrieved December 17, 2015.
- ↑ Thomas J. Gradel and Dick Simpson. "UI Press | Thomas J. Gradel and Dick Simpson | Corrupt Illinois: Patronage, Cronyism, and Criminality". Press.uillinois.edu. Retrieved December 17, 2015.
- ↑ Hake, Terrence (August 7, 2015). Operation Greylord: The True Story of an Untrained Undercover Agent and America's Biggest Corruption Bust (1st ed.). Ankerwycke. p. 350. ISBN 978-1627229197.
- ↑ "5 Indicted in Latest Inquiry Into Corruption in Chicago". NY Times. December 20, 1990. Retrieved December 17, 2015.
- 1 2 "FBI — History". Fbi.gov. Archived from the original on December 22, 2015. Retrieved December 17, 2015.
- ↑ "FBI Major Investigation – Operation Silver Shovel". October 11, 2008. Archived from the original on July 21, 2009. Retrieved December 17, 2015.
- ↑ "Operation Silver Shovel Mole Sentenced". Chicago Tribune. March 17, 2000. Retrieved June 20, 2020.
- ↑ Austin Berg (November 16, 2015). "More than half of Chicago aldermen took illegal campaign cash in 2013 | City Limits". Chicagonow.com. Archived from the original on May 27, 2017. Retrieved December 17, 2015.
- ↑ "Ex-CPS chief Barbara Byrd-Bennett pleads guilty, tearfully apologizes to students". Chicago Tribune. October 14, 2015. Retrieved December 17, 2015.
- ↑ "Annual Report FY 2015" (PDF). Office of the Inspector General, Chicago Board of Education. Archived from the original (PDF) on March 11, 2016. Retrieved March 10, 2016.
- ↑ "Chicago : Still the Capital of Corruption : Anti-Corruption Report Number 8" (PDF). Pols.uic.edu. Archived from the original (PDF) on November 17, 2015. Retrieved December 17, 2015.
- ↑ "Report Names Chicago "Corruption Capital of America"- Again". NBC Chicago. May 28, 2015. Retrieved December 17, 2015.
- ↑ Meisner, Jason (October 7, 2015). "New Chicago FBI chief: City 'target rich' for corruption probes". Chicago Tribune. Retrieved December 17, 2015.
- ↑ Meisner, Jason (September 21, 2015). "New FBI boss in Chicago a public corruption veteran". Chicago Tribune. Archived from the original on November 6, 2015. Retrieved December 17, 2015.
- ↑ "Northern District of Illinois – Department of Justice". November 13, 2014.
- 1 2 Adler, J. S. (September 1, 2006). ""It Is His First Offense. We Might As Well Let Him Go": Homicide and Criminal Justice in Chicago, 1875–1920". Journal of Social History. 40 (1): 5–6. doi:10.1353/jsh.2006.0067. ISSN 0022-4529. S2CID 144642693.
- ↑ Jim McKay (December 8, 2005). "Triggered Response". Govtech.com. Retrieved December 17, 2015.
- ↑ "POD Program". portal.chicagopolice.org. Archived from the original on March 7, 2018. Retrieved May 26, 2025.
- ↑ "Crime Prevention and Information Center (CPIC)". Directives.chicagopolice.org. Archived from the original on December 22, 2015. Retrieved December 17, 2015.
- ↑ "Number of Chicago Security Cameras 'Frightening,' ACLU says". Dnainfo.com. May 9, 2013. Archived from the original on December 22, 2015. Retrieved December 17, 2015.
- ↑ Adam Schwartz (January 5, 2013). ""Chicago's Video Surveillance Cameras: A Pervasive and Poorly Regulated" by Adam Schwartz". Northwestern Journal of Technology and Intellectual Property. 11 (2): 47. Retrieved December 17, 2015.
- ↑ "Chicago leads New York City in use of stop-and-frisk by police, new study finds".
- ↑ Busby, John C (September 18, 2009). "Stop and frisk".
- 1 2 Goudie, Chuck (February 2, 2016). "CPD "stop and frisks" down 80 percent in 2016".
- ↑ "Stop and Frisk in Chicago" (PDF). ACLU of Illinois. March 2015. Archived from the original (PDF) on March 4, 2016. Retrieved January 15, 2016.
- ↑ "THE WATCHDOGS: Chicago gun seizures tops in U.S., but doubts about police hurt prosecutions | Chicago Sun-Times". Archived from the original on December 22, 2015. Retrieved January 15, 2016.
- ↑ Locy, Toni (June 6, 2005). "USATODAY.com - Murder, violence rates fall, FBI says". www.usatoday.com. Archived from the original on September 12, 2005. Retrieved May 26, 2025.
- ↑ Crawford, Susan (November 25, 2015). "Arresting Crime Before It Happens". BackChannel. Archived from the original on November 26, 2015. Retrieved November 28, 2015.
- ↑ "Chicago police shot fewer people in 2015". Chicago Tribune. January 2, 2016.
- ↑ "Chicago violence, homicides and shootings up in 2015". Chicago Tribune. January 2, 2016.
- ↑ "Police union: Low morale will crater following 'biased' report". Archived from the original on June 11, 2016. Retrieved April 18, 2016.
- ↑ Tribune, Chicago (April 16, 2016). "Report on Chicago police exposes racism, politics in a city of tribes". Chicago Tribune.
- ↑ Castillejo, Esther (December 7, 2015). "Department of Justice to Investigate Chicago Police in Wake of Laquan McDonald Casepublisher=ABC News". ABC News. Retrieved December 17, 2015.
- ↑ McLaughlin, Eliott C. (December 7, 2015). "Chicago police investigated by Justice Department". CNN. Retrieved December 17, 2015.
- ↑ "Homicides and shootings have doubled in Chicago so far this year compared with the same period in 2015".
- ↑ "Police brass, facing horrible homicide numbers, at last see frontline response". Archived from the original on March 6, 2016. Retrieved March 3, 2016.
- ↑ "Decline In Chicago Police Stops Signal Bigger Problem Than More Paperwork". Archived from the original on April 3, 2016.
- ↑ Cassell, Paul G.; Fowle, Richard. "WHAT CAUSED THE 2016 CHICAGO HOMICIDE SPIKE? AN EMPIRICAL EXAMINATION OF THE "ACLU EFFECT" AND THE ROLE OF STOP AND FRISKS IN PREVENTING GUN VIOLENCE" (PDF). illinoislawreview.org.
- ↑ Rizzo, Salvador (May 14, 2018). "Jeff Sessions's claim that an ACLU settlement with Chicago caused murders to spike". Washington Post. ISSN 0190-8286. Retrieved May 3, 2023.
- ↑ Bernstein, David (April 7, 2014). "The Truth About Chicago's Crime Rates | Chicago magazine | May 2014". Chicagomag.com. Archived from the original on December 17, 2015. Retrieved December 17, 2015.
- ↑ Bernstein, David (May 19, 2014). "The Truth About Chicago's Crime Rates: Part 2 | Chicago magazine | June 2014". Chicagomag.com. Retrieved December 17, 2015.
- ↑ "CHICAGO POLICE DEPARTMENT : ASSAULT-RELATED CRIME STATISTICS CLASSIFICATION AND REPORTING AUDIT 2011" (PDF). Chicagoinspectorgeneral.org. Archived from the original (PDF) on February 12, 2016. Retrieved December 17, 2015.
- ↑ Bernstein, David (May 11, 2015). "New Tricks | Chicago magazine | June 2015". Chicagomag.com. Retrieved December 17, 2015.
- ↑ "Crime statistics in Chicago: Deceptive numbers". The Economist. May 22, 2014. Retrieved December 17, 2015.
- ↑ Ludwig, Jens (April 2, 2021). "Data Points: Illegal gun carrying in Chicago spiked in 2020 — and deadly violence followed". chicagotribune.com. Retrieved July 16, 2021.
- ↑ "ARTICLE II. POSSESSION OF FIREARMS (8-20-020 et seq.))". American Legal Publishing Corporation. Retrieved July 16, 2021.
- ↑ "Assault Weapons - City Ordinances". directives.chicagopolice.org. Archived from the original on November 12, 2020. Retrieved July 16, 2021.
- ↑ "Illinois General Assembly - Bill Status for HB4392". www.ilga.gov. Retrieved July 16, 2021.
- ↑ "PUBLIC SAFETY(430 ILCS 65/) Firearm Owners Identification Card Act". Archived from the original on November 1, 2011.
- ↑ "Illinois General Assembly - Illinois Compiled Statutes". www.ilga.gov. Retrieved July 16, 2021.
- ↑ "Where Do Guns Used to Commit Shootings in Chicago Come From?". Congresswoman Robin Kelly. August 14, 2018. Archived from the original on July 19, 2023. Retrieved July 16, 2021.
- ↑ "Gun Trace Report: City of Chicago, Office of the Mayor, Chicago Police Department" (PDF). October 2017. Archived (PDF) from the original on May 17, 2019.
- ↑ "Chicago Sues Westforth Sports for Illegal Gun Sales". Everytown Law. Retrieved July 16, 2021.
Further reading
- Lesy, Michael (2007). Murder City: The Bloody History of Chicago in the Twenties. W. W. Norton. ISBN 978-0393060300.
- Hagedorn, John and Brigid Rauch. "Housing, Gangs, and Homicide What We Can Learn from Chicago." Urban Affairs Review. March 2007 vol. 42 no. 4 435–456. doi:10.1177/1078087406294435.
External links
- Chicago Police Department
- Chicago homicide map generator
- Online Crime Map of Chicago- SpotCrime.com
- Table of Chicago gang raids by Chicago police and federal police

