Tropical cyclones in 1978
| Tropical cyclones in 1978 | |
|---|---|
 Typhoon Rita persisting as a Category 5 Super Typhoon for three consecutive days | |
| Year boundaries | |
| First system | Nadine |
| Formed | January 6, 1978 |
| Last system | Peter |
| Dissipated | January 3, 1979 |
| Strongest system | |
| Name | Rita |
| Lowest pressure | 878 mbar (hPa); 25.93 inHg |
| Longest lasting system | |
| Name | Fico |
| Duration | 22 days |
| Year statistics | |
| Total systems | 110 |
| Named systems | 88 |
| Total fatalities | 1,496 total |
| Total damage | $1.243 billion (1978 USD) |

During 1978, tropical cyclones formed within seven different tropical cyclone basins, located within various parts of the Atlantic, Pacific and Indian Oceans. During the year, a total of 110 systems formed, with 88 of these developing further and being named by the responsible warning centre. The strongest tropical cyclone of the year was Typhoon Rita, with a minimum barometric pressure of 878 hPa (25.93 inHg).[1] The deadliest and costliest tropical cyclone of the year was the 1978 Sri Lanka cyclone that killed an estimated 915 people and caused $627 million in damages.[2]
Compared to the previous year, 1978 formed less tropical cyclones. However, more of them were named than the previous year. The most active basin of the year was the Western Pacific which had 30 total storms that were named. Both the Eastern Pacific and Atlantic basins were above normal in activity, with 19 and 12 nameable storms forming respectively. The North Indian basin saw activity that was on par with the climatological norm. The southern hemisphere saw average numbers throughout each basin, being the South-West Indian Ocean, Australian region, and the South Pacific.
Tropical cyclone activity in each basin is under the authority of an RSMC. The National Hurricane Center (NHC) is responsible for tropical cyclones in the North Atlantic. The Eastern Pacific Hurricane Center (EPHC) is responsible for tropical cyclones in the Eastern Pacific.[note 1] The Central Pacific Hurricane Center (CPHC) is responsible for tropical cyclones in the Central Pacific. The NHC, EPHC,[note 2] and CPHC are subdivisions of the National Weather Service. Activity in the West Pacific is monitored by the Japan Meteorological Agency (JMA), at the time the Joint Typhoon Warning Center (JTWC) named tropical cyclones in the basin. Systems in the North Indian Ocean are monitored by the India Meteorological Department (IMD). The Météo-France located in Réunion (MFR) monitors tropical activity in the South-West Indian Ocean. The Australian region is monitored by five TCWCs that are under the coordination of the Australian Bureau of Meteorology (BOM). Similarly, the South Pacific is monitored by both the Fiji Meteorological Service (FMS) and the Meteorological Service of New Zealand Limited. Another, unofficial agency that provides additional guidance in tropical cyclone monitoring is the Philippine Atmospheric, Geophysical and Astronomical Services Administration (PAGASA).
Global atmospheric and hydrological conditions

Tropical cyclone climatology and variability throughout 1978 was dominated by a neutral El Niño Southern Oscillation (ENSO) that had emerged from a weakening Central Pacific-based El Niño event from the previous year, these neutral conditions persisted into the winter, and onto the next year.[3][4]
Summary

North Atlantic Ocean

Atlantic hurricane season was slightly above average in terms of number of named storms. Eleven tropical cyclones were named in all, and five of these became hurricanes; two of the five became a major hurricane (Category 3 or higher on the Saffir–Simpson scale).[5] This was also the last Atlantic hurricane season to use an all-female naming list.[6] The season officially began on June 1, 1978, and ended on November 30, 1978. These dates, adopted by convention, denote the period in each year when most tropical cyclogenesis occurs in the Atlantic basin.[7] However, the formation of subtropical or tropical cyclones is possible at any time of the year, as shown by the formation of an unnamed subtropical storm on January 18.[5]
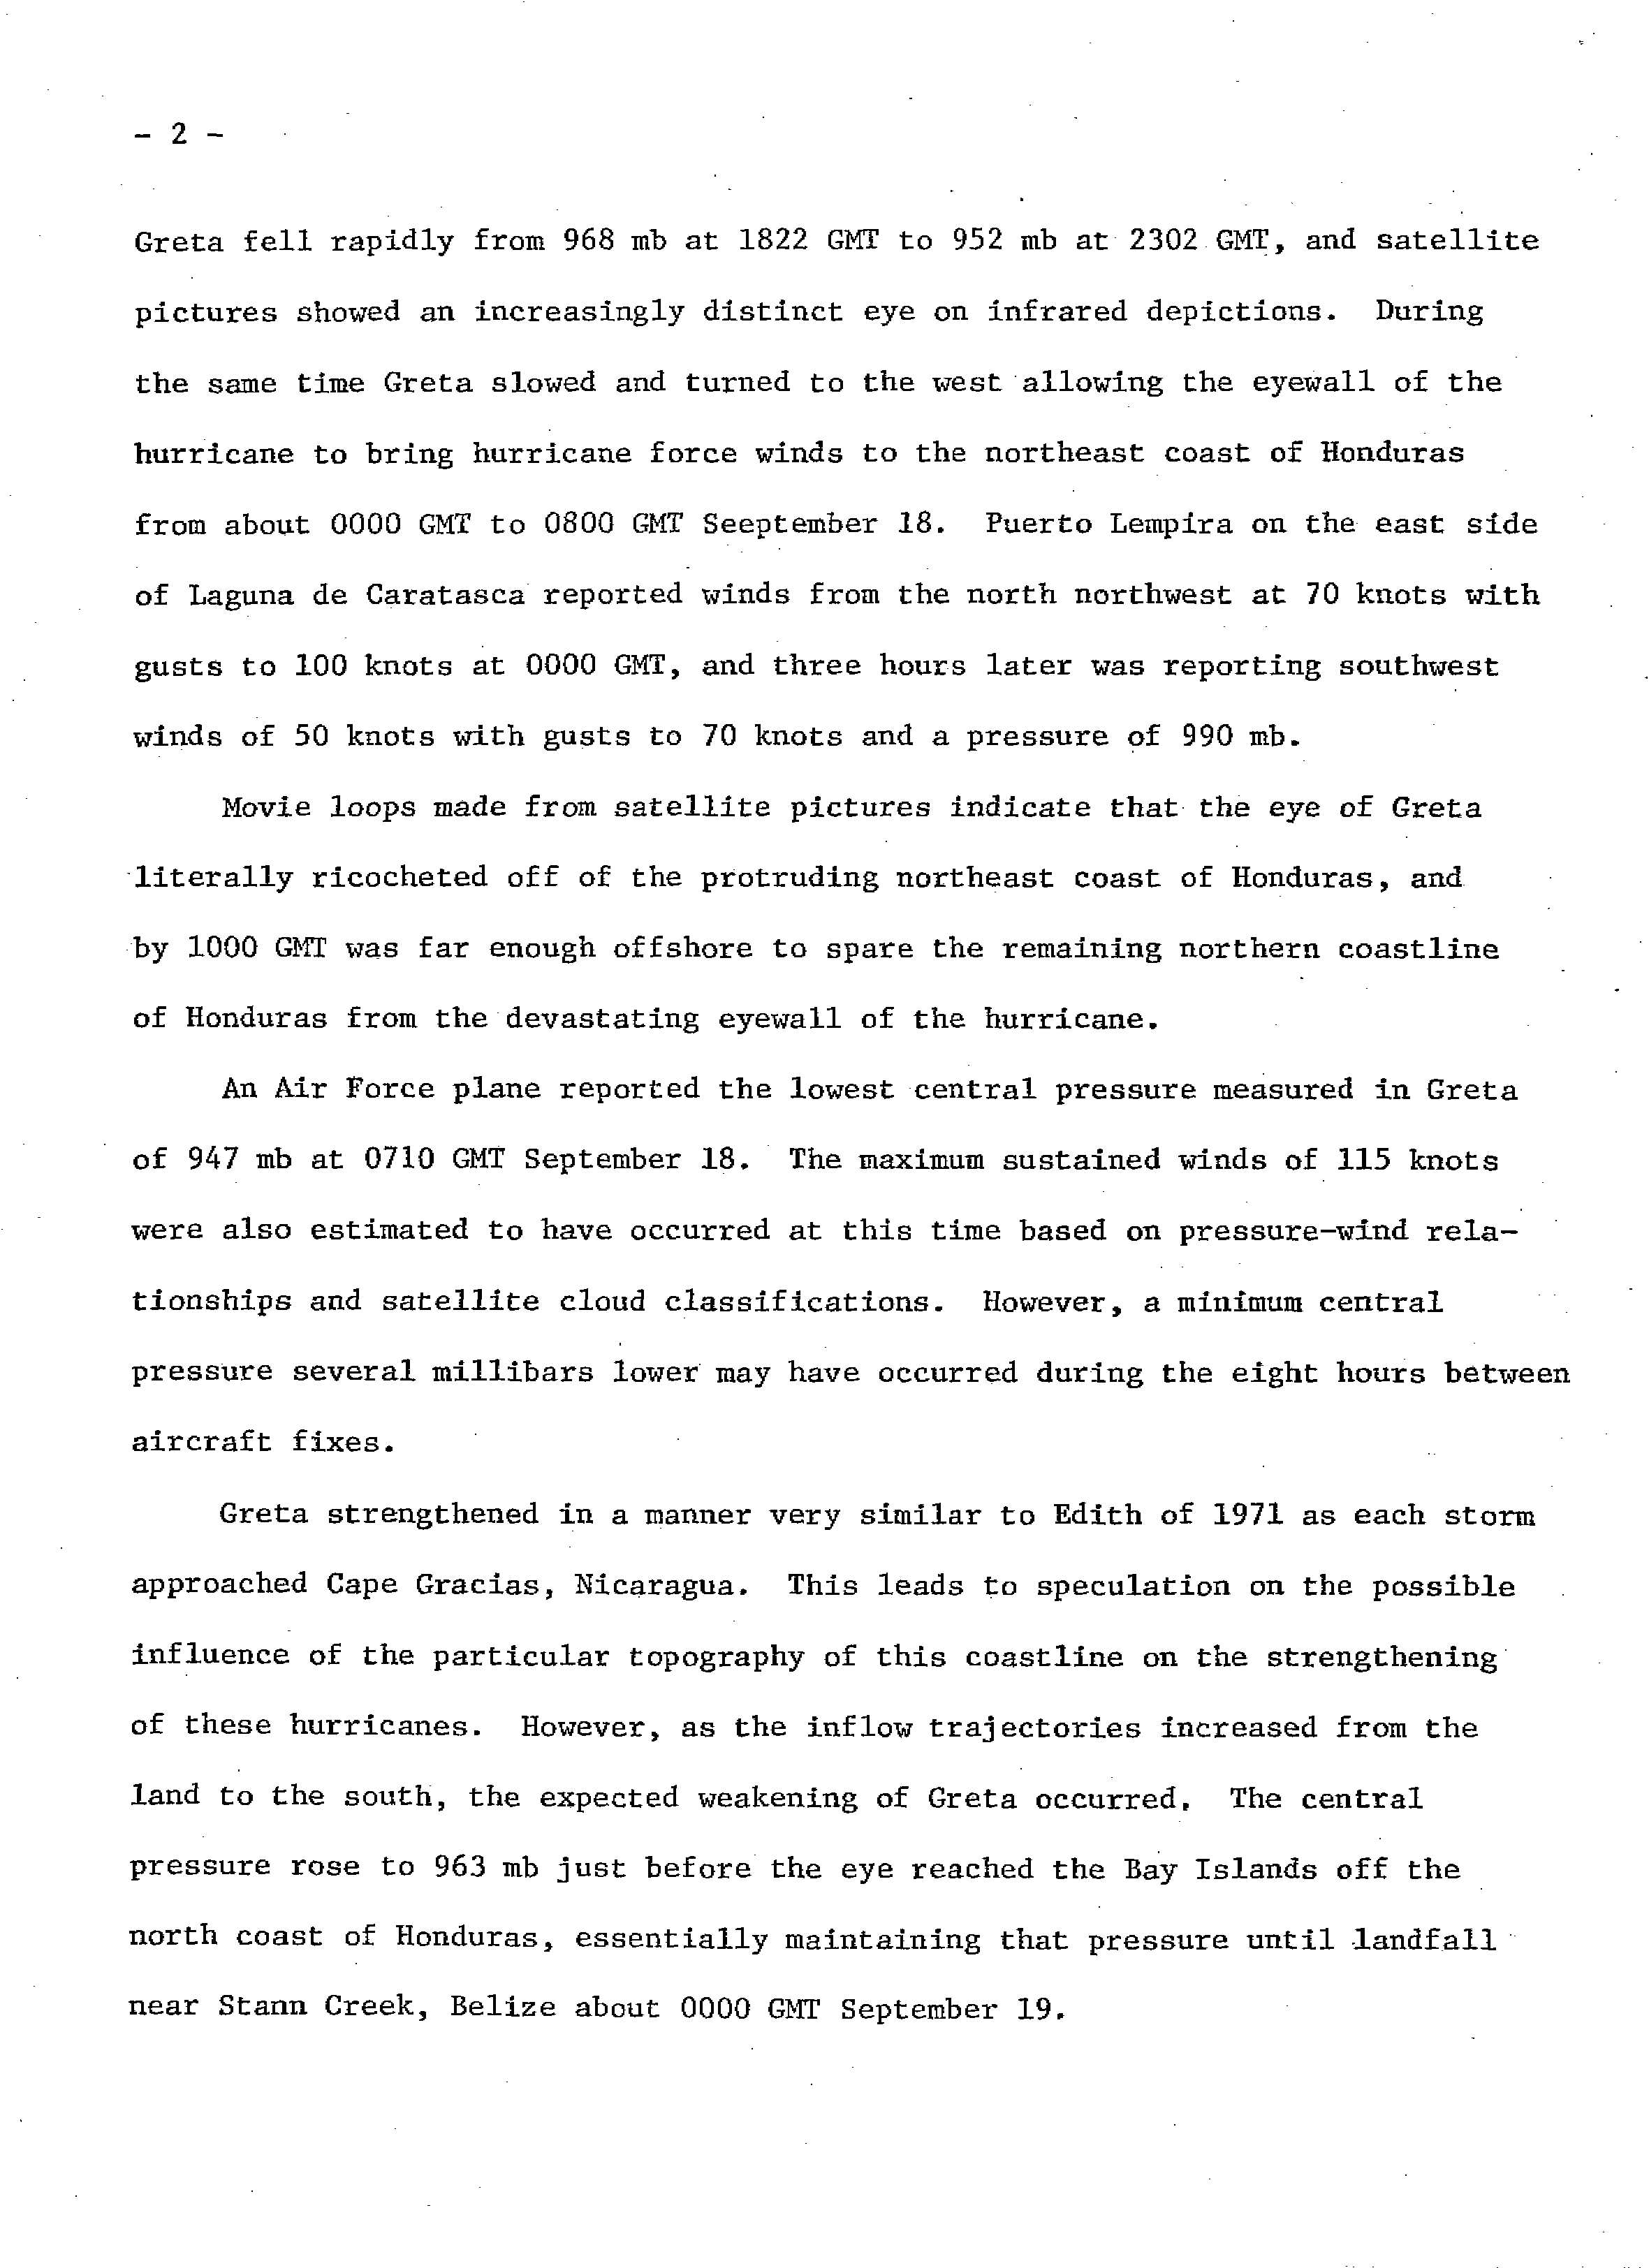
Three storms made landfall along the coast of the western Gulf of Mexico during the season. At the end of July and into early August, short-lived Tropical Storm Amelia and its remnants caused extensive flooding in Texas after dropping as much as 48 in (1,200 mm) of rain. There were 33 deaths and US$110 million (equivalent to $414 million in 2024) in damage.[8] Also in August, Tropical Storm Bess made landfall in Veracruz, and later, Tropical Storm Debra did so in Louisiana.[9] Neither caused significant damage, though Debra or its remnants spawned multiple tornadoes that killed two people.[10] Hurricanes Ella and Greta each reached Category 4 strength. Though remaining out at sea, Ella did lash the East Coast of the United States and Atlantic Canada with gusty winds and rip currents in early September.[11] Greta brought strong winds, high tides, and flooding to Central America, particularly Belize and Honduras, resulting in about $25 million in damage and at least five fatalities. The storm crossed intact into the eastern Pacific Ocean and was renamed Olivia.[12] Overall, the storms of this season collectively caused $141 million in damage and 42 fatalities.
Eastern & Central Pacific Ocean

This year’s Pacific hurricane season was the first Pacific hurricane season to use both masculine and feminine names for tropical cyclones. It also began the modern practice of utilizing naming lists every six years. Despite lacking an El Niño, a common driver of enhanced activity in the East and Central Pacific basins,[13] the 1978 season was active. It featured 19 named storms, 14 hurricanes, and 7 major hurricanes, the latter of which are Category 3 or stronger cyclones on the Saffir–Simpson scale. Within the confines of the Central Pacific basin, located between the International Date Line and 140°W, 13 tropical cyclones or their remnants were observed by forecasters at the Central Pacific Hurricane Center, a record number of occurrences at the time.[14] Seasonal activity began on May 30 and ended on October 21, within the limits of a traditional hurricane season which begins on May 15 in the East Pacific and June 1 in the Central Pacific. The season ends on November 30 in both basins. These dates conventionally delimit the period during each year when most tropical cyclones form.[15]
The first system of the season, Aletta, made landfall on the Mexico coastline on May 31. Hurricanes Carlotta, Daniel, and Iva tracked into the Central Pacific as dissipating cyclones, where they produced a few inches of rainfall across the Hawaiian Islands. More substantive impacts came from Hurricane Fico, the longest-lived hurricane and the longest-tracked hurricane on record in the Central Pacific at the time. Large waves and rough seas caused severe damage to beachfront homes and forced the rescuing of stranded boaters offshore. Strong winds damaged trees and caused power outages.[16][17] Damage across Hawaii totaled $200,000. In early September, the remnants of Hurricane Norman produced accumulating rain and snow across California, resulting in severe damage to its crops that totaled in excess of $300 million, in addition to killing eight people.[18] In mid-October, Susan rapidly developed into a Category 4 hurricane over the Central Pacific, one of the strongest hurricanes on record there at the time. It persisted until October 21, marking an end to seasonal activity.[19][20]
Western Pacific Ocean

The 1978 Pacific typhoon season was a very active season that produced 31 tropical storms, 16 typhoons and one intense typhoon. It ran year-round in 1978, but most tropical cyclones tend to form in the northwestern Pacific Ocean between June and December. These dates conventionally delimit the period of each year when most tropical cyclones form in the northwestern Pacific Ocean.
The first system formed on January 6, while the final system dissipated on December 19. The season's strongest storm was Typhoon Rita, which attained peak 1-minute sustained winds of 175 mph (280 km/h) and a minimum central pressure of 878 mbar (25.93 inHg).[21][1] Rita was also the season's costliest and deadliest storm of the season, causing approximately US$100 million in damage and more than 300 fatalities, primarily across the Philippines.[21][22][23] Other destructive storms included Typhoon Olive, which killed 66 people in the Philippines, Hong Kong, and Taiwan, and Typhoon Carmen, which caused US$3 million in damage and 21 deaths in the Ryukyu Islands, eastern China, and Korea.[24] Overall, tropical cyclones during the season caused at least 1,374 deaths and more than US$760 million in damage.
North Indian Ocean

The 1978 North Indian Ocean cyclone season had no bounds, but tropical cyclones in the North Indian Ocean tend to form between April and December, with peaks in May and November. The 1978 season produced five cyclonic storms of which developed into three severe cyclonic storms. All five of the storms formed in the Bay of Bengal and four of those made landfall. The most notable storm of the season was BOB 11 which hit Sri Lanka.[2]
South-West Indian Ocean
January-June

The January-June portion of the 1977–78 South-West Indian Ocean cyclone season produced seven tropical cyclones between January and March 1978, of which five became named tropical storms and three intensified into tropical cyclones. Activity began on January 16 with the formation of Tropical Cyclone Fleur and concluded on March 19 with the dissipation of Tropical Storm Marylou.[25][26] The strongest storm of the period was Tropical Cyclone Fleur, which attained peak 1-minute sustained winds of 125 mph (200 km/h) and a minimum central pressure of 941 mbar (27.79 inHg).[26] Tropical Storm Kiki was the only system to cause fatalities, killing two people on Réunion, while no storm caused any reported monetary damage.[27] Overall, tropical cyclones during the period caused two deaths and no reported damage.
July-December

The July-December portion of the 1978–79 South-West Indian Ocean cyclone season featured two tropical cyclones between July and December 1978, one of which became a named storm. Activity began on December 13 with the formation of Cyclone Angele which impacted Madagascar and Mozambique as a slow-moving major, followed up by Tropical Storm 03S which crossed over from the Australian region and dissipated on December 26.[28][29]
Australian Region
January–June

The January–June portion of the 1977–78 Australian region cyclone season was an above-average period that produced six tropical cyclones, of which all six became named storms and three intensified into severe tropical cyclones. Activity began on January 10 with the formation of Cyclone Trudy and concluded on April 11 with the crossover of Cyclone Hal into the South Pacific.[30][31] The strongest storm during the period was Severe Tropical Cyclone Winnie, which attained peak 1-minute sustained winds of 125 mph (200 km/h) and a minimum central pressure of 945 mbar (27.91 inHg).[32] The period's costliest storm was Cyclone Alby, which caused approximately US$45 million in damage and five fatalities after impacting Western Australia.[33] Overall, tropical cyclones during the period caused at least seven deaths and approximately US$45 million in damage.
July–December

The July–December portion of the 1978–79 Australian region cyclone season produced three tropical cyclones, of which two became named storms and none intensified into a severe tropical cyclone. Activity began on November 19 with the formation of 01S and concluded on December 29 with the formation of Cyclone Peter, which remained active into January 1979. The strongest storm during the period was Cyclone Peter, which attained peak 1-minute sustained winds of 90 mph (145 km/h) and a minimum central pressure of 980 mbar (28.94 inHg). Peter was also the period's costliest and deadliest storm, causing approximately US$10 million in damage and two fatalities across Far North Queensland and Arnhem Land. Overall, tropical cyclones during the period caused two deaths and approximately US$10 million in damage.[34]
South Pacific Ocean
January–June

The January–June portion of the 1977–78 South Pacific cyclone season was an above-average period that produced five tropical cyclones, all of which became named tropical cyclones. Activity began with Cyclone Bob, which entered the basin from the previous season,[35] while the final system, Cyclone Hal, crossed into the basin from the Australian region before dissipating on April 22. The strongest storm during the period was Cyclone Hal, which attained peak 1-minute sustained winds of 85 mph (135 km/h) and a minimum central pressure of 965 mbar (28.50 inHg). None of the cyclones caused any confirmed fatalities, although Hal produced damage of unknown extent after affecting New Zealand.[36] Overall, tropical cyclones during the period caused no confirmed fatalities and no reported monetary damage.
July–December

The July–December portion of the 1978–79 South Pacific cyclone season produced only one tropical cyclone, which became a named storm. Activity began at the end of the year on December 27 with the formation of Tropical Cyclone Fay, which remained active into January 1979. Fay attained peak 1-minute sustained winds of 65 mph (105 km/h) and a minimum central pressure of 980 mbar (28.94 inHg). The cyclone affected Fiji, where it caused damage of unknown extent and an unknown number of fatalities. Overall, tropical cyclones during the period caused no confirmed fatalities and no reported monetary damage.[37][38][39]
Systems
January

The first month of the year saw seven tropical or subtropical cyclones forming with six of them being named, as well as featuring three crossover storm from the previous year, Mary in the Western Pacific, Esther in the South-West Indian Ocean, and Bob in the South Pacific.[40][41][35] The only unnamed storm was a subtropical storm in the North Atlantic that dissipated on the 23rd.[5] The 1978 Pacific Typhoon season started rather early with Tropical Storm Nadine forming early in the month.[42] Moderate Tropical Storm Huberte passed east of Rodrigues without causing any reported damage.[43] Later in the month, Cyclone Vern struck Australia in late January causing minor damage.[44] The strongest storm of the month was Cyclone Fleur that peaked as a strong Category 3 with 1-minute sustained winds of 125 mph (200 km/h).[26]
| Storm name | Dates active | Max wind km/h (mph) |
Pressure (hPa) |
Areas affected | Damage (USD) |
Deaths | Refs |
|---|---|---|---|---|---|---|---|
| Nadine | January 6–13 | 30 (50) | 970 | None | None | None | |
| Trudy | January 10–20 | 180 (110) | 954 | Indonesia | Unknown | None | |
| Fleur | January 16–23 | 200 (125) | 941 | Mauritius | Unknown | None | |
| One-L | January 18–23 | 75 (45) | 1002 | None | None | None | |
| Huberte | January 26–February 1 | 100 (65) | 991 | Rodrigues | Unknown | None | |
| Vern | January 27–February 3 | 130 (80) | 964 | Australia | >US$57,000 | None | [45] |
| Georgia | January 27–February 5 | 100 (65) | 991 | Madagascar | Unknown | None | |
February

February was slightly inactive, with only six tropical cyclones forming in the month, all being named. The strongest storm of February was Cyclone Charles in the South Pacific that peaked out to sea.[46] This month also featured cyclones Diana and Ernie which formed in tandem in the South Pacific.[47][48] Severe Tropical Storm Irena grazed northwestern Madagascar during the early-mid portions of February causing an unknown amount of damage,[49] followed by Moderate Tropical Storm Jacqueline which took an erratic path in the open Southern Indian Ocean, dissipating in late February.[50] At the end of the month, Cyclone Gwen formed in the Gulf of Carpentaria shortly before making landfall in the Cape York peninsula and emerging into the South Pacific basin.[51]
| Storm name | Dates active | Max wind km/h (mph) |
Pressure (hPa) |
Areas affected | Damage (USD) |
Deaths | Refs |
|---|---|---|---|---|---|---|---|
| Irena | February 7–14 | 135 (75) | 976 | None | Unknown | None | |
| Jacqueline | February 12–21 | 65 (40) | 991 | None | None | None | |
| Charles | February 13–March 1 | 155 (100) | 945 | None | None | None | |
| Diana | February 15–22 | 100 (65) | 980 | French Polynesia | None | None | |
| Ernie | February 17–23 | 100 (65) | 980 | Fiji | None | None | |
| Gwen | February 25–27 | 95 (60) | 987 | Cape York peninsula | Unknown | None | |
March

Like the previous month, March was slightly inactive with only six tropical cyclones forming, all being named. The strongest storm this month was Cyclone Alby which struck Western Australia, being regarded as the most devastating tropical cyclone to ever strike southwestern Western Australia.[52][53] Other storms that formed this month include Cyclone Winnie, another major in the open Southern Indian Ocean,[32] Tropical Storm Kiki earlier in the month that grazed Réunion, killing two people.[27][54] Cyclone Nadine and tropical storm’s Lucie and Marylou stayed out to sea during the middle of March.[55][25][56]
| Storm name | Dates active | Max wind km/h (mph) |
Pressure (hPa) |
Areas affected | Damage (USD) |
Deaths | Refs |
|---|---|---|---|---|---|---|---|
| Kiki | March 4–12 | 85 (50) | 992 | Réunion | None | 2 | [57] |
| Lucie | March 14–18 | 55 (35) | 1000 | None | None | None | |
| Winnie | March 16–28 | 200 (125) | 945 | None | None | None | |
| Marylou | March 15–19 | 100 (65) | 994 | None | None | None | |
| Nadine | March 18–23 | 85 (50) | 994 | None | None | None | |
| Alby | March 27–April 5 | 215 (130) | 930 | Western Australia | US$45 million | 5 | [33] |
April

April was another inactive month, with only three tropical cyclones forming, all of them being named. The month started with tropical storm’s Brenda and Hal forming in the Australian region, the latter went on to become a Category 1-equivalent cyclone after crossing into the South Pacific before making landfall in New Zealand.[36] Brenda slowly meandered offshore northwest Australia before ultimately dissipating mid-month.[31] The strongest storm of the month was Typhoon Olive that struck portions of the Philippines before intensifying into a rare early-season South China Sea typhoon, it was also a deadly storm as at least 66 people were confirmed to have died from the storm, mostly in the Philippines.[58][24]
| Storm name | Dates active | Max wind km/h (mph) |
Pressure (hPa) |
Areas affected | Damage (USD) |
Deaths | Refs |
|---|---|---|---|---|---|---|---|
| Brenda | April 5–14 | 95 (60) | 990 | None | None | None | |
| Hal | April 4–22 | 140 (85) | 965 | Cape York Peninsula, New Zealand | Unknown | Unknown | |
| Olive | April 15–May 1 | 160 (100) | 955 | Philippines, Hong Kong, Taiwan | US$32.2 million | 66 | [59] |
May

May of 1978 was one of the least active May’s on record for tropical cyclogenesis occurrence worldwide with only two nameable tropical cyclones forming. Both Very Severe Cyclonic Storm BOB 01 and Hurricane Aletta were the first tropical cyclones to form in their respective seasons. BOB 01 made landfall in Myanmar near mid-month causing an unknown amount of damage whilst Aletta made landfall in Mexico on the last day of the month as a weakening tropical storm with no damage being reported.[60][61]
| Storm name | Dates active | Max wind km/h (mph) |
Pressure (hPa) |
Areas affected | Damage (USD) |
Deaths | Refs |
|---|---|---|---|---|---|---|---|
| BOB 01 | May 14–17 | 110 (70) | 964 | Bangladesh, Myanmar | Unknown | Unknown | |
| Aletta | May 30–31 | 120 (75) | Unknown | Mexico | None | None |
June

June was a much more active month compared to the previous months, featuring thirteen tropical cyclones forming as six organized into nameable storms. The first three storms of the month were classified only by the Japan Meteorological Agency (JMA) followed up by Polly that impacted the Ryukyu Islands and Japan.[62] Bud and Carlotta were both simultaneously active, the latter becoming the strongest storm of the month peaking as a Category 4 hurricane in the Eastern Pacific out at sea.[63] The month concluded with weaker systems as a weak tropical depression formed in the Gulf of Mexico,[64] Tropical Storm Rose struck the Philippines and Taiwan,[65] Hurricane Daniel peaked out to sea in the Eastern Pacific as a Category 3 hurricane,[66] Tropical Storm Shirley struck Southeast Asia,[62] and a tropical depression formed at the end of the month in the Eastern Pacific before dissipating shortly into July.[66]
| Storm name | Dates active | Max wind km/h (mph) |
Pressure (hPa) |
Areas affected | Damage (USD) |
Deaths | Refs |
|---|---|---|---|---|---|---|---|
| TD | June 7 | Unknown | 1004 | Philippines | None | None | |
| TD | June 10 | Unknown | 1008 | Philippines | None | None | |
| TD | June 12–13 | Unknown | 1004 | Philippines | None | None | |
| Polly | June 13–24 | 95 (60) | 985 | Ryukyu Islands, Japan | None | None | |
| BOB 02 | June 16–17 | Unknown | Unknown | Unknown | Unknown | Unknown | |
| Bud | June 17–20 | 95 (60) | Unknown | None | None | None | |
| Carlotta | June 17–25 | 210 (130) | Unknown | None | None | None | |
| Two-L | June 21–22 | 50 (30) | Unknown | None | None | None | |
| Rose | June 21–25 | 95 (60) | 990 | Philippines, Taiwan | None | None | |
| LAND 01 | June 26–27 | Unknown | Unknown | Unknown | Unknown | Unknown | |
| Daniel | June 26–July 3 | 185 (115) | Unknown | None | None | None | |
| Shirley | June 26–July 2 | 80 (50) | 992 | Philippines, Vietnam, Cambodia | Unknown | None | |
| Five-E | June 30–July 2 | 50 (30) | Unknown | None | None | None |
July

July was above average in activity, featuring fifteen tropical cyclones forming with nine being named from them. The month started off strongly with Tropical Storm Emilia and Hurricane Fico, the latter becoming the longest-lived storm of the year as it crossed over from the Eastern to Central Pacific peaking as a moderate Category 4 hurricane, at the time Fico was the longest-duration hurricane and furthest-traveled hurricane on record in the Central Pacific.[16][67][68] Following this, multiple storms across all northern hemisphere basins formed in succession as a strong tropical depression moved over the North Atlantic main development region before dissipating,[69] Typhoon Trix went on to affect Japan,[70] BOB 03 and ARB 01 were both simultaneously active in the North Indian Ocean, and Hurricane Gilma and Hector intensified into the Eastern Pacific’s next major hurricanes, strengthening to Category 3 and 4 respectively. The latter half of the month featured a trio of active storms in the Western Pacific as Tropical Storm Agnes, Typhoon Wendy, and Typhoon Virginia co-existed at once,[71] the latter two persisting into August. At the end of the month, Tropical Storm Amelia formed in the Bay of Campeche, being the first named storm of the Atlantic hurricane season before making landfall in Texas, it later became the most destructive tropical cyclone of the month as catastrophic flooding took the lives of 33 people across Texas.[8][72]
| Storm name | Dates active | Max wind km/h (mph) |
Pressure (hPa) |
Areas affected | Damage (USD) |
Deaths | Refs |
|---|---|---|---|---|---|---|---|
| Emilia | July 6–10 | 105 (65) | Unknown | None | None | None | |
| TD | July 6–11 | Unknown | 1004 | Japan | None | None | |
| Fico | July 9–31 | 225 (140) | ≤955 | Hawaii, Aleutian Islands | US$200,000 | None | [17] |
| Three-L | July 10–12 | 55 (35) | Unknown | None | None | None | |
| Trix | July 11–25 | 145 (90) | 965 | Ryukyu Islands, China | Unknown | Unknown | |
| BOB 03 | July 11–14 | Unknown | Unknown | Unknown | Unknown | Unknown | |
| ARB 01 | July 11–13 | Unknown | Unknown | Unknown | Unknown | Unknown | |
| Gilma | July 13–20 | 185 (115) | Unknown | None | None | None | |
| TD | July 16 | Unknown | 1000 | None | None | None | |
| Hector | July 22–29 | 225 (140) | 955 | None | None | None | |
| Wendy | July 22–August 8 | 145 (90) | 960 | Ryukyu Islands, Japan | None | None | |
| Virginia | July 22–August 4 | 130 (80) | 974 | Japan | None | None | |
| Agnes | July 22–31 | 105 (65) | 980 | South China | None | 3 | |
| Amelia | July 30–August 1 | 80 (50) | 1005 | Texas | US$110 million | 33 | [8] |
| TD | July 31 | Unknown | 1004 | None | None | None |
August

August was an extremely active month in terms of the amount of tropical cyclones that formed, featuring a total of 34 tropical cyclones with seventeen of them being named, excluding the storms named by PAGASA, being Gedang, Oyang and Loleng. The month started off with western hemisphere activity alongside the formations of Bess, Ten-E, and Hurricane Cora, the latter becoming the first hurricane of the Atlantic hurricane season.[73][9][20] The Western Pacific followed up with the formations of Bonnie, Carmen, and Della.[62] In late August, multiple strong storms formed during this period with hurricane’s John, Kristy, and Miriam, typhoon’s Elaine and Faye, and Category 4 hurricane’s Ella and Norman.[62][63][11] Hurricane Norman was the strongest and most destructive storm of the month after its remnants plowed through Southern California producing locally heavy rainfall.[74][18]
| Storm name | Dates active | Max wind km/h (mph) |
Pressure (hPa) |
Areas affected | Damage (USD) |
Deaths | Refs |
|---|---|---|---|---|---|---|---|
| TD | August 4–5 | Unknown | 1002 | Taiwan | None | None | |
| Gading | August 4–8 | 55 (35) | 1000 | Taiwan | None | None | |
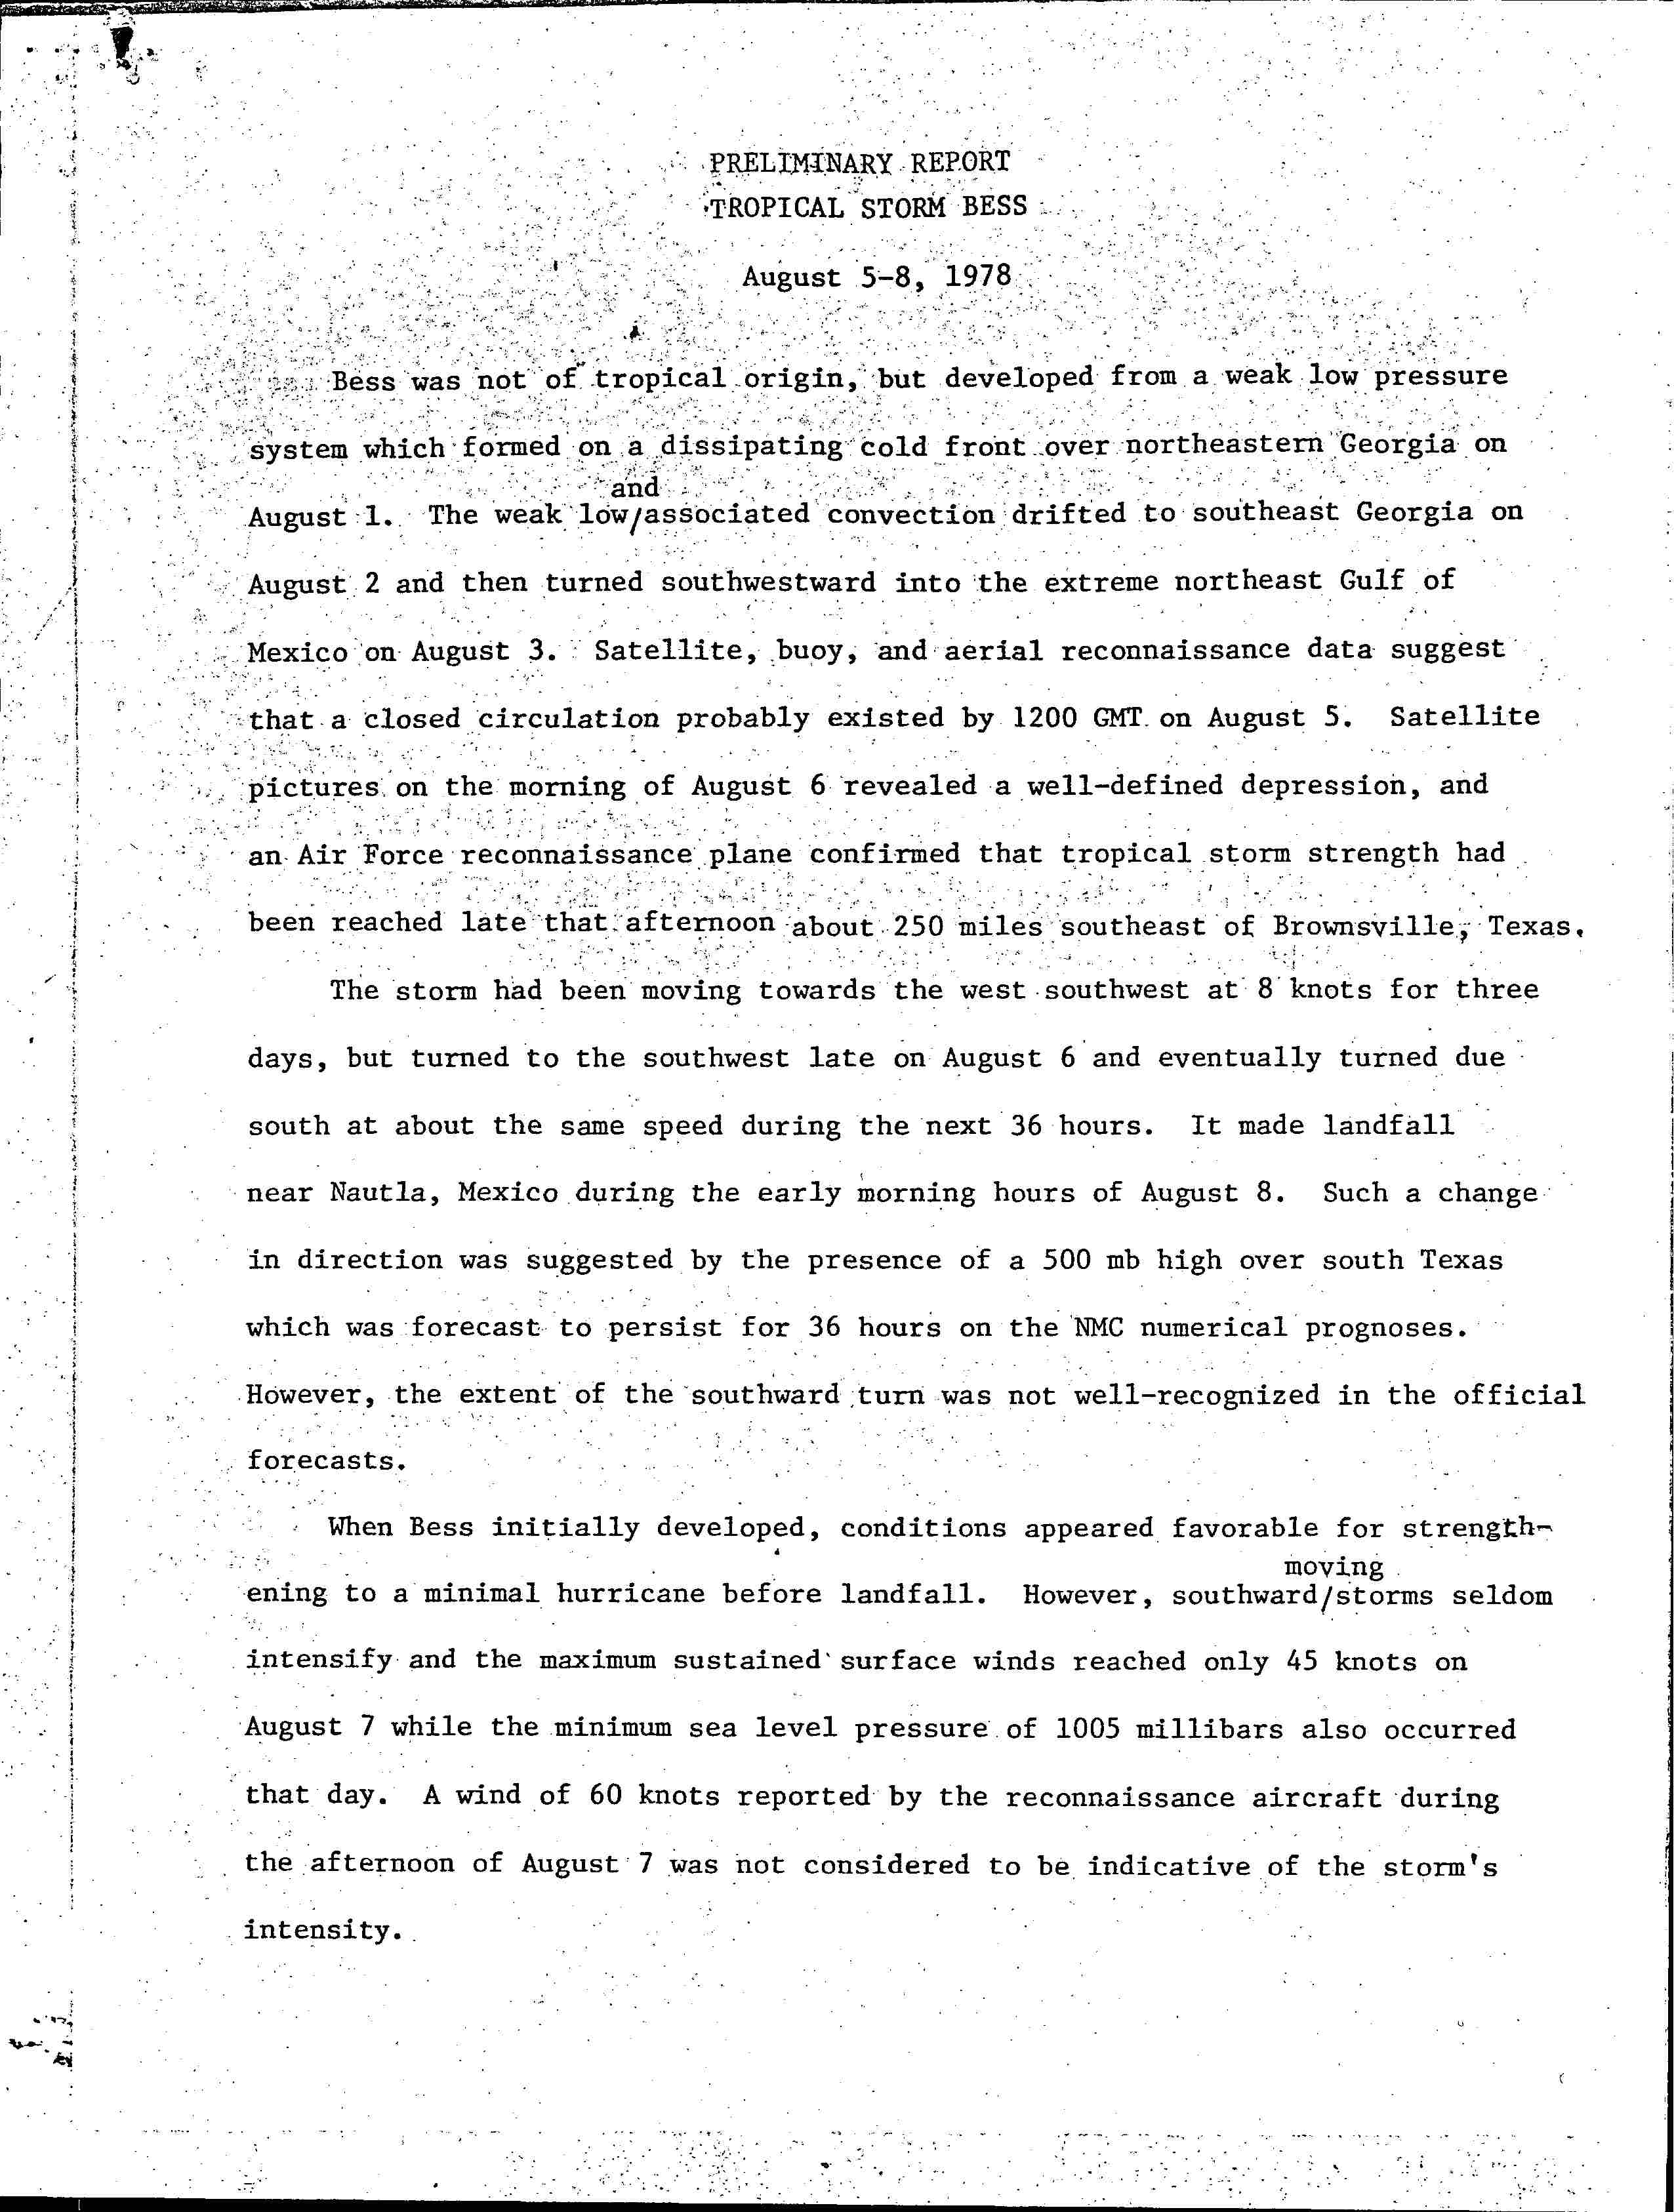
| Bess | August 5–8 | 80 (50) | 1005 | Veracruz, Mexico | None | None | |
| Ten-E | August 6–9 | 55 (35) | Unknown | Hawaiian Islands | None | None | |
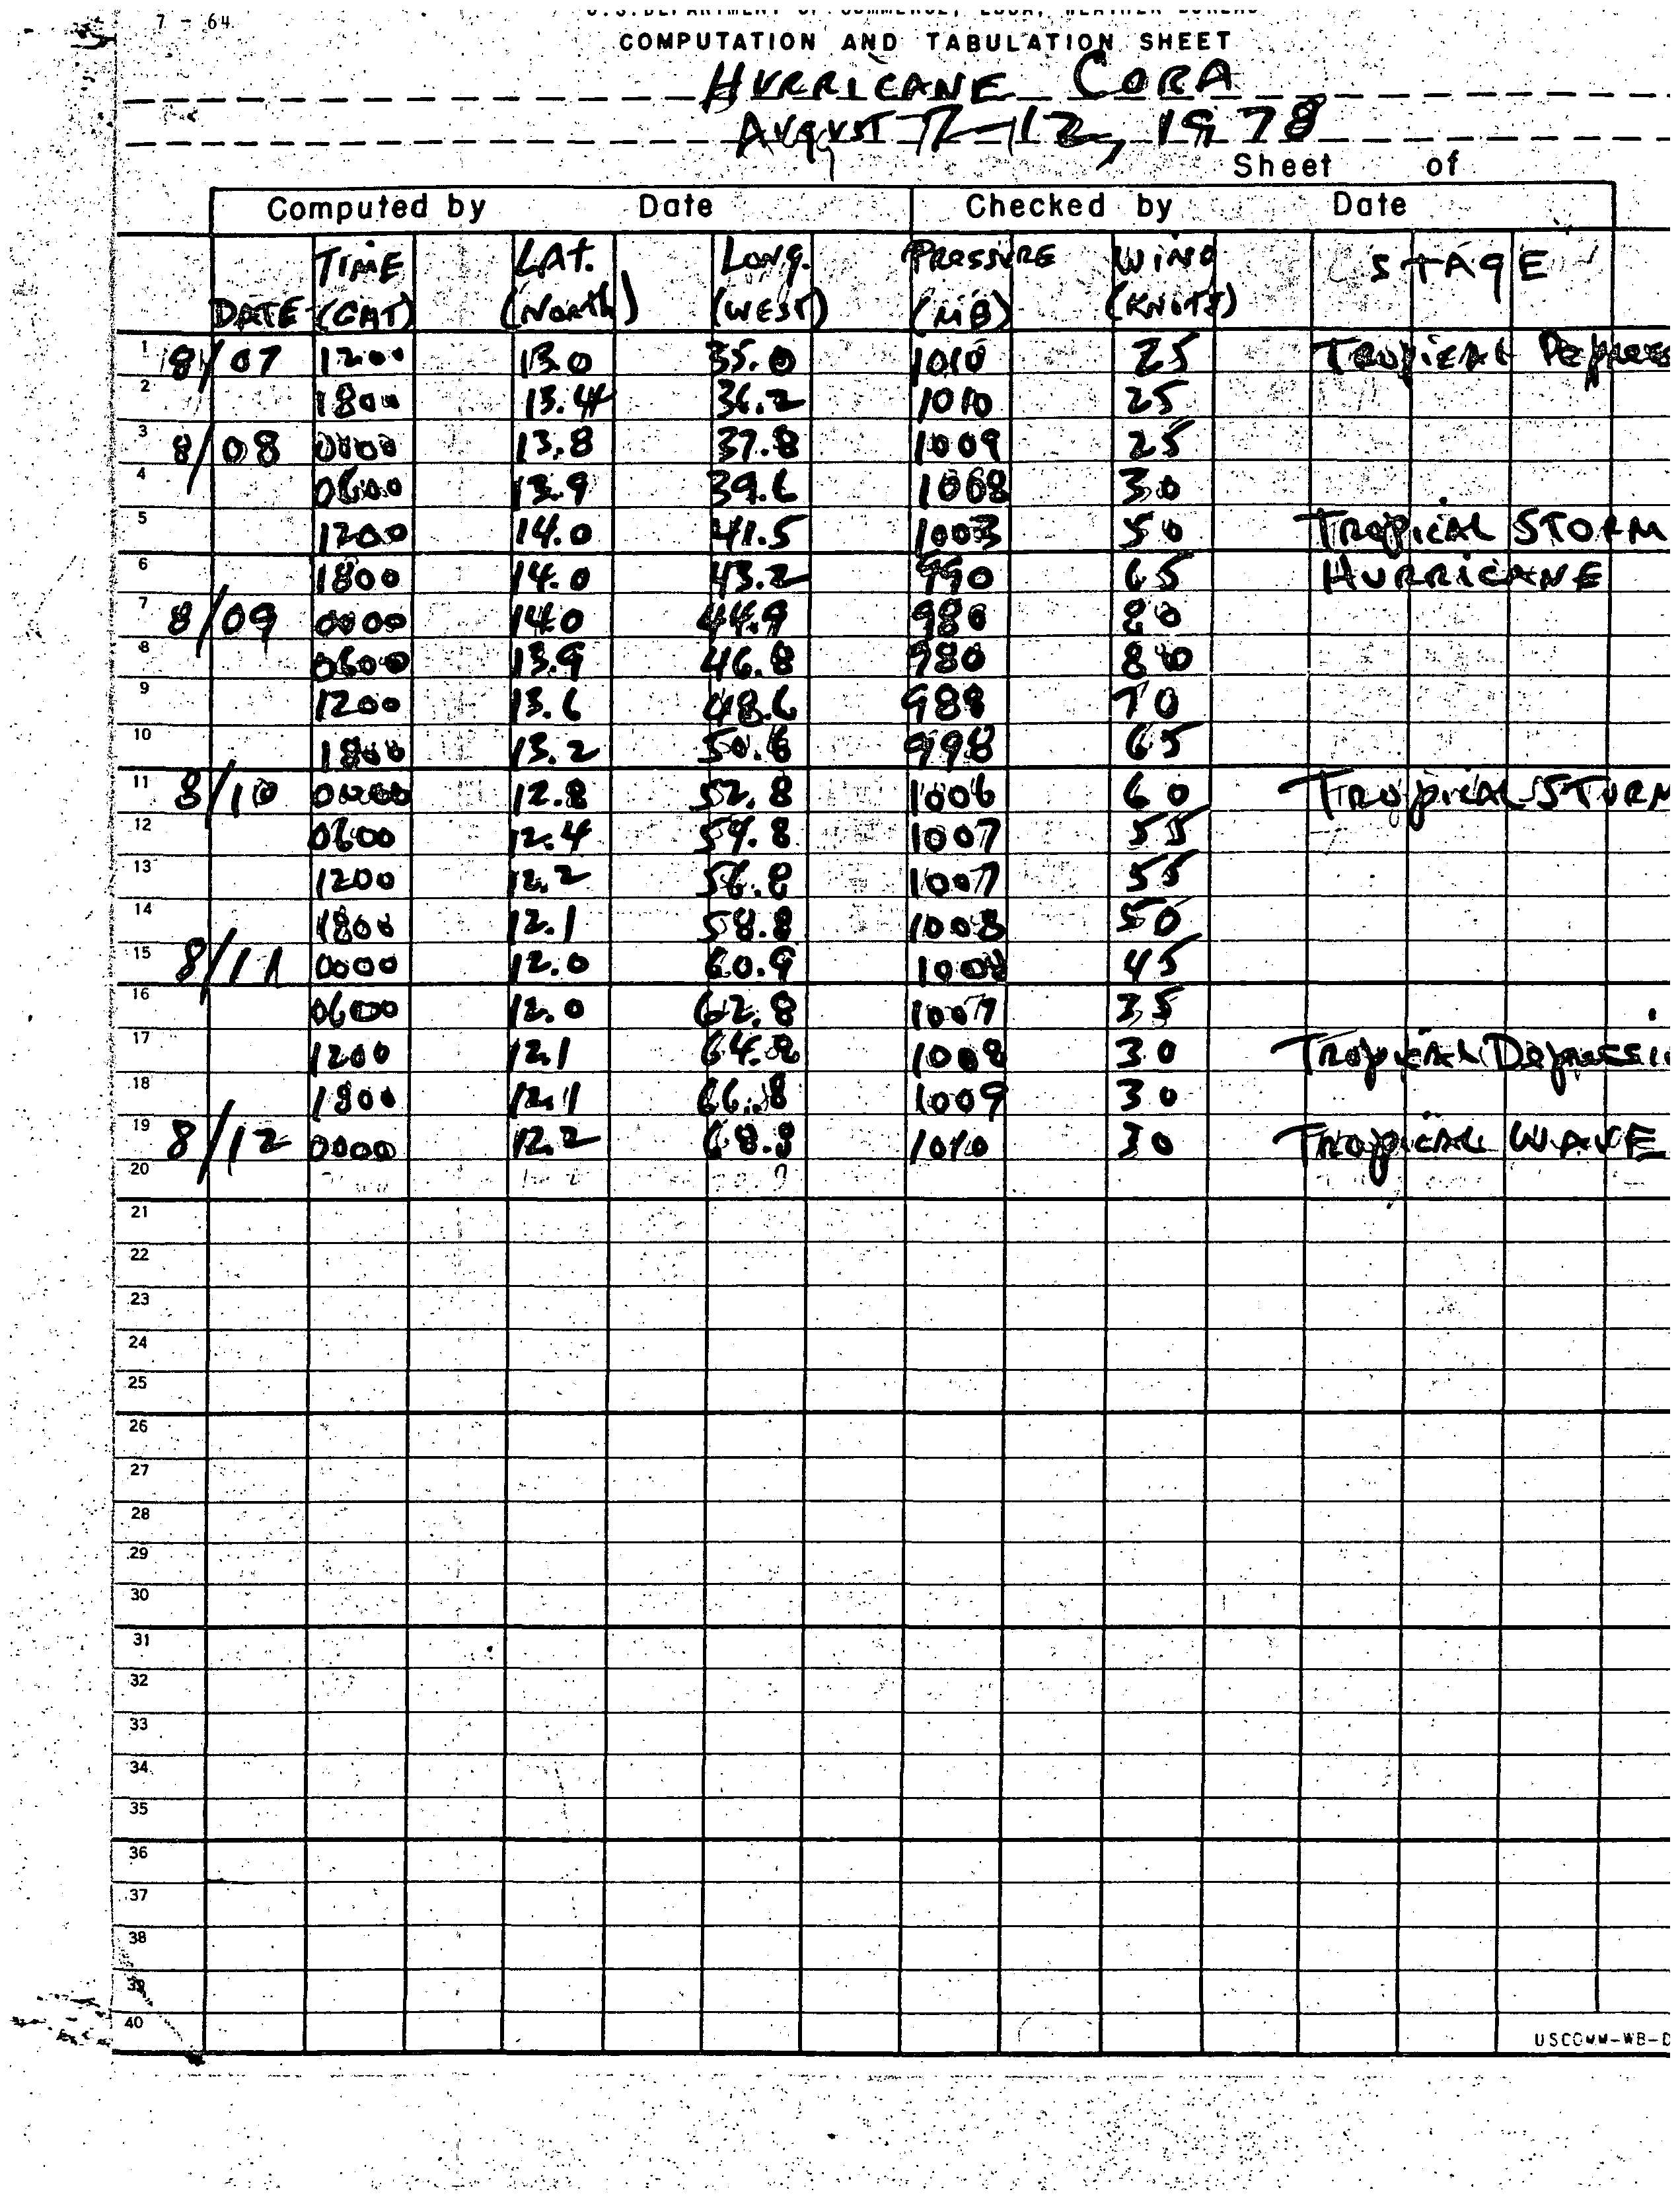
| Cora | August 7–12 | 145 (90) | 980 | Grenada, Maine | Minimal | 1 | |
| Four-L | August 7–11 | 55 (35) | 1008 | Bequia, Nicaragua | None | None | |
| Unnumbered | August 9–10 | 50 (30) | 1015 | Louisiana | None | None | |
| Bonnie | August 9–13 | 95 (60) | 983 | South China, Vietnam | None | None | |
| Carmen | August 9–20 | 145 (90) | 960 | Ryukyu Islands, East China, Korea | US$3 million | 21 | |
| Della | August 9–13 | 95 (60) | 985 | Philippines, Taiwan, China | None | None | |
| Iva | August 11–15 | 120 (75) | Unknown | Hawaiian Islands | None | None | |
| Loleng | August 13–17 | 55 (35) | 1000 | Philippines, South China | None | None | |
| BOB 04 | August 13–17 | Unknown | Unknown | Unknown | Unknown | Unknown | |
| TD | August 14 | Unknown | 1002 | Taiwan | None | None | |
| 13W | August 14–21 | 70 (45) | 998 | Japan | None | None | |
| TD | August 18–19 | Unknown | 1004 | Palau | None | None | |
| John | August 18–30 | 170 (105) | Unknown | None | None | None | |
| Kristy | August 18–28 | 170 (105) | Unknown | None | None | None | |
| Lane | August 19–24 | 80 (50) | Unknown | None | None | None | |
| TD | August 20 | Unknown | 1002 | Taiwan | None | None | |
| Elaine | August 21–29 | 130 (80) | 965 | Philippines, South China | Minor | 1 | |
| TD | August 22–24 | Unknown | 1008 | Korean Peninsula | None | None | |
| Miriam | August 23–September 2 | 145 (90) | Unknown | None | None | None | |
| TD | August 26 | Unknown | 1008 | Ryukyu Islands | None | None | |
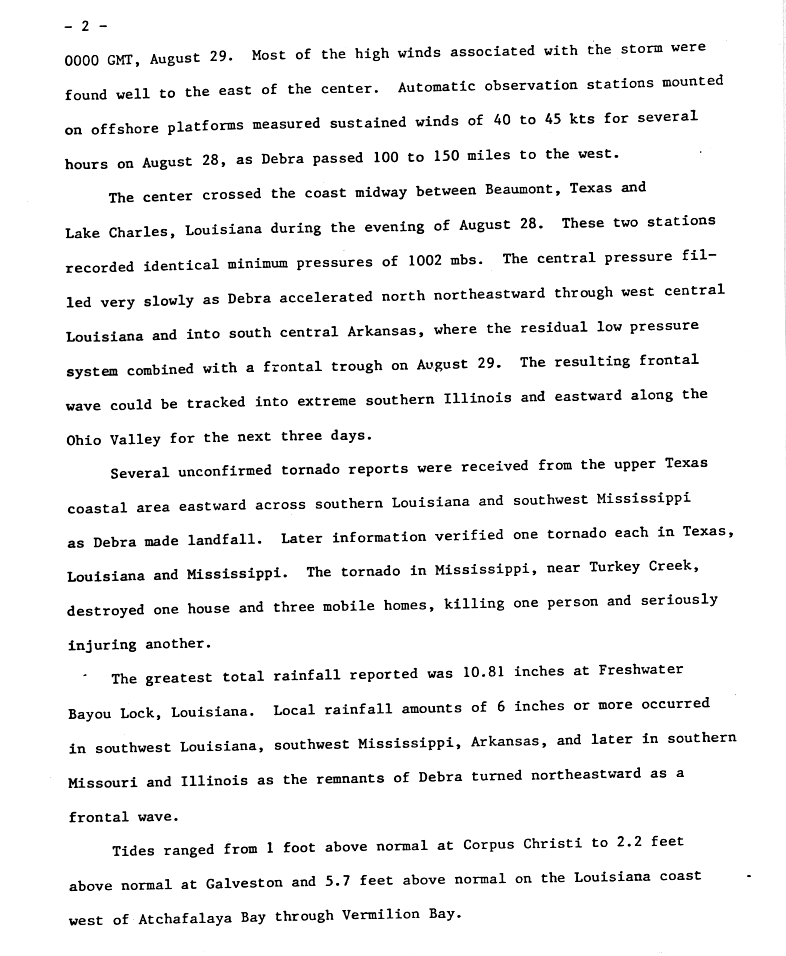
| Debra | August 26–29 | 95 (60) | 1000 | Southern United States, Midwestern United States, Mid-Atlantic states, New England | Minor | 2 | |
| BOB 05 | August 26–September 2 | Unknown | Unknown | Unknown | Unknown | Unknown | |
| Faye | August 27–September 10 | 195 (120) | 935 | Mariana Islands | None | None | |
| Gloria | August 27–31 | 80 (50) | 990 | Ryukyu Islands | None | None | |
| Hester | August 28–September 1 | 95 (60) | 990 | Japan | None | None | |
| Oyang | August 29–30 | 50 (30) | Unknown | Philippines | None | None | |
| Ella | August 30–September 5 | 225 (140) | 956 | East Coast of the United States, Atlantic Canada | None | None | |
| Unnumbered | August 30–September 1 | 55 (35) | 1013 | None | None | None | |
| Norman | August 30–September 7 | 225 (140) | 955 | California | >US$300 million | 8 | |
| TD | August 31–September 2 | Unknown | 1002 | None | None | None |
September

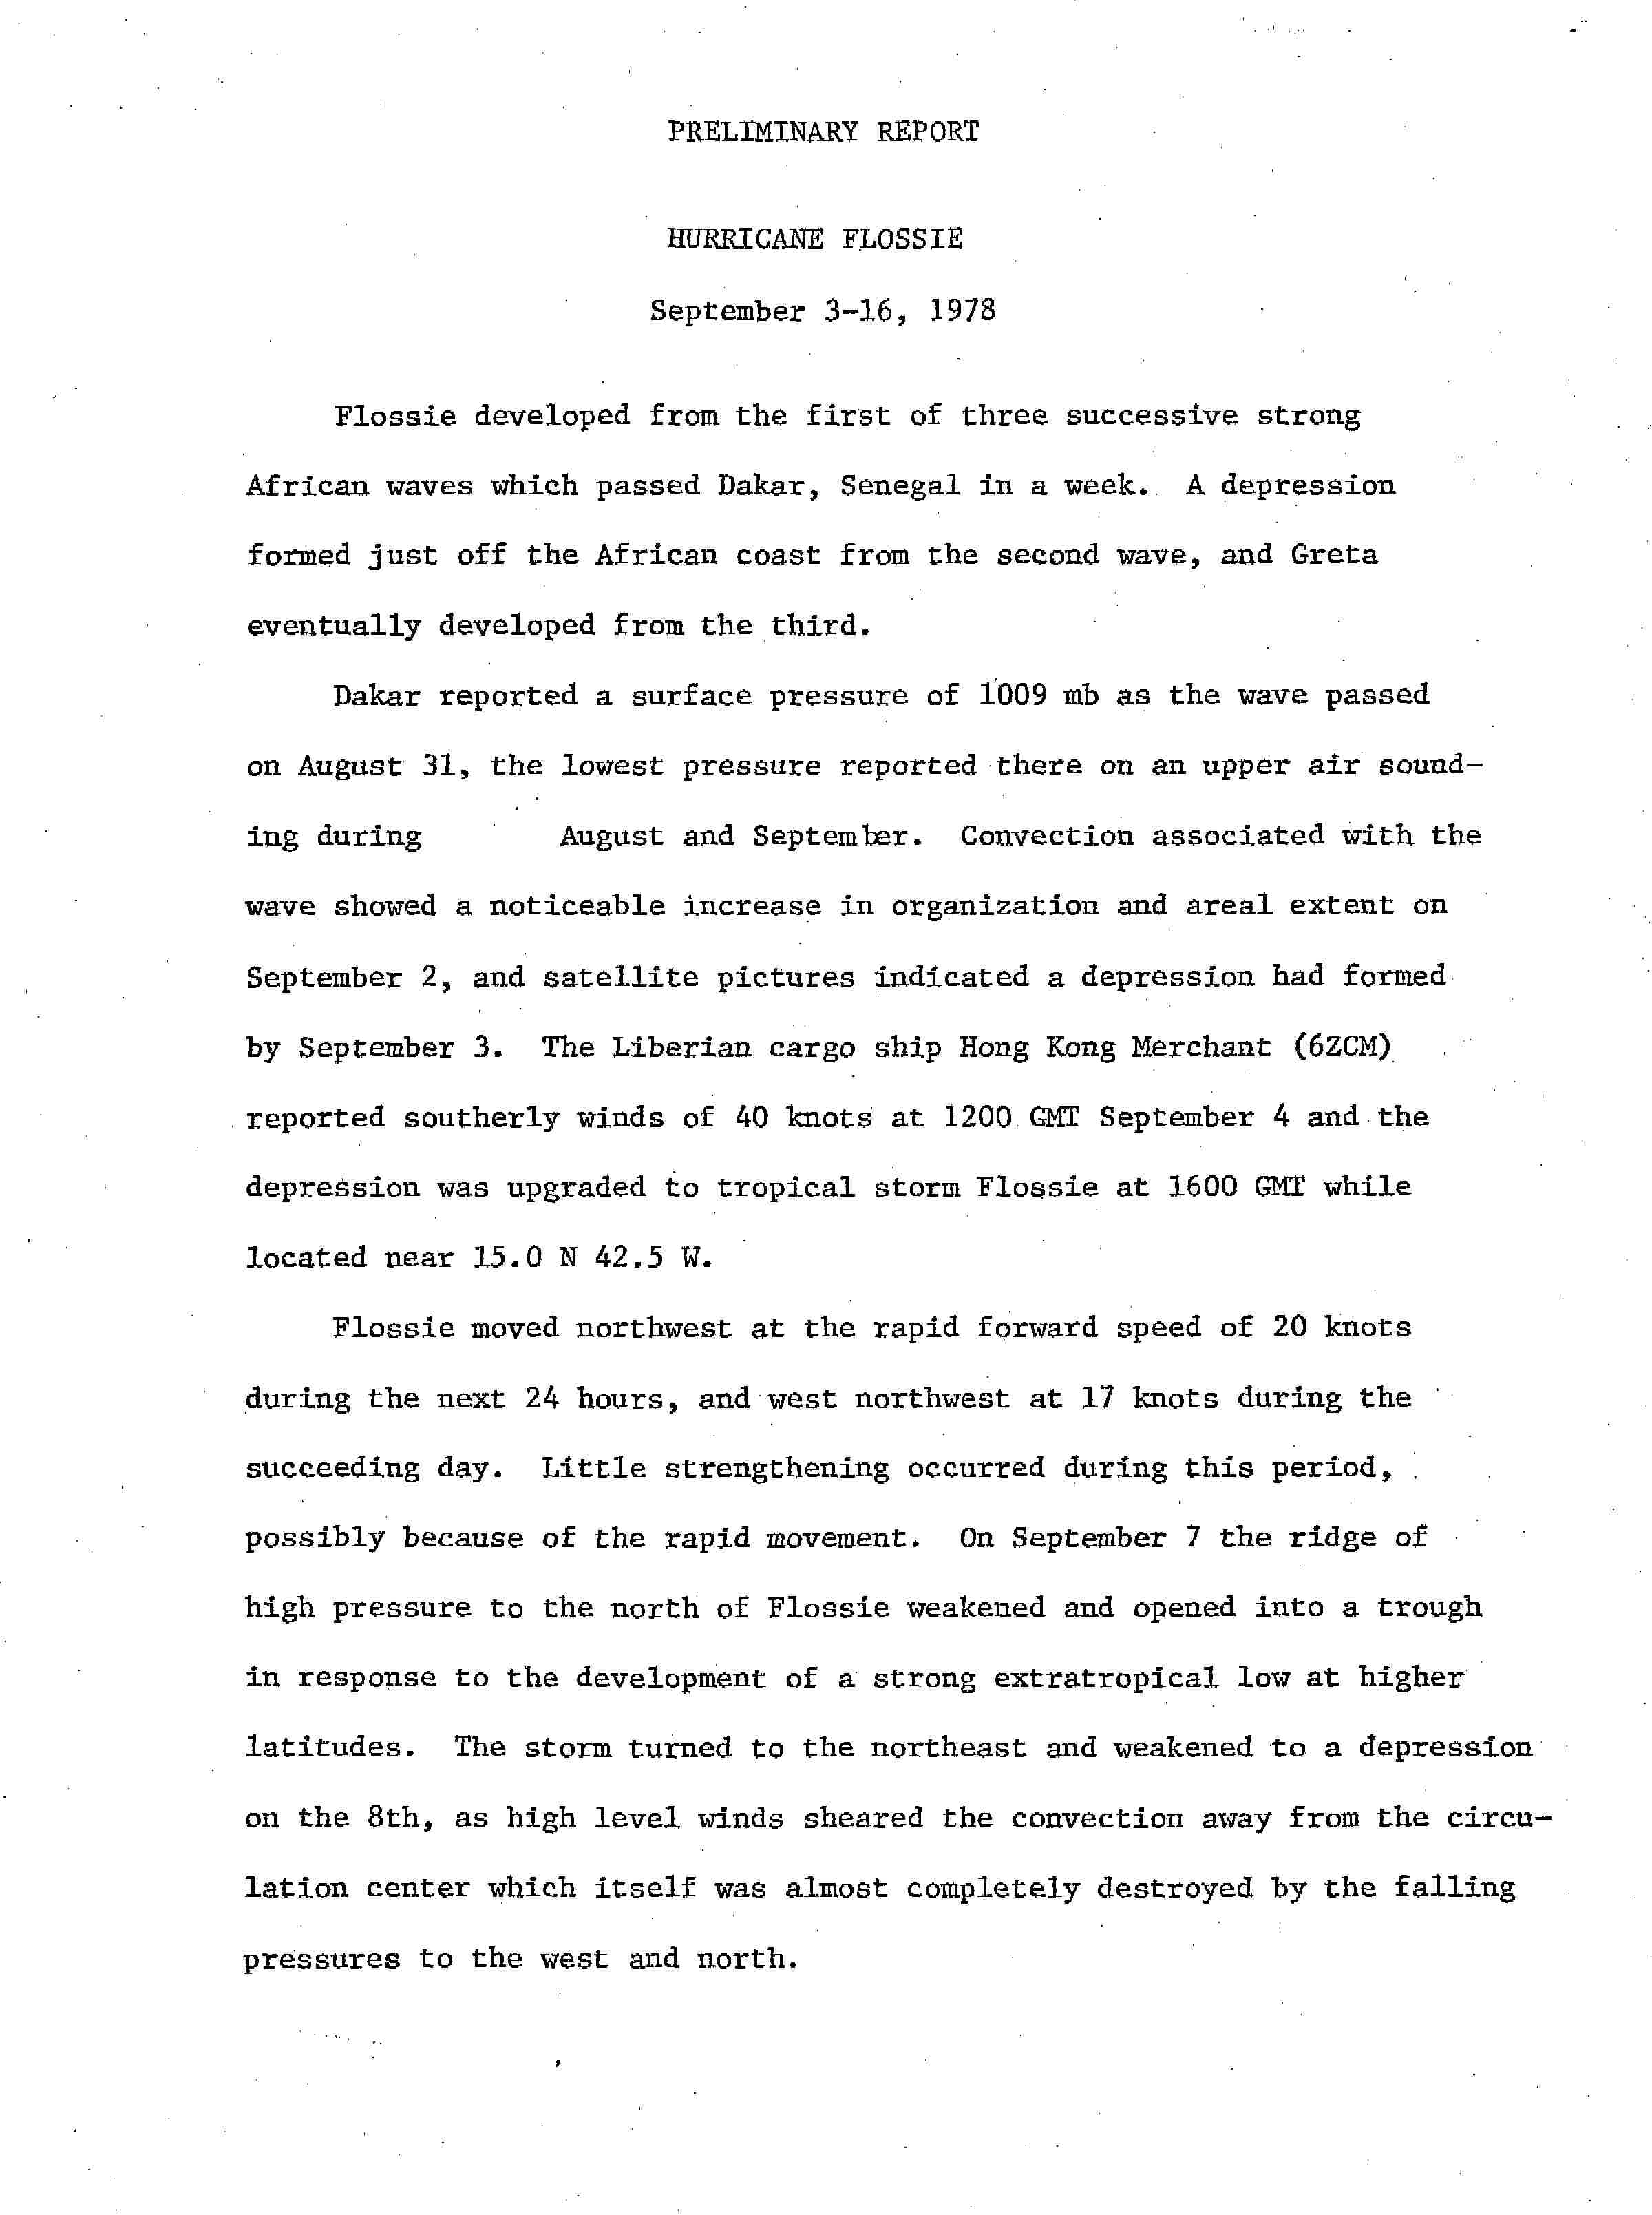
September followed up the previous by becoming another active month, out of the 26 tropical cyclones that formed this month, only ten were named. This excludes the tropical depressions that were unofficially named by PAGASA in September, being Pasing, Susang, and Tering. The strongest storm of the month was Hurricane Greta which made landfall in Honduras at peak intensity as a Category 4 hurricane before crossing into the Eastern Pacific and being renamed to Olivia.[12][75] Other notable storms in September included Hurricane Flossie and Typhoon Judy which peaked as Category 2-equivalent storms out to sea.[76][71] Typhoon Irma was the deadliest storm of the month, killing six people in Japan.[77][78] Followed by Kit and Lola which both struck Southeast Asia consecutively later in the month.[71]
| Storm name | Dates active | Max wind km/h (mph) |
Pressure (hPa) |
Areas affected | Damage (USD) |
Deaths | Refs |
|---|---|---|---|---|---|---|---|
| LAND 02 | September 1–5 | Unknown | Unknown | Unknown | Unknown | Unknown | |
| TD | September 2–7 | Unknown | 1002 | Taiwan, Ryukyu Islands | None | None | |
| Eight-L | September 3–11 | 55 (35) | 1009 | None | None | None | |
| Flossie | September 4–15 | 160 (100) | 976 | None | None | None | |
| Nine-L | September 8–10 | 55 (35) | 1003 | Tamaulipas | None | None | |
| Seventeen-E | September 8–9 | 50 (30) | Unknown | None | None | None | |
| Irma | September 9–15 | 120 (75) | 970 | Taiwan, Ryukyu Islands, Japan | None | 6 | |
| Pasing | September 9–15 | 55 (35) | 1004 | Vietnam | None | None | |
| Judy | September 9–17 | 170 (105) | 950 | None | None | None | |
| TD | September 10–11 | 55 (35) | 1006 | Taiwan | None | None | |
| Hope | September 11–21 | 105 (65) | 987 | None | None | None | |
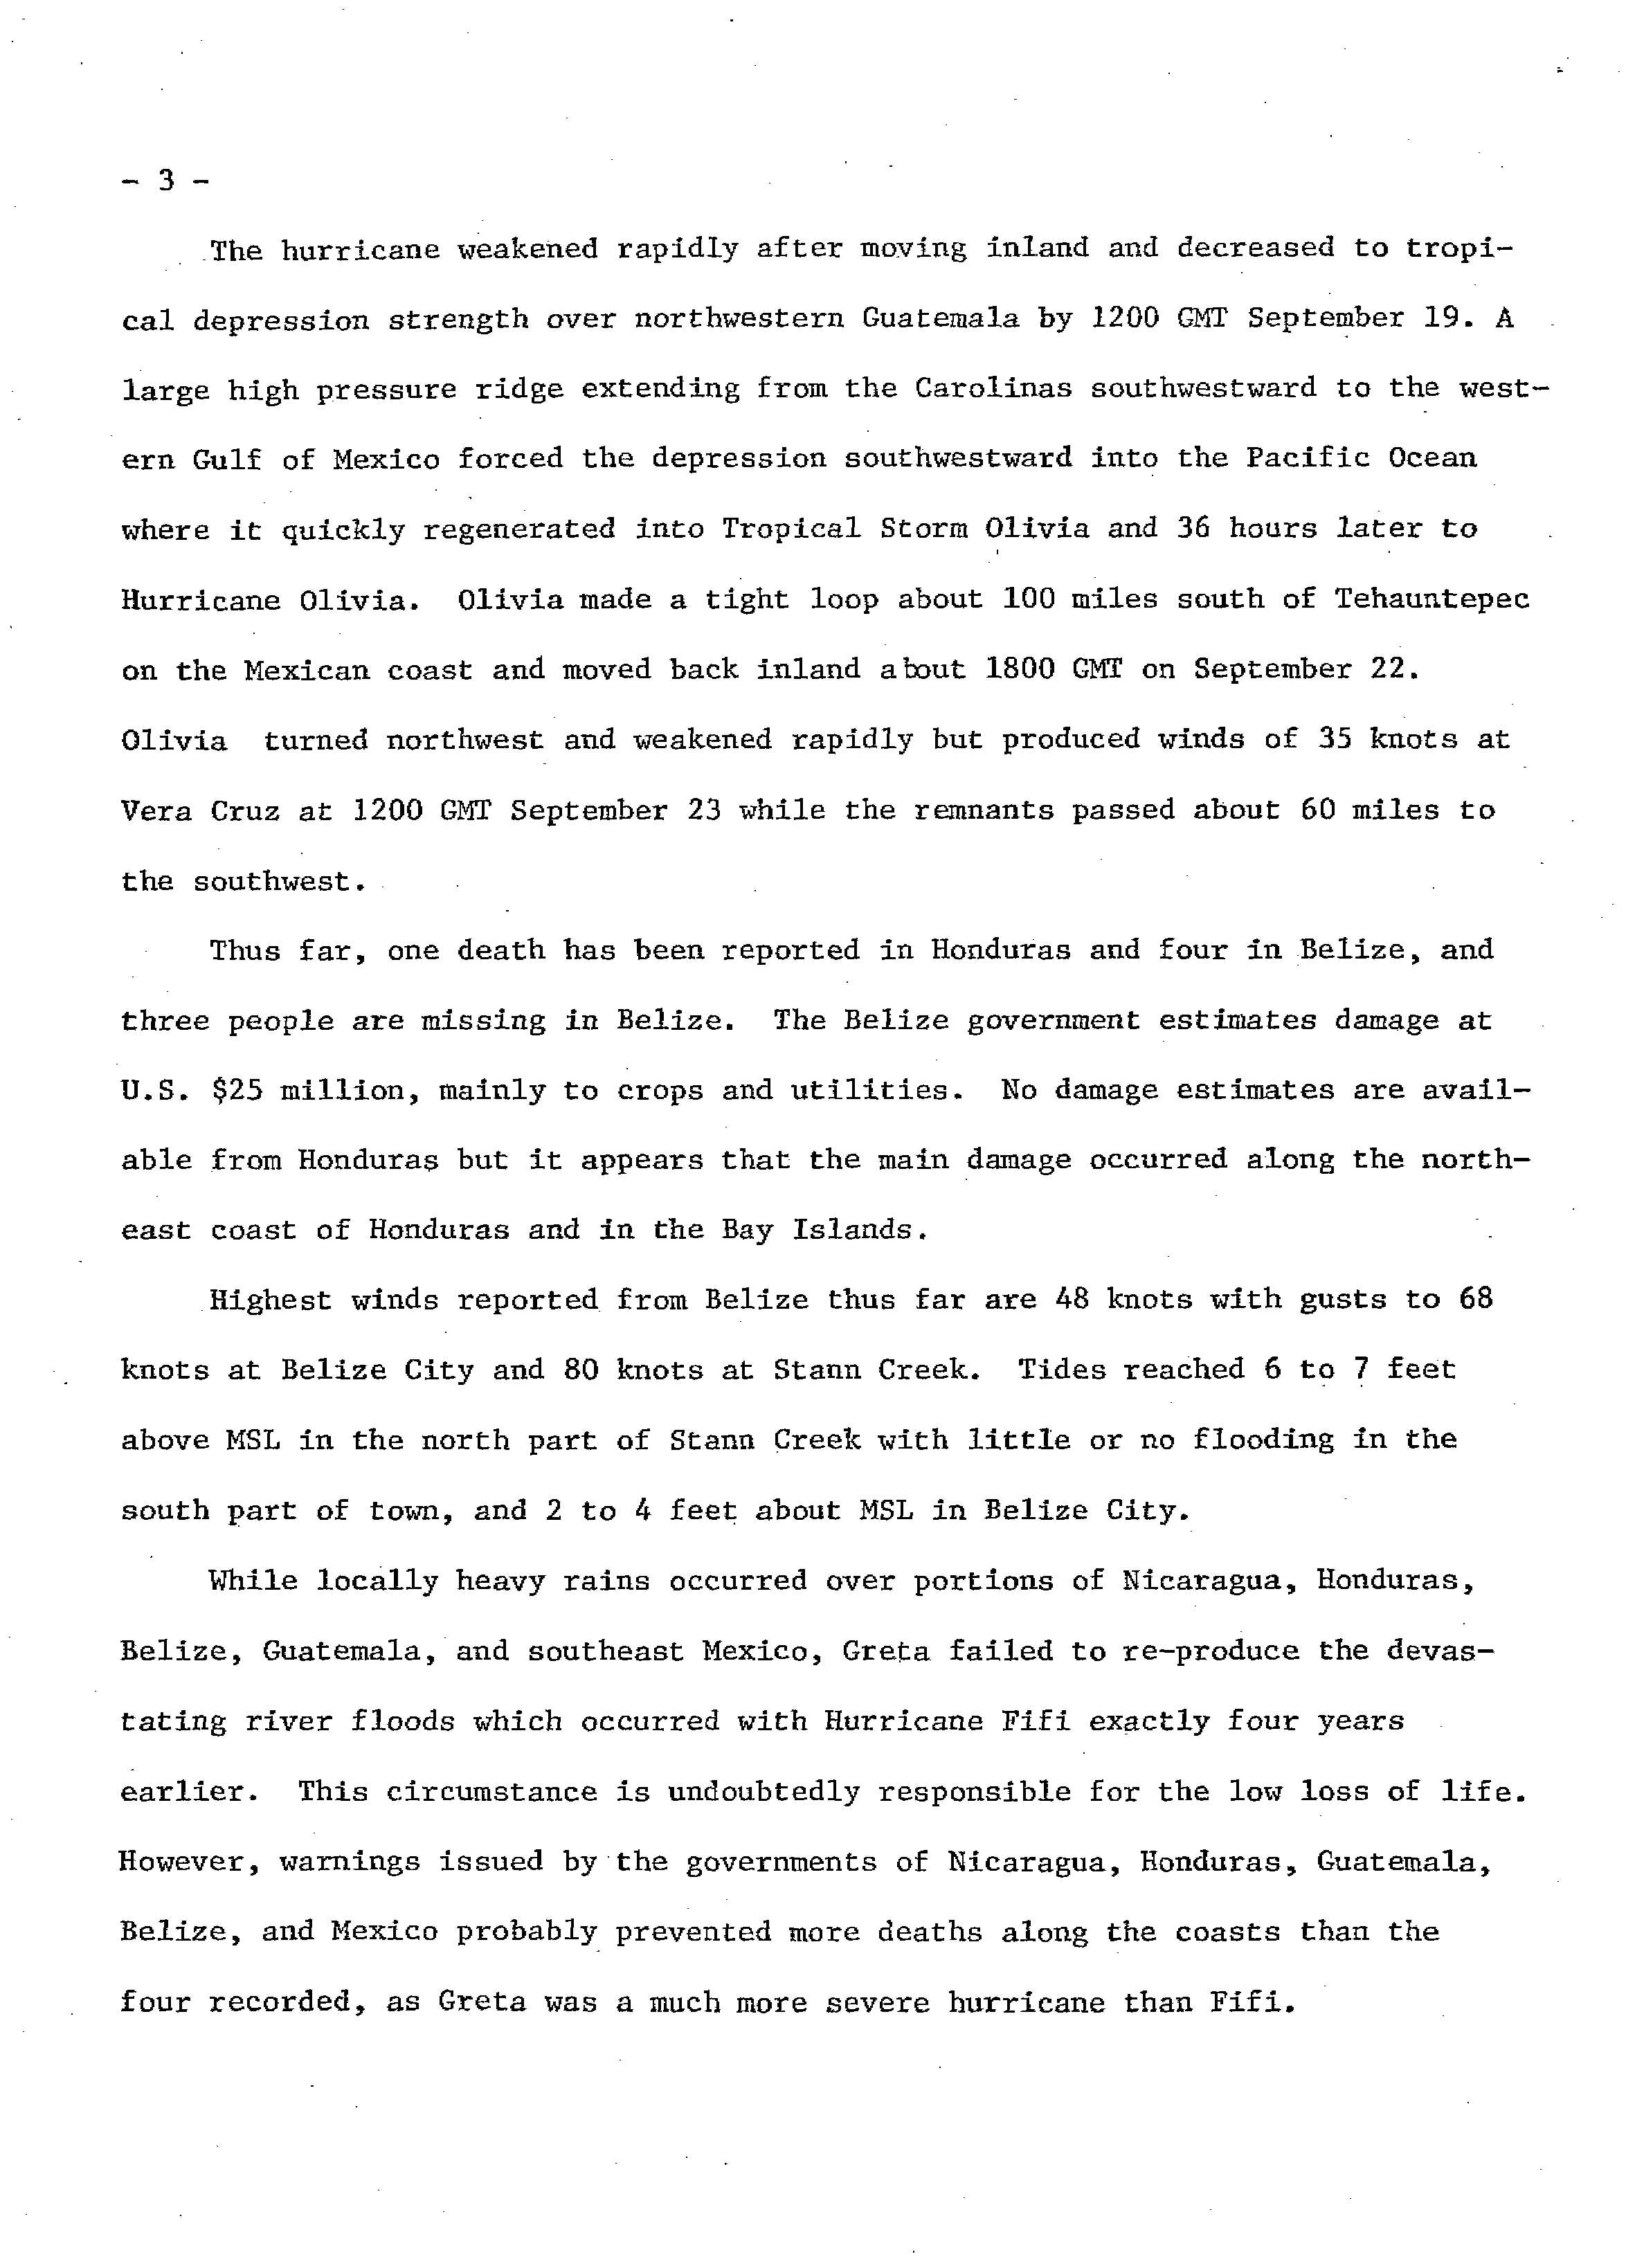
| Greta | September 13–20 | 210 (130) | 947 | Netherlands Antilles, Honduras,Belize, Mexico | US$25 million | 5 | |
| Susang | September 13–19 | 55 (35) | 1000 | Palau, Philippines, Vietnam | None | None | |
| BOB 06 | September 15–16 | Unknown | Unknown | Unknown | Unknown | Unknown | |
| TD | September 17 | Unknown | 1008 | Palau | None | None | |
| Twelve-L | September 18–29 | 55 (35) | 1008 | None | None | None | |
| Olivia | September 20–23 | 120 (75) | Unknown | Chiapas | None | None | |
| Kit | September 20–28 | 115 (70) | 980 | Philippines, South China, Vietnam | Unknown | Unknown | |
| Unnumbered | September 21–23 | 55 (35) | 1001 | Veracruz | None | None | |
| BOB 07 | September 21 | Unknown | Unknown | Unknown | Unknown | Unknown | |
| Tering | September 21–22 | 55 (35) | 998 | Philippines | None | None | |
| TD | September 21–22 | Unknown | 1008 | Ryukyu Islands | None | None | |
| Paul | September 23–27 | 70 (45) | Unknown | Northern Mexico | None | None | |
| Lola | September 24–October 5 | 145 (90) | 965 | Philippines, South China | Unknown | Unknown | |
| LAND 03 | September 26–30 | Unknown | Unknown | Unknown | Unknown | Unknown | |
| Mamie | September 30–October 5 | 130 (80) | 960 | None | None | None |
October

October was slightly less active than the previous two months, featuring nineteen tropical cyclones that formed this month with ten of them being named, excluding the PAGASA-named Bidang which was tagged as 26W by the JTWC.[71][79] Early October featured Tropical Storm Nina, a long-lived Western Pacific storm that went on to impact Vietnam and China, killing 59 people.[80] Ora and Phyllis were late season Category 2-equivalent typhoons that both did not cause any reported damage, the latter staying out to sea.[81][82][83] The month concluded with dual Pacific storms Sergio and Susan, the latter becoming a Category 4 hurricane in the Central Pacific.[84][19] Hurricane Kendra, with its precursor stages causing flooding and damage in Puerto Rico that led to the death of one person.[85][86] And Typhoon Rita which not only became the strongest storm of the month, but the strongest storm of the year as it peaked with a minimum central pressure of 878 mbar (25.93 inHg), the seventh-lowest ever recorded globally.[87] Rita went on to make landfall in Luzon at Category 4 intensity, causing catastrophic damage that killed at least 444 people in the Philippines.[22][23][87][21]
| Storm name | Dates active | Max wind km/h (mph) |
Pressure (hPa) |
Areas affected | Damage (USD) |
Deaths | Refs |
|---|---|---|---|---|---|---|---|
| Irma | October 2–5 | 80 (50) | 998 | Azores | None | None | |
| BOB 08 | October 2–6 | Unknown | Unknown | Unknown | Unknown | Unknown | |
| Rosa | October 2–7 | 135 (85) | Unknown | None | None | None | |
| TD | October 5 | Unknown | 1004 | None | None | None | |
| Nina | October 5–17 | 115 (70) | 975 | Philippines, South China, Vietnam | Unknown | 59 | |
| Juliet | October 7–11 | 80 (50) | 1006 | Puerto Rico, Bermuda | None | None | |
| Ora | October 8–15 | 170 (105) | 940 | Taiwan, Ryukyu Islands | None | None | |
| 25W | October 11–14 | 55 (35) | 1000 | None | None | None | |
| Bidang | October 11–17 | 55 (35) | 1004 | Caroline Islands, Philippines | None | None | |
| Unnumbered | October 13–17 | 55 (35) | 992 | None | None | None | |
| Phyllis | October 15–23 | 175 (110) | 950 | None | None | None | |
| Rita | October 17–30 | 280 (175) | 878 | Caroline Islands, Mariana Islands, Philippines | US$100 million | ≥444 | |
| Susan | October 18–24 | 210 (130) | 954 | None | None | None | |
| Sergio | October 18–21 | 65 (40) | Unknown | None | None | None | |
| BOB 09 | October 25–28 | 70 (45) | Unknown | Bangladesh | Unknown | Unknown | |
| Unnumbered | October 26–29 | 50 (30) | 1008 | None | None | None | |
| Kendra | October 28–November 1 | 130 (80) | 990 | Puerto Rico, East Coast of the United States | US$6 million | 1 | |
| Twenty-seven | October 29–November 3 | 95 (60) | 992 | Philippines, Vietnam | None | None | |
| Tess | October 31–November 7 | 115 (70) | 975 | None | None | None |
November

November was an average month in terms of tropical cyclone formation, eleven formed though only three were named out of them, excluding Tropical Depression Delang which was unofficially named by PAGASA.[note 3][88] The month started with the final tropical cyclone of this year’s Atlantic hurricane season, a short-lived tropical depression off the U.S. East Coast that dissipated about 275 mi (443 km) east of Virginia Beach, Virginia.[64] BOB 10 was the only North Indian cyclone to intensify beyond Cyclonic Storm status in the Arabian Sea this year.[89] Typhoon Viola was the strongest storm of the month peaking as a Category 4 typhoon in the Philippine Sea without causing any damage.[90] BOB 11 was not only the most destructive and deadliest storm of the month but the most destructive and deadliest of the year after devastating Sri Lanka, 915 people lost their lives as a result of the deadly cyclone as it caused $627 million in damages.[2]
| Storm name | Dates active | Max wind km/h (mph) |
Pressure (hPa) |
Areas affected | Damage (USD) |
Deaths | Refs |
|---|---|---|---|---|---|---|---|
| Unnumbered | November 3–5 | 55 (35) | 1006 | None | None | None | |
| BOB 10 | November 3–13 | 145 (90) | 940 | India, Pakistan | Unknown | Unknown | |
| TD | November 9–11 | Unknown | 1008 | Vietnam | None | None | |
| TD | November 10–12 | Unknown | 1004 | Philippines | None | None | |
| TD | November 15–16 | Unknown | 1004 | Vietnam | None | None | |
| Delang | November 16–20 | 55 (35) | 1008 | Philippines | None | None | |
| Viola | November 17–24 | 235 (145) | 910 | Caroline Islands | None | None | |
| BOB 11 | November 17–29 | 170 (105) | 938 | Sri Lanka, India | US$627 million | 915 | |
| 01S | November 19–23 | 70 (45) | Unknown | None | None | None | |
| TD | November 25–December 1 | Unknown | 1004 | Malaysia | None | None | |
| Winnie | November 25–30 | 115 (70) | 975 | Mariana Islands | None | None |
December

The final month of the year was significantly less active than the previous months, with only five tropical cyclones forming and two being named from them, excluding PAGASA-named Tropical Depression Garding. The month started off concluding this year’s Pacific typhoon season with the formations of a tropical depression classified by the Japan Meteorological Agency (JMA) and the previously aforementioned Garding, a short lull separated the two systems.[91] Tropical Storm 03S formed in the Australian region, crossing into the South-West Indian Ocean before dissipating.[28] Cyclone Fay impacted Fiji late in the month kickstarting the 1978–79 South Pacific cyclone season.[38][37][39] The strongest and deadliest tropical cyclone of the month was Cyclone Angele which ravaged portions of Mozambique and Madagascar whilst moving slowly in the Mozambique Channel, peaking as a strong Category 3-equivalent cyclone, killing 74.[29] The last tropical cyclone of the year was Cyclone Peter which impacted the Cape York Peninsula and the surrounding areas of the Gulf of Carpentaria causing $10 million in damages and the lives of two,[92] Peter later crossed into the New Year before dissipating on January 4.[93][34]
| Storm name | Dates active | Max wind km/h (mph) |
Pressure (hPa) |
Areas affected | Damage (USD) |
Deaths | Refs |
|---|---|---|---|---|---|---|---|
| TD | December 4 | Unknown | 1008 | None | None | None | |
| Garding | December 13–19 | 55 (35) | 1004 | Philippines | Unknown | None | |
| Angele | December 13–29 | 200 (125) | 941 | Mozambique, Madagascar | Unknown | 74 | |
| 03S | December 20–26 | 105 (65) | Unknown | None | None | None | |
| Fay | December 27–31 | 105 (65) | 980 | Fiji | Unknown | Unknown | |
| Peter | December 29–January 4 | 145 (90) | 980 | Far North Queensland, Arnhem Land | US$10 million | 2 |
References
- ↑ The Eastern Pacific Hurricane Center (EPHC) was the RSMC responsible for tracking tropical cyclones east of 140°W until the National Hurricane Center (NHC) took responsibility in the Spring of 1988.
- ↑ The Eastern Pacific Hurricane Center (EPHC) was the RSMC responsible for tracking tropical cyclones east of 140°W until the National Hurricane Center (NHC) took responsibility in the Spring of 1988.
- ↑ Tropical Depression Delang was tagged 30W by the Joint Typhoon Warning Center.
- 1 2 "WP281978 - IBTrACS - International Best Track Archive for Climate Stewardship". ncics.org. Retrieved 2026-07-14.
- 1 2 3 "Batticaloa's blackest day". Archived from the original on 2015-09-24. Retrieved 2013-12-05.
- ↑ Mberego, Seth. "The 1977-1978 El Niño Event" (PDF). ResearchGate. Archived from the original (PDF) on 2026-07-19.
- ↑ NOAA's Climate Prediction Center. "NOAA's Climate Prediction Center". www.cpc.ncep.noaa.gov. Archived from the original on 2026-07-18. Retrieved 2026-07-19.
- 1 2 3 Miles B. Lawrence (April 1979). Atlantic Hurricane Season of 1978 (PDF) (Report). Miami, Florida: National Hurricane Center; National Weather Service; National Oceanic and Atmospheric Administration. Archived (PDF) from the original on September 23, 2008. Retrieved June 3, 2014.
- ↑ "Hurricane Bob?". Wilmington Morning Star. May 13, 1978. Retrieved July 20, 2023 – via Google News.
- ↑ "Hurricanes Frequently Asked Questions". Miami, Florida: Atlantic Oceanographic and Meteorological Laboratory. June 1, 2023. Retrieved July 20, 2023.
- 1 2 3 David M. Roth (January 17, 2010). Texas Hurricane History (PDF). Weather Prediction Center (Report). Camp Springs, Maryland: National Oceanic and Atmospheric Administration. Retrieved June 3, 2014.
- 1 2 Paul J. Hebert (1978). Preliminary Report Tropical Storm Bess. National Hurricane Center (Report). Miami, Florida: National Oceanic and Atmospheric Administration. p. 1. Retrieved January 1, 2013.
- ↑ Pelisser, Joseph M. (1978). "Tropical Storm Debra Preliminary Report". National Hurricane Center. National Oceanic and Atmospheric Administration. p. 2. Retrieved 2011-06-30.
- 1 2 Miles B. Lawrence (1978). "Hurricane Ella Preliminary Report". National Hurricane Center. Retrieved 2010-03-27.
- 1 2 Hurricane Greta and Hurricane Olivia Preliminary Report (JPG) (Report). National Hurricane Center. p. 3. Retrieved 2013-12-20.
- ↑ Charles H. Fletcher III; Eric E. Grossman; Bruce M. Richmond; Ann E. Gibbs (January 9, 2002). Atlas of Natural Hazards in the Hawaiian Coastal Zone (PDF) (Report). United States Geological Survey. p. 23. Retrieved January 4, 2022.
- ↑ Samuel L. Shaw (1979). "The Pacific Cyclone Season". Weatherwise. 32 (4). Taylor & Francis: 166–169. doi:10.1080/00431672.1979.9930091. Retrieved January 5, 2022.
- ↑ "Hurricanes: Frequently Asked Questions". Atlantic Oceanographic and Meteorological Laboratory. National Oceanic and Atmospheric Administration. Retrieved January 5, 2022.
- 1 2 Donald R. Cochran. Hurricane Fico (1978) - A Record Setter (PDF) (Report). National Weather Association. Retrieved January 6, 2022.
- 1 2 The State of Hawaii Data Book (2000). "Geography and Environment of Hawaii" (PDF). Archived (PDF) from the original on 2012-11-05. Retrieved 2006-12-10.
- 1 2 "Hurricane Norman - September 4–7, 1978". Weather Prediction Center. Retrieved January 6, 2022.
- 1 2 Emil B. Gunther (July 1979). "Eastern North Pacific Tropical Cyclones of 1978". Monthly Weather Review. 107 (7). American Meteorological Society: 911. Bibcode:1979MWRv..107..911G. doi:10.1175/1520-0493(1979)107<0911:ENPTCO>2.0.CO;2.
- 1 2 Tropical Cyclones 1978 (PDF). Central Pacific Hurricane Center (Report). National Hurricane Center. Retrieved January 5, 2022.
- 1 2 3 "Philippine Islands hit by Typhoon". The Spokesperson-Review. Associated Press. October 27, 1978. Retrieved May 18, 2013.
- 1 2 United Press International (October 31, 1978). "Philippines Storm Toll Now 200". The Youngstown Vindicator. Retrieved May 18, 2013.
- 1 2 "34 Dead In Rita's Wake". The Lakeland Ledger. Associated Press. October 29, 1978. Retrieved May 19, 2013.
- 1 2 "WP021978 - IBTrACS - International Best Track Archive for Climate Stewardship". ncics.org. Retrieved 2026-07-15.
- 1 2 "SH261978 - IBTrACS - International Best Track Archive for Climate Stewardship". ncics.org. Retrieved 2026-07-15.
- 1 2 3 "SH131978 - IBTrACS - International Best Track Archive for Climate Stewardship". ncics.org. Retrieved 2026-07-15.
- 1 2 Tropical Storm Kiki, 4-9 March. National Climatic Data Center (Report). Global tropical/extratropical cyclone climatic atlas. 1996. Retrieved February 7, 2019.
- 1 2 "SH031979 - IBTrACS - International Best Track Archive for Climate Stewardship". ncics.org. Retrieved 2026-07-19.
- 1 2 Johns Hopkins Bloomberg School of Public Health (2013). "Historical event review". Johns Hopkins Bloomberg School of Public Health. Archived from the original on 3 January 2013. Retrieved 23 April 2013.
- ↑ "SH121978 - IBTrACS - International Best Track Archive for Climate Stewardship". ncics.org. Retrieved 2026-07-19.
- 1 2 "SH311978 - IBTrACS - International Best Track Archive for Climate Stewardship". ncics.org. Retrieved 2026-07-15.
- 1 2 "SH271978 - IBTrACS - International Best Track Archive for Climate Stewardship". ncics.org. Retrieved 2026-07-15.
- 1 2 Perth Tropical Cyclone Warning Centre (2010). "Tropical Cyclone Alby Report" (PDF). Australian Bureau of Meteorology. Retrieved 29 January 2011.
- 1 2 Tropical Cyclone Peter (Report). Bureau of Meteorology. Retrieved 15 January 2016.
- 1 2 "SH111978 - IBTrACS - International Best Track Archive for Climate Stewardship". ncics.org. Retrieved 2026-07-15.
- 1 2 "SH321978 - IBTrACS - International Best Track Archive for Climate Stewardship". ncics.org. Retrieved 2026-07-15.
- 1 2 DeAngelis, Dick (March 1979). "Hurricane Alley: Southern Hemisphere, November and December". Mariners Weather Log. Vol. 23, no. 2. National Oceanic and Atmospheric Administration. https://books.google.com/books?id=enMTAAAAYAAJ.
- 1 2 "1978 Tropical Cyclone (Storm) FAY". International Best Track Archive for Climate Stewardship (IBTrACS). Retrieved July 28, 2024.
- 1 2 Krishna, R (October 1981). "1978-79 Cyclone Season". Tropical Cyclones in Fiji, November 1969 to April 1980 (Report). Nadi, Fiji: Fiji Meteorological Service. pp. 10–13.
- ↑ "WP211977 - IBTrACS - International Best Track Archive for Climate Stewardship". ncics.org. Retrieved 2026-07-15.
- ↑ "SH101978 - IBTrACS - International Best Track Archive for Climate Stewardship". ncics.org. Retrieved 2026-07-15.
- ↑ "WP011978 - IBTrACS - International Best Track Archive for Climate Stewardship". ncics.org. Retrieved 2026-07-15.
- ↑ Tropical Storm Huberte, 26-31 January. National Climatic Data Center (Report). Global tropical/extratropical cyclone climatic atlas. 1996. Retrieved February 7, 2019.
- ↑ Tropical Cyclone Vern 27/01/1978 to 03/02/1978 (PDF) (Report). Melbourne, Victoria: Bureau of Meteorology. Retrieved 16 September 2022.
- ↑ Tropical Cyclone Vern 27/01/1978 to 03/02/1978 (PDF) (Report). Melbourne, Victoria: Bureau of Meteorology. Retrieved 16 September 2022.
- ↑ "SH201978 - IBTrACS - International Best Track Archive for Climate Stewardship". ncics.org. Retrieved 2026-07-15.
- ↑ "SH211978 - IBTrACS - International Best Track Archive for Climate Stewardship". ncics.org. Retrieved 2026-07-15.
- ↑ "SH221978 - IBTrACS - International Best Track Archive for Climate Stewardship". ncics.org. Retrieved 2026-07-15.
- ↑ "SH181978 - IBTrACS - International Best Track Archive for Climate Stewardship". ncics.org. Retrieved 2026-07-15.
- ↑ "SH181978 - IBTrACS - International Best Track Archive for Climate Stewardship". ncics.org. Retrieved 2026-07-15.
- ↑ "SH231978 - IBTrACS - International Best Track Archive for Climate Stewardship". ncics.org. Retrieved 2026-07-15.
- ↑ "SH291978 - IBTrACS - International Best Track Archive for Climate Stewardship". ncics.org. Retrieved 2026-07-15.
- ↑ "Tropical cyclone kills 5". The StarPhoenix (Saskatoon, SK): 46. 5 April 1978. Retrieved 21 August 2021 – via Google News.
- ↑ Tropical Storm Kiki, 4-9 March. National Climatic Data Center (Report). Global tropical/extratropical cyclone climatic atlas. 1996. Retrieved February 7, 2019.
- ↑ "SH251978 - IBTrACS - International Best Track Archive for Climate Stewardship". ncics.org. Retrieved 2026-07-15.
- ↑ "SH261978 - IBTrACS - International Best Track Archive for Climate Stewardship". ncics.org. Retrieved 2026-07-15.
- ↑ Tropical Storm Kiki, 4-9 March. National Climatic Data Center (Report). Global tropical/extratropical cyclone climatic atlas. 1996. Retrieved February 7, 2019.
- ↑ "DESTRUCTIVE TYPHOONS 1970-2003". baseportal.com. Archived from the original on 2025-08-30. Retrieved 2026-07-15.
- ↑ "DESTRUCTIVE TYPHOONS 1970-2003". baseportal.com. Retrieved 2024-01-18.
- ↑ "IO011978 - IBTrACS - International Best Track Archive for Climate Stewardship". ncics.org. Retrieved 2026-07-15.
- ↑ "EP011978 - IBTrACS - International Best Track Archive for Climate Stewardship". ncics.org. Retrieved 2026-07-15.
- 1 2 3 4 "1978 ATCR" (PDF). www.metoc.navy.mil. Archived from the original (PDF) on 2026-07-15.
- 1 2 National Hurricane Center; Hurricane Research Division; Central Pacific Hurricane Center (April 26, 2024). "The Northeast and North Central Pacific hurricane database 1949–2023". United States National Oceanic and Atmospheric Administration's National Weather Service. Archived from the original on May 29, 2024. A guide on how to read the database is available here.
 This article incorporates text from this source, which is in the public domain.
- 1 2 "Atlantic hurricane best track (HURDAT version 2)" (Database). United States National Hurricane Center. April 4, 2025. This article incorporates text from this source, which is in the public domain.
- Landsea, Chris (April 2022). "The revised Atlantic hurricane database (HURDAT2) - Chris Landsea – April 2022" (PDF). Hurricane Research Division – NOAA/AOML. Miami, Florida: Hurricane Research Division – via Atlantic Oceanographic and Meteorological Laboratory.
- ↑ "WP041978 - IBTrACS - International Best Track Archive for Climate Stewardship". ncics.org. Retrieved 2026-07-15.
- 1 2 Emil B. Gunther (July 1979). "Eastern North Pacific Tropical Cyclones of 1978". Monthly Weather Review. 107 (7). American Meteorological Society: 911. Bibcode:1979MWRv..107..911G. doi:10.1175/1520-0493(1979)107<0911:ENPTCO>2.0.CO;2.
- ↑ "EP061978 - IBTrACS - International Best Track Archive for Climate Stewardship". ncics.org. Retrieved 2026-07-15.
- ↑ "EP051978 - IBTrACS - International Best Track Archive for Climate Stewardship". ncics.org. Retrieved 2026-07-15.
- ↑ "AL031978 - IBTrACS - International Best Track Archive for Climate Stewardship". ncics.org. Retrieved 2026-07-15.
- ↑ "WP061978 - IBTrACS - International Best Track Archive for Climate Stewardship". ncics.org. Retrieved 2026-07-15.
- 1 2 3 4 "1978 ATCR" (PDF). www.metoc.navy.mil. Archived from the original (PDF) on 2026-07-15.
- ↑ "U.S. Escaped Direct Hit in 'Average' Season This Year, But That Could Change". The Evening Independent. Miami, Florida. Associated Press. December 2, 1978. Retrieved June 3, 2014.
- ↑ Gilbert B. Clark (1978). Hurricane Cora August 7–12, 1978. National Hurricane Center (Report). Miami, Florida: National Oceanic and Atmospheric Administration. p. 4. Retrieved June 3, 2014.
- ↑ "Storm kills four hikers, hurt crops". Wisconsin State Journal. Madison, Wisconsin. September 8, 1978. p. 24. Retrieved January 6, 2022 – via Newspapers.com.
- ↑ Hurricane Greta and Hurricane Olivia Preliminary Report (JPG) (Report). National Hurricane Center. p. 2. Retrieved 2013-12-20.
- ↑ Paul J. Hebert (1978). Preliminary Report Hurricane Flossie. National Hurricane Center (Report). National Oceanic and Atmospheric Administration. p. 1. Retrieved June 5, 2014.
- ↑ "Typhoon Irma leaves 3,000 homeless". The Canberra Times. September 18, 1978. Retrieved September 22, 2016 – via Trove.
- ↑ "Typhoon brushes Japan; 6 die (September 16, 1978)". Retrieved 2016-10-23.
- ↑ "WP261978 - IBTrACS - International Best Track Archive for Climate Stewardship". ncics.org. Retrieved 2026-05-09.
- ↑ "59 flood deaths". The Canberra Times. October 13, 1978. Retrieved October 23, 2016 – via Trove.
- ↑ "WP241978 - IBTrACS - International Best Track Archive for Climate Stewardship". ncics.org. Retrieved 2026-07-18.
- ↑ "WP271978 - IBTrACS - International Best Track Archive for Climate Stewardship". ncics.org. Retrieved 2026-05-11.
- ↑ "1978 Annual Tropical Cyclone Report (pg. 63)" (PDF). www.metoc.navy.mil. Archived from the original (PDF) on 2025-03-30. Retrieved 2026-05-11.
- ↑ Tropical Cyclones 1978 (PDF). Central Pacific Hurricane Center (Report). National Hurricane Center. Retrieved January 5, 2022.
- ↑ Storm Data and Unusual Weather Phenomena (PDF). National Climatic Data Center (Report). Asheville, North Carolina: National Oceanic and Atmospheric Administration. p. 4. Archived from the original (PDF) on 2014-06-07. Retrieved June 6, 2014.
- ↑ Miles B. Lawrence (April 1979). Atlantic Hurricane Season of 1978 (PDF) (Report). Miami, Florida: National Hurricane Center; National Weather Service; National Oceanic and Atmospheric Administration. Archived (PDF) from the original on September 23, 2008. Retrieved June 3, 2014.
- 1 2 "WP281978 - IBTrACS - International Best Track Archive for Climate Stewardship". ncics.org. Retrieved 2026-07-18.
- ↑ "WP301978 - IBTrACS - International Best Track Archive for Climate Stewardship". ncics.org. Retrieved 2026-07-19.
- ↑ Morford, Dean R. "3.2 North Indian Ocean Tropical Cyclones" (PDF). 1978 Annual Tropical Cyclone Report. Joint Typhoon Warning Center (Report). United States Navy, United States Airforce. Retrieved November 25, 2021.
- ↑ "WP311978 - IBTrACS - International Best Track Archive for Climate Stewardship". ncics.org. Retrieved 2026-07-19.
- ↑ "UNNAMED (Garding) - IBTrACS - International Best Track Archive for Climate Stewardship". ncics.org. Retrieved 2026-07-19.
- ↑ L. W. Broadbridge (May 1980). The Australian Tropical Cyclone Season 1978–79 (PDF) (Report). Perth: Bureau of Meteorology. Retrieved 1 January 2016.
- ↑ "JTWC Best Track for Cyclone 05S". Joint Typhoon Warning Center. 2012. Archived from the original on March 11, 2010. Retrieved 1 January 2016.