South Tucson, Arizona
South Tucson, Arizona | |
|---|---|
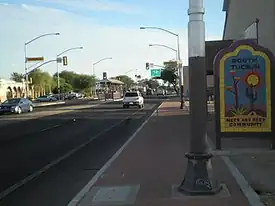 South Tucson from city limits at 6th Avenue | |
 Flag | |
| Motto: The Pueblo within a city | |
Interactive map of South Tucson, Arizona | |
  South Tucson Location within Arizona | |
| Coordinates: 32°11′44″N 110°58′09″W / 32.1955°N 110.9692°W | |
| Country | United States |
| State | Arizona |
| County | Pima |
| Incorporated | August 10, 1936 |
| Dissolved | January 18, 1938 |
| Reincorporated | March 27, 1939 |
| Government | |
| • Type | Council–Manager |
| • Body | South Tucson City Council |
| • Mayor | Roxanna Valenzuela |
| • Vice Mayor | Melissa Brown-Dominguez |
| • Acting-Mayor | Pablo Robles |
| • City manager | Veronica Moreno |
| • Councilmembers | Cesar Aguirre Paul Diaz Brian Flagg Dulce Jimenez |
| Area | |
• Total | 1.027 sq mi (2.660 km2) |
| • Land | 1.027 sq mi (2.660 km2) |
| • Water | 0 sq mi (0.000 km2) 0.00% |
| Elevation | 2,425 ft (739 m) |
| Population | |
• Total | 4,613 |
| 4,452 | |
| • Density | 4,492/sq mi (1,734/km2) |
| Time zone | UTC–7 (Mountain (MST)) |
| ZIP Code | 85713 |
| Area code | 520 |
| FIPS code | 04-68850 |
| GNIS feature ID | 2411943[3] |
| Website | southtucsonaz.gov |
South Tucson is a city in Pima County, Arizona, United States, and an enclave of the much larger city of Tucson. South Tucson is known for being heavily influenced by Hispanic, and especially Mexican, culture; restaurants and shops which sell traditional Mexican food and other goods can be found throughout the city. The population was 4,613 as of the 2020 census,[4] and was estimated at 4,452 in 2025.[5]
Geography
According to the United States Census Bureau, the city has a total area of 1.027 square miles (2.66 km2), all land.[2] The city is an enclave entirely surrounded by the much larger city of Tucson.
Demographics
| Census | Pop. | Note | %± |
|---|---|---|---|
| 1940 | 1,066 | — | |
| 1950 | 2,364 | 121.8% | |
| 1960 | 7,004 | 196.3% | |
| 1970 | 6,220 | −11.2% | |
| 1980 | 6,554 | 5.4% | |
| 1990 | 5,171 | −21.1% | |
| 2000 | 5,490 | 6.2% | |
| 2010 | 5,652 | 3.0% | |
| 2020 | 4,613 | −18.4% | |
| 2025 (est.) | 4,452 | [5] | −3.5% |
| U.S. Decennial Census[6] 2020 Census[4] | |||
According to realtor website Zillow, the average price of a home as of July 31, 2026, in South Tucson was $214,152.[7]
As of the 2024 American Community Survey, there were 1,729 estimated households in South Tucson with an average of 2.57 persons per household. The city has a median household income of $33,598. Approximately 30.4% of the city's population lives at or below the poverty line. South Tucson has an estimated 47.5% employment rate, with 13.0% of the population holding a bachelor's degree or higher and 66.2% holding a high school diploma.[8] There were 2,034 housing units at an average density of 1,980.53 per square mile (764.69/km2).
The top five reported languages (people were allowed to report up to two languages, thus the figures will generally add to more than 100%) were English (35.9%), Spanish (61.8%), Indo-European (0.6%), Asian and Pacific Islander (0.4%), and Other (1.3%).
The median age in the city was 41.7 years.
| Race / ethnicity (NH = non-Hispanic) | Pop. 1980[9] | Pop. 1990[10] | Pop. 2000[11] | Pop. 2010[12] | Pop. 2020[13] |
|---|---|---|---|---|---|
| White alone (NH) | 820 (12.51%) | 359 (6.94%) | 496 (9.03%) | 578 (10.23%) | 514 (11.14%) |
| Black or African American alone (NH) | 134 (2.04%) | 114 (2.20%) | 112 (2.04%) | 127 (2.25%) | 97 (2.10%) |
| Native American or Alaska Native alone (NH) | 529 (8.07%) | 329 (6.36%) | 356 (6.48%) | 420 (7.43%) | 356 (7.72%) |
| Asian alone (NH) | 0 (0.00%) | 14 (0.27%) | 17 (0.31%) | 35 (0.62%) | 32 (0.69%) |
| Pacific Islander alone (NH) | — | — | 2 (0.04%) | 3 (0.05%) | 3 (0.07%) |
| Other race alone (NH) | 41 (0.63%) | 33 (0.64%) | 5 (0.09%) | 13 (0.23%) | 9 (0.20%) |
| Mixed race or multiracial (NH) | — | — | 42 (0.77%) | 41 (0.73%) | 75 (1.63%) |
| Hispanic or Latino (any race) | 5,030 (76.75%) | 4,244 (82.07%) | 4,460 (81.24%) | 4,435 (78.47%) | 3,527 (76.46%) |
| Total | 6,554 (100.00%) | 5,171 (100.00%) | 5,490 (100.00%) | 5,652 (100.00%) | 4,613 (100.00%) |
2020 census
As of the 2020 census, there were 4,613 people, 1,808 households, and 1,042 families residing in the city.[14] The population density was 4,491.72 inhabitants per square mile (1,734.26/km2). There were 2,116 housing units at an average density of 2,060.37 per square mile (795.51/km2). The racial makeup of the city was 30.11% White, 2.45% African American, 11.53% Native American, 0.76% Asian, 0.07% Pacific Islander, 33.02% from some other races and 22.07% from two or more races. Hispanic or Latino people of any race were 76.46% of the population.[15]
2010 census
As of the 2010 census, there were 5,652 people, 1,827 households, and 1,158 families residing in the city.[16] The population density was 5,424.18 inhabitants per square mile (2,094.29/km2). There were 2,137 housing units at an average density of 2,050.86 per square mile (791.84/km2). The racial makeup of the city was 45.28% White, 3.03% African American, 10.70% Native American, 0.78% Asian, 0.11% Pacific Islander, 36.15% from some other races and 3.96% from two or more races. Hispanic or Latino people of any race were 78.47% of the population.
2000 census
As of the 2000 census, there were 5,490 people, 1,810 households, and 1,125 families residing in the city. The population density was 5,446.65 inhabitants per square mile (2,102.96/km2). There were 2,059 housing units at an average density of 2,042.74 per square mile (788.71/km2). The racial makeup of the city was 43.46% White, 2.31% African American, 9.14% Native American, 0.40% Asian, 0.05% Pacific Islander, 41.24% from some other races and 3.39% from two or more races. Hispanic or Latino people of any race were 81.24% of the population.
There were 1,810 households, out of which 33.3% had children under the age of 18 living with them, 34.9% were married couples living together, 20.5% had a female householder with no husband present, and 37.8% were non-families. 31.9% of all households were made up of individuals, and 11.2% had someone living alone who was 65 years of age or older. The average household size was 2.94 and the average family size was 3.83.
In the city, the population was spread out, with 31.5% under the age of 18, 10.1% from 18 to 24, 27.3% from 25 to 44, 21.1% from 45 to 64, and 10.0% who were 65 years of age or older. The median age was 31 years. For every 100 females, there were 112.7 males. For every 100 females age 18 and over, there were 114.4 males.
The median income for a household in the city was $14,587, and the median income for a family was $17,614. Males had a median income of $20,504 versus $14,575 for females. The per capita income for the city was $8,920. About 43.5% of families and 46.5% of the population were below the poverty line, including 61.2% of those under age 18 and 36.0% of those age 65 or over.
History
In 1936, Tucson officials took steps to expand Tucson's boundaries by moving to annex the unincorporated area along south Sixth Avenue from 25th Street south to the Veterans Hospital, which was south of Tucson city limits.[17] Area auto court and other property owners on south Sixth Avenue objected, as they did not want to pay the higher business taxes imposed by Tucson or be subject to Tucson's building codes.[17] As a recourse to prevent the annexation, south Sixth Avenue property owners submitted a petition to the Pima County Board of Supervisors asking for an incorporation election.[17] On August 10, 1936, South Tucson residents voted 52 to 35 in favor of incorporation.[17] In response, Tucson continued to require Tucson Water customers in South Tucson to obtain building permits from Tucson, or their water would be shut off.[17] The South Tucson City Council responded by imposing a $500 annual franchise fee on Tucson Water, and the Tucson City Council retaliated by announcing that water service would be discontinued to South Tucson within 120 days.[17] On January 18, 1938, 258 petition signatures from South Tucson residents were turned in to the Pima County Board of Supervisors, which dissolved South Tucson.[17] Nonetheless, another incorporation drive was launched in South Tucson.[17] On March 27, 1939, a second incorporation election was held and by a vote of 70 to 63, South Tucson was reincorporated.[17]
In 1956, Tucson Mayor Hummel called for South Tucson to join Tucson.[17] After that invitation went unanswered, the Tucson City Council held a surprise meeting and annexed land all around South Tucson.[17] Later, in the 1990s, Tucson agreed to transfer to South Tucson a 25-acre slice of land between South Tucson and Interstate 10 as South Tucson reached its current city size.[17]
Culture
South Tucson has many Mexican restaurants, colorful buildings and outdoor murals.[18] The existing Mexican food restaurants on South Fourth Avenue have long been a draw.[19] Some of the long-established eateries dotting South Fourth Avenue in South Tucson have grabbed national headlines, perhaps none more famously than Mi Nidito, where President Bill Clinton had lunch in 1999 and where "the President's Plate" is still on the menu.[19]
The 1.2-square-mile city is gaining favor with businesses and residents and is attracting bohemians, artists, and musicians. The city is trying to attract more business through a new economic development plan and an incentive program.[20] Local business owners and developers are eyeing properties in South Tucson as complementary projects to downtown Tucson with business parks, restaurants, retail shops, and multifamily investors moving into the city.[21]
Crime
| South Tucson | |
|---|---|
| Crime rates* (2025) | |
| Violent crimes | |
| Homicide | 1 |
| Rape | 6 |
| Robbery | 13 |
| Aggravated assault | 51 |
| Total violent crime | 71 |
| Property crimes | |
| Burglary | 34 |
| Larceny-theft | 384 |
| Motor vehicle theft | 38 |
| Arson | 6 |
| Total property crime | 462 |
Note: Reported crimes per 100,000 population Source: 2025 FBI UCR Data | |
South Tucson has also been fighting a long, uphill battle with crime rates. For larceny, theft and aggravated assault, South Tucson ranks at about four times the national average.[22]
However, there have been sizable advances in repressing criminal activity, due to use of "wolf pack" saturation tactics by the South Tucson Police Department in conjunction with the Arizona Department of Public Safety.[22] Vigorous enforcement of liquor license laws has reduced the number of alcohol-related crimes.[22] Neighborhood activism has considerably reduced the amount of open drug activity and a rising level of education of youth is making a slow impact on gang related activity.[22]
Education
It is in the Tucson Unified School District.[23]
South Tucson residents attend Ochoa Community Magnet, Mission View Elementary, Holladay Magnet Elementary, Elizabeth Borton Magnet, Madge Utterback Magnet Middle, Safford K-8 Magnet Baccalaureate World, Tucson High Magnet, & Pueblo Magnet High Schools, all part of Tucson USD.
Governmental representation
South Tucson is in Arizona's 7th congressional district.
In November 2024, Roxanna Valenzuela assumed the role of Mayor. Her priorities include strengthening the local police and fire departments, strengthening small businesses, protecting the unique culture of South Tucson, addressing the widespread challenges of homelessness and substance addiction, and building more affordable housing.
References
- ↑ "City Council". City of South Tucson, Arizona. Retrieved August 27, 2026.
- 1 2 "2025 U.S. Gazetteer Files". United States Census Bureau. Retrieved August 27, 2026.
- 1 2 U.S. Geological Survey Geographic Names Information System: South Tucson, Arizona
- 1 2 3 "Explore Census Data". United States Census Bureau. Retrieved August 27, 2026.
- 1 2 3 "City and Town Population Totals: 2020-2025". United States Census Bureau. Retrieved August 27, 2026.
- ↑ "Decennial Census of Population and Housing". www.census.gov. United States Census Bureau. Retrieved June 4, 2015.
- ↑ "South Tucson, AZ Housing Market". Zillow. Retrieved August 27, 2026.
- ↑ "U.S. Census Bureau QuickFacts: South Tucson city, Arizona". www.census.gov. Retrieved August 27, 2026.
- ↑ General Social and Economic Characteristics: Arizona (PDF). United States Census Bureau. pp. 30 of 74. Retrieved August 27, 2026.
- ↑ Arizona: 1990 (PDF). United States Census Bureau. pp. 36 of 366. Retrieved August 27, 2026.
- ↑ "P004: Hispanic or Latino, and Not Hispanic or Latino by Race – 2000: DEC Summary File 1 – South Tucson city, Arizona". United States Census Bureau. Retrieved August 27, 2026.
- ↑ "P2: Hispanic or Latino, and Not Hispanic or Latino by Race – 2010: DEC Redistricting Data (PL 94-171) – South Tucson city, Arizona". United States Census Bureau. Retrieved August 27, 2026.
- ↑ "P2: Hispanic or Latino, and Not Hispanic or Latino by Race – 2020: DEC Redistricting Data (PL 94-171) – South Tucson city, Arizona". United States Census Bureau. Retrieved August 27, 2026.
- ↑ "US Census Bureau, Table P16: Household Type". United States Census Bureau. Retrieved August 27, 2026.
- ↑ "How many people live in South Tucson city, Arizona". USA Today. Retrieved August 27, 2026.
- ↑ "Arizona: 2010 Census of Population and Housing" (PDF). United States Census Bureau. October 2012. p. 115 of 214. Retrieved August 27, 2026.
- 1 2 3 4 5 6 7 8 9 10 11 12 Devine, David (June 12, 2015). Tucson: A History of the Old Pueblo from the 1854 Gadsden Purchase. McFarland. ISBN 978-0786497102.
- ↑ , Huffington Post, 2014.
- 1 2 , Arizona Daily Star, 2018.
- ↑ , Arizona Daily Star, 2015.
- ↑ , Arizona Daily Star, 2018.
- 1 2 3 4 "South Tucson, Arizona". Sangres. 2009. Archived from the original on March 24, 2023. Retrieved August 27, 2026.
- ↑ "2020 Census - School District Reference Map: Pima County, AZ" (PDF). United States Census Bureau. p. 2 (PDF p. 3/3). Retrieved November 7, 2024.
