Patient similarity network
A patient similarity network (PSN) is a mathematical model based on graph theory that allows for the visual and analytical exploration of complex relationships among individuals. In this graph representation, nodes represent single patients, while edges measure the degree of clinical, phenotypic, or molecular similarity between them.[1]

PSNs are increasingly utilized in clinical research to support clinical decision-making, shifting the focus from general statistical averages to highly personalized treatments, the core concept of precision medicine. By employing machine learning techniques, these networks enable the prediction of patient outcomes and improve patient stratification, facilitating the identification of novel subtypes in complex diseases.[2]
The ability to map each patient in relation to others introduces a paradigm where individual complexity is treated as unique, with specific characteristics and therapeutic needs. Furthermore, these networks are intuitive and easy to visualize, offering a natural way to inspect complex, high-dimensional data. This confers explainability for the predictions generated by machine learning models, while effectively maintaining the privacy that each patient deserves.[1]
History and context

Historically, clinical practice and medical research have relied on a "one-size-fits-all" model, which was based on generalized treatments designed for the "average patient".[3] In this paradigm, a standard therapy was prescribed to everyone sharing the same disease label. While this approach has proven successful for many common conditions, it fails to account for the inter-individual variability and underlying molecular differences among patients. Consequently, commonly prescribed drugs may only benefit a small fraction of patients, leaving others as non-responders or even causing adverse side effects.[3]
Accounting for these unique features is especially critical in complex diseases which arise from the interplay of multiple biological and environmental factors. To address these limitations, modern healthcare is shifting toward precision medicine. This approach aims to fragment broad diagnostic categories into specific subtypes, tailoring diagnostics and treatments to each patient's unique genetic, molecular and environmental profile. This conceptual shift coincides with the post-genomic era and the advent of high-throughput technologies, which generate massive volumes of heterogeneous patient data at high velocity.[4] Precision medicine relies on integrating these "Big Data", acquired from electronic health records (EHRs), wearable devices, biomarkers, and genetic data. As researchers collect increasingly large datasets combining biological, clinical, and environmental information, advanced computational tools are required to process them.[5]
To manage and interpret this scale of data, artificial intelligence and network-based methods have become essential. PSNs were developed within this context as a tool to integrate large amounts of heterogeneous data. By grouping patients based on shared clinical and molecular traits, PSNs enable the identification of highly specific and precise patient subgroups, providing a solid foundation for individualized care.[6]
Network construction procedure

The construction of a patient similarity network involves transforming individual patient profiles into a mathematical graph. In this structure, each patient is represented as a node, and the similarities between their medical or biological profiles are represented as weighted edges. This process generally follows four main steps: data collection, similarity calculation, data integration, and graph sparsification.[1]
Data collection
The first step for the construction of the network involves gathering features that could accurately describe the clinical and biological profile of a patients. In order to have a complete understanding of the different subtypes, precision medicine relies on highly heterogeneous datasets, which can be broadly divided in the following categories:[1][7]
Electronic health records
Electronic health records (EHRs) are digital archives including structured clinical data, such as demographics, vital signs, laboratory test results, prescribed medications and formal diagnoses, as well as unstructured data such as clinical notes. Analizing EHRs often represents a challenge, due to the irregular and incomplete nature of data. However, they can be useful to researchers to track clinical trajectories over time about the evolution of the patient state. This makes it possible to map not only a patient's current health but also their entire medical history and disease progression.[8]
Multi-omics data

Advances in high-throughput molecular analysis have revolutionized our understanding of biological processes. The term "omics" refers to the holistic study of the molecules within a biological system, with each discipline focusing on a specific cellular aspect. The complexity of a biological system arises from the interactions among these various omics layers: genomics, epigenomics, transcriptomics, proteomics, and metabolomics.[9][10] These omics layers can be analyzed individually or integrated.[10]
Multi-omics integration yields a more comprehensive and precise patient molecular profile (taking into consideration both static and dynamic cellular aspects), enabling the identification of specific patient subtypes that may share the same phenotypic profile but are driven by different underlying biological processes. This generation of comprehensive data enhances the understanding of disease mechanisms and advances precision medicine approaches.[11] However, integrating these high-dimensional data vectors introduces extreme computational complexity. This difficulty is primarily driven by magnitude imbalances across different omics layers and technical background noise dependent on sequencing platforms. Building a PSN with this data reduces background noise by focusing on the relationships between patients rather than just their raw measurements. Grouping patients this way captures their complete molecular profile, making predictions about survival or treatment responses much more accurate than models relying on a single omics layer.[12]
Medical imaging and wearables

Advanced networks may also integrate features extracted from medical imaging modalities and continuous physiological monitoring from wearable devices, providing dynamic and real-time clinical information.[13] Wearables (such as continuous glucose monitors, sleep quality trackers, and wrist-worn cardiovascular telemetry systems) generate massive time-series datasets. While these longitudinal trajectories successfully capture circadian variations and dynamic stress responses, they require robust signal processing to remove background noise and harmonize varying sampling frequencies across individuals. Furthermore, medical imaging serves as another crucial data source.[13] By extracting specific quantitative features, such as dimensions, textures, and signal intensities, it is possible to uncover vital information regarding the patient's current clinical status and the phenotypic manifestation of the pathology.[14][15]
Concurrently, medical imaging modalities like magnetic resonance imaging (MRI) and computed tomography (CT) provide critical anatomical context. By extracting specific quantitative features from these images (such as spatial dimensions, volumes, tissue textures, and pixel intensities) algorithms can accurately evaluate a patient's current physical status and the phenotypic manifestation of a underlying pathology. The fusion of real-time wearable telemetry with high-resolution anatomical imaging creates a comprehensive, dynamic clinical profile.[16]
Similarity calculation
After patient features have been selected, filtered, and transformed into numerical representations, the next step in the construction of a patient similarity network is the computation of scores of similarity between pairs of patients. This process converts complex and often heterogeneous patient profiles into similarity matrices, which represent the strength of the relationships between individuals and gives the basis for network construction and subsequent integration methods.[17]
The choice of similarity metric is a critical step, as different measures capture different aspects of patient relatedness and can substantially influence the resulting network structure. For continuous variables, such as laboratory measurements Euclidean distance has traditionally been used to quantify overall differences between patient profiles, although its sensitivity to scaling and outliers often requires careful preprocessing such as normalization procedures.[17] When dealing with transcriptomics profiles, while Euclidean distance can capture differences in the absolute expression levels, cosine similarity is frequently preferred for these high-dimensional and sparse datasets (as well for embeddings and graph neural network features), because it effectively measures the similarity of overall expression patterns independetly of tehir magnitude.[18] Similarly, Pearson correlation distance is widely utilized to assess the linear relationship between continuous profiles, making it highly effective at capturing parallel trends (such as gene co-expression or longitudinal clinical trajectories) regardless of baseline shifts in the data. For binary data, such as the presence or absence of genetic mutations, clinical diagnoses, or adverse events, the Jaccard coefficient is commonly employed because it emphasizes shared characteristics while ignoring the large number of absent features that typically provide limited biological information. In clinical datasets containing mixed data types, such as electronic health records (EHRs), Gower similarity offers a flexible solution by combining different similarity calculations for continuous, categorical, and binary variables within a unified framework while also accommodating missing values.[19]
These patient-by-patient similarity matrices can then be analyzed independently or integrated through network fusion approaches to generate a comprehensive representation of patient relationships across multiple biological and clinical domains.[1]
Integration methods
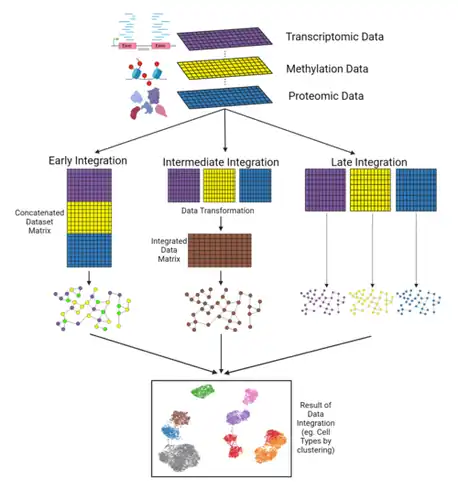
The construction of patient similarity networks from heterogeneous biomedical data requires the integration of multiple data modalities. Integration strategies can be broadly categorized into early, intermediate, and late fusion approaches, which differ in the stage at which data are combined and in the nature of the resulting representation. Within these paradigms, several methodological frameworks have been developed, including kernel-based learning, graph-based diffusion models, and ensemble-based aggregation techniques.[1]
Early fusion strategies
Early fusion methods represent the most straightforward integration approach. Data from various sources are concatenated into a single, high-dimensional vector before the training of any model. Similarity between patients is then computed in this unified space using standard distance metrics. A key advantage of early fusion is its ability to capture direct correlations across data types in a single representation. However, these methods typically require careful normalization to avoid scale dominance effects, where features with larger numerical ranges disproportionately influence the similarity estimation. Furthermore, early fusion is sensitive to missing data and may suffer from the "curse of dimensionality" when the number of features greatly exceeds the number of patients, increasing the risk of overfitting.[7]
Representative approaches in this category include classical feature concatenation pipelines and dimensionality reduction methods such as principal component analysis (PCA) and matrix factorization, which aim to project heterogeneous data into a shared latent space prior to similarity computation.[1]
Late fusion strategies
Late fusion methods integrate information at the decision level, after independent models have been trained on each data modality. In this framework, separate patient similarity networks or predictions are evaluated for each data source, and their outputs are combined using various techniques such as majority voting, weighted averaging, and consensus clustering, which evaluates the stability of patient co-clustering across multiple runs or modalities. This allows to apply the most optimal algorithm for each specific data type and it is also robust to missing data and easier to interpret on a per-modality basis, however it often fails to capture deep cross-modal interactions and increases the overall complexity of the procedure but requiring multiple separate training procedures.[7]
Intermediate fusion strategies
Intermediate fusion methods integrate information at the representation or model level, enabling more flexible modeling of cross-modal interactions while preserving the structure specific of each modality. This category includes kernel-based approaches, graph-based diffusion methods, and deep representation learning frameworks.[7]
Multiple Kernel Learning (MKL)
Multiple Kernel Learning (MKL) represents each data modality as a kernel function encoding pairwise patient similarities. The objective is to learn an optimal weighted combination of these kernels, resulting in a single integrated similarity representation. In supervised settings, kernel weights are optimized with respect to predictive performance, often using classifiers such as support vector machines (SVMs). In unsupervised settings, weights are inferred by maximizing structural agreement or alignment between kernels without relying on outcome labels. MKL provides a principled framework for multimodal integration and allows heterogeneous data sources to contribute adaptively to the final similarity structure.[20]
Graph-based integration and random walk models
Graph-based integration methods combine different types of patient data by building a multi-layered network, often called a multiplex graph. In this structure, each layer represents a specific data source (such as genomic data or clinical records). Every patient is represented as a "node" present in all layers, with connections linking the same patient across the different levels to maintain their identity. To calculate the overall similarity between patients, these models often use network diffusion algorithms like Random Walk with Restart (RWR). This process can be thought of as a virtual exploration: the algorithm "walks" randomly through the network, tracing paths between patients both within a single layer and by jumping across different layers. The final outcome of this exploration provides a single, unified similarity score that fuses all available data. This approach is highly effective at uncovering complex, indirect relationships in diverse medical data that simpler methods might miss.[21][22]
Similarity network fusion
Similarity network fusion (SNF) is an unsupervised algorithm originating in the context of multi-omics data integration and subtype discovery.[23] It represents an intermediate integration method which works by constructing networks of samples (patients) for each layer of data and then, in a later step fusing them into one network that represents the full spectrum of underlying data. It consists of two main steps: constructing a sample similarity network for each data type and then integration into a single patient similarity network using a nonlinear combination method. The network aims to capture both shared and complementary information among different data types. It is able to derive useful information even if the number of samples is limited and it is also robust to noise and data heterogeneity.[23][24]
The first step of the algorithm consists of calculating the distances between pairs of patients, which is afterwards transformed into a measure of similarity by means of a scaled exponential similarity kernel. The similarity values are summarized into an NxN affinity matrix (), where N represents the total number of patients. The general affinity matrix is then transformed into two distinct matrices:, a normalized patient similarity network reflecting the global relationship among patients and , a local patient similarity network representing topologies within data neighborhoods. The latter is defined under the assumption that local similarities are more important than distant ones, a principle implemented by setting the similarities between non-neighboring points to zero. The performances of the algorithm and the definition of the neighborhoods depend on three main hyperparameters that need to be carefully tuned before the application of the algorithm: the number of neighbors , the global scale factor and the number of iterations:[25]


- is both used in the affinity matrix construction and in defining the sparse matrix , by keeping for each node, only the connections with its closest neighbors and while removing the remaining connections.
- is a global scaling factor that weights the affinity matrix by controlling the bandwidth of the Gaussian kernel used to calculate it. High values of cause a slow decay of the Gaussian distribution, saving multiple connections and making the network dense; on the other hand, low values cause the similarity score to drop rapidly, in a way that only closely related samples are considered similar.
- is the number of iterations and it specifies the number of steps executed by the algorithm. For this hyperparameter it is useful to find a good balance between the ability to reach convergence and the computational cost.

The key innovation of SNF with respect to other integration methods consists on the fusion process. In this case the global similarity matrix of one view (one data type) is updated by means of its own local similarity matrix applied to the status matrix of the other view. In the case in which the available data type are two this procedure would be summarized by the following equations:[25]


After iterations, this cross-diffusion process converges into a single, unified network, which effectively captures the shared non-linear structures across datasets, resulting in a robust classification that is less sensitive to noise than single-source analyses.[25][26]
Algorithmic interpretation
Clustering and community detection
Patient stratification is a fundamental component of precision medicine, aiming to resolve the underlying biological diversity of patients diagnosed with the same disease. Frequently, individuals within a supposedly uniform clinical cohort exhibit significantly different treatment responses. PSNs offer a powerful approach to address this challenge by applying network theory, where a "community" is defined as a subset of nodes that are densely interconnected but sparsely linked to the rest of the network. Within the context of a PSN, these topological communities translate directly into distinct patient subtypes (clusters of individuals sharing a highly similar clinical or molecular profile).[27]
Different computational methods can be applied to identify these groups of patients. One example are the Louvian and the Leiden algorithm, which are based on modularity optimization. Modularity is a scalar value defined on a network topology that quantifies the strength of a network's subdivision into modules, calculated by comparing the density of edges within communities to what would be expected by chance in a randomly connected network.[28] In addition to modularity optimization, spectral clustering is frequently employed to partition similarity networks, particularly following data fusion processes. Spectral clustering leverages the eigenvalues and eigenvectors of the graph Laplacian matrix to map patient nodes into a lower-dimensional latent space before applying standard clustering techniques.[29]
Topological analysis
Topological analysis represents one of the main approaches used to interpret patient similarity networks. It aims to characterize the structural organization of the network and relate it to clinically meaningful information. By examining the position of patients within the network and the overall arrangement of connections, it is possible to identify patterns associated with disease heterogeneity, progression, and patient stratification. A key aspect of this analysis is the evaluation of node centrality measures, a metric that describes the relative importance of individual patients within the network. With this analysis, patients with a high degree centrality are highly representative of a specific subgroup, whereas patients with low degree centrality may correspond to rare phenotypes or outliers.[30]
The main objective of topological analysis is to establish associations between network structure and external clinical, molecular, and demographic information. Through statistical analysis of these relationships, researchers can identify the factors driving patient similarity, characterize disease subtypes, and generate biologically interpretable hypotheses, thereby transforming complex network structures into clinically meaningful insights.[31]
Clinical applications
Disease subtyping
Patient similarity networks helps to overcome the limits of the one-size-fits-all paradigm and leverage the graph based representation to decompose clinically similar phenotypes into distinct biological entities. Within a patient similarity network, the emergence of densely connected clusters or communities may reveal groups of people previously with specific disease variants characterized by shared molecular, genetic, or phenotypic features.[32] In oncology, disease subtyping represents a crucial aspects and it has enabled classifications that extend beyond tissue of origin or individual cytogenetic abnormalities. Computational frameworks such as Perturbation Clustering for Data Integration and Disease Subtyping (PINS), as well as multi-kernel network diffusion approaches, have been used to identify tumor subtypes associated with significantly different clinical outcomes, including overall survival, without requiring prior knowledge of disease categories. Analyses of large-scale datasets, have demonstrated that patients classified within the same clinical category may occupy distinct regions of a similarity network when transcriptomic, epigenomic, proteomic, or microbiome data are considered. These findings support the development of precision medicine strategies by enabling more accurate patient stratification and the selection of targeted therapeutic interventions.[33]
Prognosis and outcome prediction
One of the most promising applications of patient similarity networks in medicine is the prediction of clinical outcomes by leveraging the historical trajectories of patients with similar characteristics. Unlike traditional prognostic models, which often rely on global statistical associations derived from large populations, PSN-based approaches are based on predictions which are based on the outcomes of the most similar patients within a network. When a new patient is introduced into the system, similarity measures computed across multiple dimensions are used to position the patient within the existing network topology.[34]
The topological location of a patient within the network can provide prognostic information by identifying neighboring patients with comparable clinical trajectories. In intensive care settings, patient similarity networks have been used to construct individualized risk profiles that support the early identification of clinical deterioration. Predictive models integrating PSNs with survival analysis methods, have been developed to estimate mortality risk, and other clinical endpoints based on the outcomes observed among neighboring patient clusters. These approaches have the potential to support proactive disease management strategies by identifying patients at elevated risk of adverse events and enabling personalized monitoring and follow-up protocols. For example, in cardiovascular medicine, the dynamic movement of patients toward high-risk regions of a similarity network may facilitate earlier intervention and contribute to reducing unplanned hospital readmissions and the onset major adverse cardiovascular events (MACE).[35]
Drug repurposing
Drug repurposing is a biomedical research strategy aimed at identifying new therapeutic indications for drugs that have already been approved or previously developed for other diseases. This approach represents an alternative to traditional drug discovery and development processes, as it enables the reduction of the time, costs, and risks associated with preclinical and clinical stages by leveraging compounds for which safety, pharmacokinetic, and toxicity data are already available.[36]
Within the context of precision medicine and the analysis of patient similarity networks, drug repurposing can be applied not only to broadly defined diseases but also to specific disease subtypes identified through network-based stratification approaches. By integrating patient clustering structures with heterogeneous biomedical networks, such as drug–target–disease knowledge graphs or multiplex biological interaction networks, it is possible to estimate associations between the molecular profile characterizing a disease subtype and the transcriptional perturbations induced by drugs.To this end, bioinformatics resources such as the Connectivity Map and the Functional Signature Ontology are frequently employed, often in combination with network integration methods, such as similarity network fusion, and multi-omics datasets. These approaches enable the inference of drug mechanisms of action and the identification of novel possible compounds for therapeutic aims.[36][37]
In oncology, network-based drug repurposing strategies have contributed to the identification of approved drugs, including kinase inhibitors and nuclear export inhibitors originally developed for other hematological malignancies, as potential therapeutic options for molecularly defined subgroups of cancers such as multiple myeloma. These subgroups may be characterized by distinct genomic alterations and transcriptomic profiles identified through PSN-based analyses.[38]
Challenges and limitations
Despite their potential in precision medicine and network biology, PSNs face several methodological, computational, and ethical challenges that limit their widespread clinical implementation. A major limitation concerns the quality and heterogeneity of the underlying data. PSNs rely on the integration of diverse data modalities, including electronic health records, medical imaging, and multi-omics profiles, which often differ substantially in terms of scale, distribution, and degree of standardization.[39] Batch effects, technical variability, high dimensionality, and missing data can introduce spurious similarities and compromise the topological validity of the resulting networks. Although methods such as matrix factorization, latent variable models, and specialized algorithms for incomplete datasets (e.g., miss-SNF) have been developed to address these issues, reconstructed similarities remain statistical approximations rather than direct clinical observations.[40]
Another major challenge is computational scalability. Since the construction of PSNs typically requires the computation of pairwise similarities among all patients, the computational and memory requirements scale quadratically with cohort size, making large-scale applications computationally demanding. Furthermore, with the advent of high throughput technologies the amount of genetic data is exponentially increased, requiring adequate bioinformatic means for being handled and resulting in computationally expensive calculations. Several optimization strategies, including dimensionality reduction, approximate nearest-neighbor search, sparse graph representations, and distributed or federated computing frameworks, have been proposed to mitigate these limitations, although substantial computational bottlenecks remain.[41]

Model interpretability also represents a significant obstacle to clinical adoption. While early PSNs relied on transparent similarity metrics, modern approaches increasingly incorporate deep learning and graph neural networks, whose decision-making processes are often difficult to interpret, rising the problem of the "black-box".[42] To address this limitation, various explainable artificial intelligence (XAI) techniques have been adapted to PSNs, although a trade-off between predictive performance and interpretability persists.[43]
Finally, the construction of large-scale PSNs raises important privacy and security concerns because it requires the aggregation of highly sensitive clinical and molecular data. Although privacy-preserving approaches have been proposed, these methods often introduce additional computational costs and may reduce predictive accuracy. Consequently, achieving scalable, interpretable, and privacy-preserving PSNs remains one of the principal challenges for the translation of network medicine approaches into routine clinical practice.[44]
See also
References
- 1 2 3 4 5 6 7 8 Gliozzo, Jessica; Mesiti, Marco; Notaro, Marco; Petrini, Alessandro; Patak, Alex; Puertas-Gallardo, Antonio; Paccanaro, Alberto; Valentini, Giorgio; Casiraghi, Elena (2022-07-18). "Heterogeneous data integration methods for patient similarity networks". Briefings in Bioinformatics. 23 (4) bbac207. doi:10.1093/bib/bbac207. PMC 9294435. PMID 35679533.
- ↑ Pai, Shraddha; Bader, Gary D. (September 2018). "Patient Similarity Networks for Precision Medicine". Journal of Molecular Biology. 430 (18): 2924–2938. doi:10.1016/j.jmb.2018.05.037. PMC 6097926. PMID 29860027.
- 1 2 Lip, Stefanie; Padmanabhan, Sandosh (July 2025). "Introduction to precision medicine". Medicine. 53 (7): 476–482. doi:10.1016/j.mpmed.2025.04.018.
- ↑ Brown, Sherry-Ann (24 November 2016). "Patient Similarity: Emerging Concepts in Systems and Precision Medicine". Frontiers in Physiology. 7: 561. doi:10.3389/fphys.2016.00561. PMC 5121278. PMID 27932992.
- ↑ Naithani, Nardeep; Sinha, Sharmila; Misra, Pratibha; Vasudevan, Biju; Sahu, Rajesh (July 2021). "Precision medicine: Concept and tools". Medical Journal Armed Forces India. 77 (3): 249–257. doi:10.1016/j.mjafi.2021.06.021. PMC 8282508. PMID 34305276.
- ↑ Karahalil, Bensu (5 December 2016). "Overview of Systems Biology and Omics Technologies". Current Medicinal Chemistry. 23 (37): 4221–4230. doi:10.2174/0929867323666160926150617. PMID 27686657.
- 1 2 3 4 Xu, Deren; Tang, Yujun; Luo, Junyi; Wen, Chengping (7 January 2026). "Computational approaches to multimodal data integration in rheumatoid arthritis: from data landscape to clinical translation". Briefings in Bioinformatics. 27 (1) bbag073. doi:10.1093/bib/bbag073. PMC 12907022. PMID 41693090.
- ↑ Cowie MR, Blomster JI, Curtis LH, Duclaux S, Ford I, Fritz F, et al. (January 2017). "Electronic health records to facilitate clinical research". Clinical Research in Cardiology. 106 (1): 1–9. doi:10.1007/s00392-016-1025-6. PMC 5226988. PMID 27557678.
- ↑ Yamada R, Okada D, Wang J, Basak T, Koyama S (2021). "Interpretation of omics data analyses". Journal of Human Genetics. 66 (1): 93–102. doi:10.1038/s10038-020-0763-5. PMC 7728595. PMID 32385339.
- 1 2 Subedi, Prabal; Moertl, Simone; Azimzadeh, Omid (2022). "Omics in Radiation Biology: Surprised but Not Disappointed". Radiation. 2: 124–129. doi:10.3390/radiation2010009.
- ↑ Subedi, Prabal; Moertl, Simone; Azimzadeh, Omid (15 February 2022). "Omics in Radiation Biology: Surprised but Not Disappointed". Radiation. 2 (1): 124–129. doi:10.3390/radiation2010009.
- ↑ Alemu, Robel; Sharew, Nigussie T.; Arsano, Yodit Y.; Ahmed, Muktar; Tekola-Ayele, Fasil; Mersha, Tesfaye B.; Amare, Azmeraw T. (31 January 2025). "Multi-omics approaches for understanding gene-environment interactions in noncommunicable diseases: techniques, translation, and equity issues". Human Genomics. 19 (1) 8. doi:10.1186/s40246-025-00718-9. PMC 11786457. PMID 39891174.
- 1 2 O'Donoghue, John; Herbert, John (October 2012). "Data Management within mHealth Environments: Patient Sensors, Mobile Devices, and Databases". Journal of Data and Information Quality. 4 (1): 1–20. doi:10.1145/2378016.2378021.
- ↑ Düking, Peter; Hotho, Andreas; Holmberg, Hans-Christer; Fuss, Franz Konstantin; Sperlich, Billy (9 March 2016). "Comparison of Non-Invasive Individual Monitoring of the Training and Health of Athletes with Commercially Available Wearable Technologies". Frontiers in Physiology. 7: 71. doi:10.3389/fphys.2016.00071. PMC 4783417. PMID 27014077.
- ↑ Zhang, Rukui; Liu, Zhaorui; Zhu, Chaoyu; Cai, Hui; Yin, Kai; Zhong, Fan; Liu, Lei (9 August 2024). "Constructing a Clinical Patient Similarity Network of Gastric Cancer". Bioengineering. 11 (8): 808. doi:10.3390/bioengineering11080808. PMC 11351872. PMID 39199766.
- ↑ Ayeyemi, Bolaji; Shobowale, Karimot; Aliu, Tawakalitu; Abdulkabir, Aliah; Lawal, Muftau (7 August 2024). "Multimodal Artificial Intelligence in Medicine: Integrating Imaging, Genomics, Electronic Health Records, and Wearable Data" (PDF). Biosciences Research & Engineering Network Journal. 01 (1): 01–15. doi:10.53858/bren01010115.
- 1 2 Newman, Mark (2010). Networks: An Introduction. OUP Oxford. ISBN 978-0-19-150070-1.
- ↑ Siam, Masrafe Bin Hannan; Khan, Md Rayhan; Elahe, Md Fazla; Arman, Md Shohel; Akter, Swarna (19 March 2026). "Effects of similarity networks in graph-based multi-omics classification". PLOS ONE. 21 (3) e0344754. Bibcode:2026PLoSO..2144754S. doi:10.1371/journal.pone.0344754. PMC 13001923. PMID 41855231.
- ↑ Liu, Pinyan; Yuan, Han; Ning, Yilin; Chakraborty, Bibhas; Liu, Nan; Peres, Marco Aurélio (18 December 2024). "A modified and weighted Gower distance-based clustering analysis for mixed type data: a simulation and empirical analyses". BMC Medical Research Methodology. 24 (1) 305. doi:10.1186/s12874-024-02427-8. PMC 11654179. PMID 39696017.
- ↑ Briscik, Mitja; Tazza, Gabriele; Vidács, László; Dillies, Marie-Agnès; Déjean, Sébastien (23 November 2024). "Supervised multiple kernel learning approaches for multi-omics data integration". BioData Mining. 17 (1) 53. doi:10.1186/s13040-024-00406-9. PMC 11585117. PMID 39580456.
- ↑ Alipour Pijani, Bizhan; Rifat, Jubair Ibn Malik; Bozdag, Serdar (2026). "MultiGEOmics: Graph-Based Integration of Multi-Omics via Biological Information Flows". bioRxiv 10.64898/2026.01.29.702593.
- ↑ Zafeiropoulos, Nikolaos; Bitilis, Pavlos; Tsekouras, George E.; Kotis, Konstantinos (2 November 2023). "Graph Neural Networks for Parkinson's Disease Monitoring and Alerting". Sensors. 23 (21): 8936. Bibcode:2023Senso..23.8936Z. doi:10.3390/s23218936. PMC 10648881. PMID 37960634.
- 1 2 Yang, Mu; Matan-Lithwick, Stuart; Wang, Yanling; De Jager, Philip L; Bennett, David A; Felsky, Daniel (2 March 2023). "Multi-omic integration via similarity network fusion to detect molecular subtypes of ageing". Brain Communications. 5 (2) fcad110. doi:10.1093/braincomms/fcad110. PMC 10110975. PMID 37082508.
- ↑ He, Bing; Xie, Linhui; Varathan, Pradeep; Nho, Kwangsik; Risacher, Shannon L.; Saykin, Andrew J.; Yan, Jingwen (5 May 2023). "Fused multi-modal similarity network as prior in guiding brain imaging genetic association". Frontiers in Big Data. 6 1151893. doi:10.3389/fdata.2023.1151893. PMC 10196480. PMID 37215688.
- 1 2 3 Wang, Bo; Mezlini, Aziz M; Demir, Feyyaz; Fiume, Marc; Tu, Zhuowen; Brudno, Michael; Haibe-Kains, Benjamin; Goldenberg, Anna (March 2014). "Similarity network fusion for aggregating data types on a genomic scale". Nature Methods. 11 (3): 333–337. Bibcode:2014NaMet..11..333W. doi:10.1038/nmeth.2810. PMID 24464287.
- ↑ Markello, Ross D.; Shafiei, Golia; Tremblay, Christina; Postuma, Ronald B.; Dagher, Alain; Misic, Bratislav (5 January 2021). "Multimodal phenotypic axes of Parkinson's disease". npj Parkinson's Disease. 7 (1) 6. doi:10.1038/s41531-020-00144-9. PMC 7785730. PMID 33402689.
- ↑ Newman, M. E. J. (6 June 2006). "Modularity and community structure in networks". Proceedings of the National Academy of Sciences. 103 (23): 8577–8582. doi:10.1073/pnas.0601602103. PMC 1482622. PMID 16723398.
- ↑ Lundervold, Arvid; Billing, Julie; Berentsen, Birgitte; Lundervold, Astri J. (22 January 2026). "Patient Similarity Networks for Irritable Bowel Syndrome: Revisiting Brain Morphometry and Cognitive Features". Diagnostics. 16 (2): 357. doi:10.3390/diagnostics16020357. PMC 12839715. PMID 41594333.
- ↑ Zhao, Yang; Zhu, Daidai; Yuan, Aihong; Li, Xuelong (October 2025). "Consensus multi-view spectral clustering network with unified similarity". Neural Networks. 190 107647. doi:10.1016/j.neunet.2025.107647. PMID 40513466.
- ↑ Lundervold, Arvid; Billing, Julie; Berentsen, Birgitte; Lundervold, Astri J. (22 January 2026). "Patient Similarity Networks for Irritable Bowel Syndrome: Revisiting Brain Morphometry and Cognitive Features". Diagnostics. 16 (2): 357. doi:10.3390/diagnostics16020357. PMC 12839715. PMID 41594333.
- ↑ Li, Li; Cheng, Wei-Yi; Glicksberg, Benjamin S.; Gottesman, Omri; Tamler, Ronald; Chen, Rong; Bottinger, Erwin P.; Dudley, Joel T. (28 October 2015). "Identification of type 2 diabetes subgroups through topological analysis of patient similarity". Science Translational Medicine. 7 (311): 311ra174. doi:10.1126/scitranslmed.aaa9364. PMC 4780757. PMID 26511511.
- ↑ Maiorino, Enrico; Loscalzo, Joseph (July 2023). "Phenomics and Robust Multiomics Data for Cardiovascular Disease Subtyping". Arteriosclerosis, Thrombosis, and Vascular Biology. 43 (7): 1111–1123. doi:10.1161/ATVBAHA.122.318892. PMC 10330619. PMID 37226730.
- ↑ Nguyen, Tin; Tagett, Rebecca; Diaz, Diana; Draghici, Sorin (December 2017). "A novel approach for data integration and disease subtyping". Genome Research. 27 (12): 2025–2039. doi:10.1101/gr.215129.116. PMC 5741060. PMID 29066617.
- ↑ Sharafoddini, Anis; Dubin, Joel A; Lee, Joon (3 March 2017). "Patient Similarity in Prediction Models Based on Health Data: A Scoping Review". JMIR Medical Informatics. 5 (1): e7. doi:10.2196/medinform.6730. PMC 5357318. PMID 28258046.
- ↑ Tokodi, Márton; Shrestha, Sirish; Bianco, Christopher; Kagiyama, Nobuyuki; Casaclang-Verzosa, Grace; Narula, Jagat; Sengupta, Partho P. (May 2020). "Interpatient Similarities in Cardiac Function". JACC: Cardiovascular Imaging. 13 (5): 1119–1132. doi:10.1016/j.jcmg.2019.12.018. PMC 7556337. PMID 32199835.
- 1 2 Qin, Shimei; Li, Wan; Yu, Hongzheng; Xu, Manyi; Li, Chao; Fu, Lei; Sun, Shibin; He, Yuehan; Lv, Junjie; He, Weiming; Chen, Lina (23 January 2023). "Guiding Drug Repositioning for Cancers Based on Drug Similarity Networks". International Journal of Molecular Sciences. 24 (3): 2244. doi:10.3390/ijms24032244. PMC 9917231. PMID 36768566.
- ↑ Flanary, Victoria L.; Fisher, Jennifer L.; Wilk, Elizabeth J.; Howton, Timothy C.; Lasseigne, Brittany N. (September 2023). "Computational Advancements in Cancer Combination Therapy Prediction". JCO Precision Oncology. 7 (7) e2300261. doi:10.1200/PO.23.00261. PMC 12012855. PMID 37824797.
- ↑ Bhalla, Sherry; Melnekoff, David T.; Keats, Jonathan; Onel, Kenan; Madduri, Deepu; Richter, Joshua; Richard, Shambavi; Chari, Ajai; Cho, Hearn Jay (2020-06-04). "Patient Similarity Network of Multiple Myeloma Identifies Patient Sub-groups with Distinct Genetic and Clinical Features". bioRxiv 10.1101/2020.06.02.129767.
- ↑ Navaz, Alramzana Nujum; T. El-Kassabi, Hadeel; Serhani, Mohamed Adel; Oulhaj, Abderrahim; Khalil, Khaled (10 May 2022). "A Novel Patient Similarity Network (PSN) Framework Based on Multi-Model Deep Learning for Precision Medicine". Journal of Personalized Medicine. 12 (5): 768. doi:10.3390/jpm12050768. PMC 9144142. PMID 35629190.
- ↑ Gliozzo, Jessica; Soto Gomez, Mauricio A; Bonometti, Arturo; Patak, Alex; Casiraghi, Elena; Valentini, Giorgio (29 March 2025). "miss-SNF: a multimodal patient similarity network integration approach to handle completely missing data sources". Bioinformatics. 41 (4) btaf150. doi:10.1093/bioinformatics/btaf150. PMC 12011365. PMID 40184204.
- ↑ Scala, Giovanni; Ferraro, Luigi; Brandi, Aurora; Guo, Yan; Majello, Barbara; Ceccarelli, Michele (28 September 2024). "MoNETA: MultiOmics Network Embedding for SubType Analysis". NAR Genomics and Bioinformatics. 6 (4) lqae141. doi:10.1093/nargab/lqae141. PMC 11482636. PMID 39416887.
- ↑ Xu, Hanhui; Shuttleworth, Kyle Michael James (February 2024). "Medical artificial intelligence and the black box problem: a view based on the ethical principle of 'do no harm'". Intelligent Medicine. 4 (1): 52–57. doi:10.1016/j.imed.2023.08.001.
- ↑ Jin, Yuting; Li, Xiang; Han, Xinsheng; Qiu, Yang; Zhang, Hongyang; Xu, Jianke; Han, Miao (29 September 2025). "SHAP-based interpretable machine learning for Parkinson's disease severity prediction: integrated analysis of clinical and environmental features". Frontiers in Neurology. 16 1678463. doi:10.3389/fneur.2025.1678463. PMC 12515681. PMID 41090034.
- ↑ Abbas, Syed Raza; Abbas, Zeeshan; Zahir, Arifa; Lee, Seung Won (22 December 2024). "Federated Learning in Smart Healthcare: A Comprehensive Review on Privacy, Security, and Predictive Analytics with IoT Integration". Healthcare. 12 (24): 2587. doi:10.3390/healthcare12242587. PMC 11728217. PMID 39766014.