Lightbowne (ward)
Lightbowne | |
|---|---|
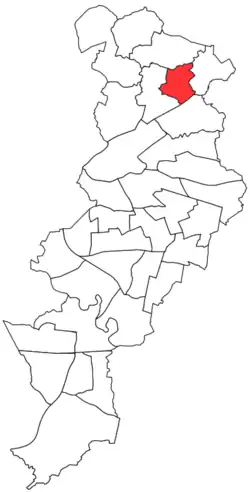 Lightbowne ward (1994) within Manchester | |
 Coat of arms | |
| Country | United Kingdom |
| Constituent country | England |
| Region | North West England |
| County | Greater Manchester |
| Metropolitan borough | Manchester |
| Created | May 1950 |
| Named after | Lightbowne Road, Moston |
| Government | |
| • Type | Unicameral |
| • Body | Manchester City Council |
| UK Parliamentary Constituency | Manchester Blackley |
Lightbowne was an electoral division of Manchester City Council which was represented from 1950 until 2004. It covered part of Moston in North Manchester.
Overview
Lightbowne ward was created in 1950,[1] covering the southern portions of the Blackley and Moston wards. In 1971,[2] the ward incorporated that part of the Blackley ward to the south of the Boggart Hole Brook. Further city-wide boundary revision in 1982,[3] transferred the westernmost portion of the Moston ward to Lightbowne. In 2004, the ward was abolished, and its remaining area was divided between the Harpurhey and Moston wards.[4]
For the entirety of its existence, the ward formed part of the Manchester Blackley Parliamentary constituency.[5][6]
Councillors
| Election | Councillor | Councillor | Councillor | |||
|---|---|---|---|---|---|---|
| 1950 | M. Tylecote (Lab) | W. Onions (Lab) | R. Malcolm (Lab) | |||
| 1951 | J. H. Ferrington (Con) | W. Onions (Lab) | R. Malcolm (Lab) | |||
| 1952 | J. H. Ferrington (Con) | W. Onions (Lab) | R. Malcolm (Lab) | |||
| September 1952 | J. H. Ferrington (Con) | H. Pigott (Con) | R. Malcolm (Lab) | |||
| 1953 | J. H. Ferrington (Con) | H. Pigott (Con) | R. Malcolm (Lab) | |||
| 1954 | D. Pigott (Con) | H. Pigott (Con) | R. Malcolm (Lab) | |||
| 1955 | D. Pigott (Con) | H. Pigott (Con) | J. Chatterton (Con) | |||
| 1956 | D. Pigott (Con) | H. Pigott (Con) | J. Chatterton (Con) | |||
| 1957 | G. Halstead (Lab) | H. Pigott (Con) | J. Chatterton (Con) | |||
| 1958 | G. Halstead (Lab) | H. Pigott (Con) | K. Franklin (Lab) | |||
| 1959 | G. Halstead (Lab) | H. Pigott (Con) | K. Franklin (Lab) | |||
| 1960 | A. Tetlow (Con) | H. Pigott (Con) | K. Franklin (Lab) | |||
| 1961 | A. Tetlow (Con) | H. Pigott (Con) | K. Franklin (Lab) | |||
| 1962 | A. Tetlow (Con) | H. Pigott (Con) | K. Franklin (Lab) | |||
| 1963 | L. Kelly (Lab) | H. Pigott (Con) | K. Franklin (Lab) | |||
| 1964 | L. Kelly (Lab) | H. Pigott (Con) | K. Franklin (Lab) | |||
| 1965 | L. Kelly (Lab) | H. Pigott (Con) | K. Franklin (Lab) | |||
| 1966 | L. Kelly (Lab) | H. Pigott (Con) | K. Franklin (Lab) | |||
| 1967 | L. Kelly (Lab) | H. Pigott (Con) | N. A. Green (Con) | |||
| 1968 | L. Kelly (Lab) | H. Pigott (Con) | N. A. Green (Con) | |||
| September 1968 | L. Kelly (Lab) | J. Jackson (Con) | N. A. Green (Con) | |||
| 1969 | F. Taylor (Con) | J. Jackson (Con) | N. A. Green (Con) | |||
| 1970 | F. Taylor (Con) | J. Jackson (Con) | N. A. Green (Con) | |||
| 1971 | H. T. Lee (Lab) | S. Smith (Lab) | R. A. Reddington (Lab) | |||
| 1972 | H. T. Lee (Lab) | S. Smith (Lab) | R. A. Reddington (Lab) | |||
| 1973 | H. T. Lee (Lab) | R. A. Reddington (Lab) | E. Jones (Con) | |||
| 1975 | H. T. Lee (Lab) | R. A. Reddington (Lab) | E. Jones (Con) | |||
| 1976 | H. T. Lee (Lab) | G. Cleworth (Con) | E. Jones (Con) | |||
| 1978 | H. T. Lee (Lab) | G. Cleworth (Con) | E. Jones (Con) | |||
| 1979 | H. T. Lee (Lab) | G. Cleworth (Con) | P. A. Murphy (Lab) | |||
| 1980 | H. T. Lee (Lab) | A. D. Kelly (Lab) | P. A. Murphy (Lab) | |||
| 1982 | P. A. Murphy (Lab) | A. D. Kelly (Lab) | D. Shaw (Lab) | |||
| 1983 | P. A. Murphy (Lab) | A. D. Kelly (Lab) | D. Shaw (Lab) | |||
| 1984 | P. A. Murphy (Lab) | A. D. Kelly (Lab) | D. Shaw (Lab) | |||
| 1986 | K. Franklin (Lab) | A. D. Kelly (Lab) | D. Shaw (Lab) | |||
| 1987 | K. Franklin (Lab) | A. D. Kelly (Lab) | G. Carey (Con) | |||
| 1988 | K. Franklin (Lab) | W. Risby (Lab) | G. Carey (Con) | |||
| June 1988 | K. Franklin (Lab) | W. Risby (Lab) | G. Carey (Ind. Con) | |||
| 1990 | K. Franklin (Lab) | W. Risby (Lab) | G. Carey (Ind. Con) | |||
| September 1990 | K. Franklin (Lab) | W. Risby (Lab) | C. M. Inchbold (Lab) | |||
| 1991 | K. Franklin (Lab) | W. Risby (Lab) | C. M. Inchbold (Lab) | |||
| 1992 | K. Franklin (Lab) | W. Risby (Lab) | C. M. Inchbold (Lab) | |||
| 1994 | K. Franklin (Lab) | W. Risby (Lab) | C. M. Inchbold (Lab) | |||
| 1995 | K. Franklin (Lab) | W. Risby (Lab) | C. M. Inchbold (Lab) | |||
| 1996 | K. Franklin (Lab) | W. Risby (Lab) | C. M. Inchbold (Lab) | |||
| 1998 | K. Franklin (Lab) | W. Risby (Lab) | C. M. Inchbold (Lab) | |||
| 1999 | K. Franklin (Lab) | W. Risby (Lab) | P. A. Murphy (Lab) | |||
| 2000 | K. Franklin (Lab) | W. Risby (Lab) | P. A. Murphy (Lab) | |||
| 2002 | K. Franklin (Lab) | W. Risby (Lab) | P. A. Murphy (Lab) | |||
| 2003 | K. Franklin (Lab) | W. Risby (Lab) | P. A. Murphy (Lab) | |||
Elections
Elections in 1950s
May 1950
| Party | Candidate | Votes | % | ±% | |
|---|---|---|---|---|---|
| Labour | W. Onions* | 4,294 | |||
| Conservative | J. H. Ferrington | ||||
| Communist | E. C. Dalton | ||||
| Majority | |||||
| Turnout | |||||
| Labour hold | Swing | ||||
May 1951
| Party | Candidate | Votes | % | ±% | |
|---|---|---|---|---|---|
| Conservative | J. H. Ferrington | 4,539 | 53.1 | ||
| Labour | M. Tylecote* | 3,098 | 36.3 | ||
| Liberal | C. N. Higginson | 903 | 10.6 | ||
| Majority | 1,441 | 16.8 | |||
| Turnout | 8,540 | ||||
| Conservative gain from Labour | Swing | ||||
May 1952
| Party | Candidate | Votes | % | ±% | |
|---|---|---|---|---|---|
| Labour | R. Malcolm* | 4,600 | 46.9 | +10.6 | |
| Conservative | H. Piggott | 4,544 | 46.3 | −6.8 | |
| Liberal | C. N. Higginson | 666 | 6.8 | −3.8 | |
| Majority | 56 | 0.6 | |||
| Turnout | 9,810 | ||||
| Labour hold | Swing | ||||
September 1952 (by-election)
| Party | Candidate | Votes | % | ±% | |
|---|---|---|---|---|---|
| Conservative | H. Piggott | 4,180 | 51.8 | +5.5 | |
| Labour | J. Clough | 3,565 | 44.2 | −2.7 | |
| Liberal | R. Frere | 319 | 4.0 | −2.8 | |
| Majority | 615 | 7.6 | |||
| Turnout | 8,064 | ||||
| Conservative gain from Labour | Swing | ||||
May 1953
| Party | Candidate | Votes | % | ±% | |
|---|---|---|---|---|---|
| Conservative | H. Piggott* | 4,742 | 56.1 | +9.8 | |
| Labour | G. Halstead | 3,709 | 43.9 | −3.0 | |
| Majority | 1,033 | 12.2 | +11.6 | ||
| Turnout | 8,451 | ||||
| Conservative hold | Swing | ||||
May 1954
| Party | Candidate | Votes | % | ±% | |
|---|---|---|---|---|---|
| Conservative | D. Piggott* | 3,840 | 48.4 | −7.7 | |
| Labour | G. Halstead | 3,508 | 44.2 | +0.3 | |
| Liberal | F. N. Wedlock | 583 | 7.4 | N/A | |
| Majority | 332 | 4.2 | −8.0 | ||
| Turnout | 7,931 | ||||
| Conservative hold | Swing | ||||
May 1955
| Party | Candidate | Votes | % | ±% | |
|---|---|---|---|---|---|
| Conservative | J. Chatterton | 3,665 | 49.8 | +1.4 | |
| Labour | R. Malcolm* | 3,080 | 41.8 | −2.4 | |
| Liberal | F. N. Wedlock | 619 | 8.4 | +1.0 | |
| Majority | 585 | 8.0 | +3.8 | ||
| Turnout | 7,364 | ||||
| Conservative gain from Labour | Swing | ||||
May 1956
| Party | Candidate | Votes | % | ±% | |
|---|---|---|---|---|---|
| Conservative | H. Piggott* | 3,268 | 50.4 | +0.6 | |
| Labour | G. Halstead | 2,536 | 39.1 | −2.7 | |
| Liberal | F. N. Wedlock | 683 | 10.5 | +2.1 | |
| Majority | 732 | 11.3 | +3.3 | ||
| Turnout | 6,487 | ||||
| Conservative hold | Swing | ||||
May 1957
| Party | Candidate | Votes | % | ±% | |
|---|---|---|---|---|---|
| Labour | G. Halstead | 2,889 | 43.0 | +3.9 | |
| Conservative | D. Piggott* | 2,852 | 42.5 | −7.9 | |
| Liberal | F. N. Wedlock | 973 | 14.5 | +4.0 | |
| Majority | 37 | 0.5 | |||
| Turnout | 6,714 | ||||
| Labour gain from Conservative | Swing | ||||
May 1958
| Party | Candidate | Votes | % | ±% | |
|---|---|---|---|---|---|
| Labour | K. Franklin | 3,305 | 46.7 | +3.7 | |
| Conservative | J. Chatterton* | 2,210 | 31.2 | −11.3 | |
| Liberal | F. N. Wedlock | 1,563 | 22.1 | +7.6 | |
| Majority | 1,095 | 15.5 | +15.0 | ||
| Turnout | 7,078 | ||||
| Labour gain from Conservative | Swing | ||||
May 1959
| Party | Candidate | Votes | % | ±% | |
|---|---|---|---|---|---|
| Conservative | H. Piggott* | 3,399 | 46.9 | +15.7 | |
| Labour | L. Kelly | 2,688 | 37.1 | −9.6 | |
| Liberal | F. N. Wedlock | 1,153 | 16.0 | −6.1 | |
| Majority | 711 | 9.8 | −5.7 | ||
| Turnout | 7,240 | ||||
| Conservative hold | Swing | ||||
Elections in 1960s
May 1960
| Party | Candidate | Votes | % | ±% | |
|---|---|---|---|---|---|
| Conservative | A. Tetlow | 2,766 | 47.0 | +0.1 | |
| Labour | G. Halstead* | 2,122 | 36.0 | −1.1 | |
| Liberal | E. Platt | 1,001 | 17.0 | +1.0 | |
| Majority | 644 | 11.0 | +1.2 | ||
| Turnout | 5,889 | ||||
| Conservative gain from Labour | Swing | ||||
May 1961
| Party | Candidate | Votes | % | ±% | |
|---|---|---|---|---|---|
| Labour | K. Franklin* | 2,859 | 41.5 | +5.5 | |
| Conservative | J. S. Cumpstay | 2,718 | 39.4 | −7.6 | |
| Liberal | E. Platt | 1,320 | 19.1 | +2.1 | |
| Majority | 141 | 2.1 | |||
| Turnout | 6,897 | ||||
| Labour hold | Swing | ||||
May 1962
| Party | Candidate | Votes | % | ±% | |
|---|---|---|---|---|---|
| Conservative | H. Pigott* | 2,633 | 38.6 | −0.6 | |
| Labour | G. Halstead | 2,394 | 35.1 | −6.4 | |
| Liberal | E. Platt | 1,551 | 22.7 | +3.6 | |
| Ratepayers | E. Alderton | 247 | 3.6 | N/A | |
| Majority | 239 | 3.5 | |||
| Turnout | 6,825 | ||||
| Conservative hold | Swing | ||||
May 1963
| Party | Candidate | Votes | % | ±% | |
|---|---|---|---|---|---|
| Labour | L. Kelly | 2,648 | 42.5 | +7.4 | |
| Conservative | A. Tetlow* | 2,070 | 33.3 | −5.3 | |
| Liberal | H. Roche | 1,507 | 24.2 | +1.5 | |
| Majority | 578 | 9.2 | |||
| Turnout | 6,225 | ||||
| Labour gain from Conservative | Swing | ||||
May 1964
| Party | Candidate | Votes | % | ±% | |
|---|---|---|---|---|---|
| Labour | K. Franklin* | 2,700 | 46.1 | +3.6 | |
| Conservative | A. Tetlow | 2,080 | 35.5 | +2.2 | |
| Liberal | H. Roche | 1,080 | 18.4 | −5.8 | |
| Majority | 620 | 10.6 | +1.4 | ||
| Turnout | 5,860 | ||||
| Labour hold | Swing | ||||
May 1965
| Party | Candidate | Votes | % | ±% | |
|---|---|---|---|---|---|
| Conservative | H. Pigott* | 2,654 | 45.7 | +10.2 | |
| Labour | P. T. Taylor | 1,819 | 31.3 | −14.8 | |
| Liberal | H. Roche | 1,220 | 21.0 | +2.6 | |
| Communist | L. Cole | 118 | 2.0 | N/A | |
| Majority | 835 | 14.4 | |||
| Turnout | 5,811 | ||||
| Conservative hold | Swing | ||||
May 1966
| Party | Candidate | Votes | % | ±% | |
|---|---|---|---|---|---|
| Labour | L. Kelly* | 2,012 | 41.8 | +10.5 | |
| Conservative | A. Tetlow | 1,935 | 40.2 | −5.5 | |
| Liberal | H. Roche | 815 | 17.0 | −4.0 | |
| Communist | F. J. Keeney | 48 | 1.0 | −1.0 | |
| Majority | 77 | 1.6 | |||
| Turnout | 4,810 | ||||
| Labour hold | Swing | ||||
May 1967
| Party | Candidate | Votes | % | ±% | |
|---|---|---|---|---|---|
| Conservative | N. A. Green | 2,396 | 46.5 | +6.3 | |
| Labour | K. Franklin* | 1,846 | 35.8 | −6.0 | |
| Liberal | H. Roche | 848 | 16.4 | −0.6 | |
| Communist | F. J. Keeney | 66 | 1.3 | +0.3 | |
| Majority | 550 | 10.7 | |||
| Turnout | 5,156 | ||||
| Conservative gain from Labour | Swing | ||||
May 1968
| Party | Candidate | Votes | % | ±% | |
|---|---|---|---|---|---|
| Conservative | H. Pigott* | 2,946 | 61.9 | +15.4 | |
| Labour | K. Franklin | 1,703 | 35.7 | −0.1 | |
| Communist | R. Cole | 114 | 2.4 | +1.1 | |
| Majority | 1,243 | 26.2 | +15.5 | ||
| Turnout | 4,763 | ||||
| Conservative hold | Swing | ||||
September 1968 (by-election)
| Party | Candidate | Votes | % | ±% | |
|---|---|---|---|---|---|
| Conservative | J. Jackson | 1,716 | 49.2 | −12.7 | |
| Labour | K. Franklin | 1,707 | 48.9 | +13.2 | |
| Communist | R. Cole | 65 | 1.9 | −0.5 | |
| Majority | 9 | 0.3 | −25.9 | ||
| Turnout | 3,488 | ||||
| Conservative hold | Swing | ||||
May 1969
| Party | Candidate | Votes | % | ±% | |
|---|---|---|---|---|---|
| Conservative | F. Taylor | 2,318 | 46.1 | −15.8 | |
| Labour | L. Kelly* | 1,535 | 30.5 | −5.2 | |
| Liberal | H. Roche | 1,097 | 21.8 | N/A | |
| Communist | R. Cole | 83 | 1.6 | −0.8 | |
| Majority | 783 | 15.6 | −10.6 | ||
| Turnout | 5,033 | ||||
| Conservative gain from Labour | Swing | ||||
Elections in 1970s
May 1970
| Party | Candidate | Votes | % | ±% | |
|---|---|---|---|---|---|
| Conservative | N. A. Green* | 2,116 | 43.9 | −2.2 | |
| Labour | W. Lister | 2,013 | 41.8 | +11.3 | |
| Liberal | G. H. Wilkinson | 665 | 13.8 | −8.0 | |
| Residents | T. Tennyson-Smith | 23 | 0.5 | N/A | |
| Majority | 103 | 2.1 | −13.5 | ||
| Turnout | 4,817 | ||||
| Conservative hold | Swing | ||||
May 1971
| Party | Candidate | Votes | % | ±% | |
|---|---|---|---|---|---|
| Labour | H. T. Lee | 3,383 | 57.8 | ||
| Labour | S. Smith | 3,302 | 56.4 | ||
| Labour | R. A. Reddington | 3,297 | 56.3 | ||
| Conservative | J. Jackson* | 1,830 | 31.3 | ||
| Conservative | N. A. Green* | 1,819 | 31.1 | ||
| Conservative | E. Jones | 1,770 | 30.3 | ||
| Liberal | H. Roche | 843 | 14.4 | ||
| Liberal | R. Jackson | 713 | 12.2 | ||
| Liberal | G. H. Wilkinson | 597 | 11.9 | ||
| Majority | 1,467 | 25.1 | |||
| Turnout | 5,851 | ||||
| Labour win (new seat) | |||||
| Labour win (new seat) | |||||
| Labour win (new seat) | |||||
May 1972
| Party | Candidate | Votes | % | ±% | |
|---|---|---|---|---|---|
| Labour | R. A. Reddington* | 1,877 | 38.8 | −19.0 | |
| Conservative | N. A. Green | 1,868 | 38.6 | +7.3 | |
| Liberal | J. Lindsay | 1,098 | 22.6 | +8.2 | |
| Majority | 9 | 0.2 | −24.9 | ||
| Turnout | 4,843 | ||||
| Labour hold | Swing | ||||
May 1973
| Party | Candidate | Votes | % | ±% | |
|---|---|---|---|---|---|
| Labour | H. T. Lee* | 1,618 | 36.9 | −1.9 | |
| Labour | R. A. Reddington* | 1,570 | 35.8 | −3.0 | |
| Conservative | E. Jones | 1,569 | 35.8 | −2.8 | |
| Conservative | E. D. Kirkup | 1,558 | 35.5 | −3.1 | |
| Labour | S. Smith* | 1,547 | 35.3 | −3.5 | |
| Conservative | D. Porter | 1,511 | 34.5 | −4.1 | |
| Independent Liberal | I. Lindsay | 865 | 19.7 | N/A | |
| Liberal | R. Jackson | 765 | 17.4 | −5.2 | |
| Liberal | I. Garrard | 655 | 14.9 | −7.7 | |
| Liberal | G. Garrard | 627 | 14.3 | −8.3 | |
| Majority | 12 | 0.3 | |||
| Turnout | 4,385 | ||||
| Labour hold | Swing | ||||
| Labour hold | Swing | ||||
| Conservative gain from Labour | Swing | ||||
May 1975
| Party | Candidate | Votes | % | ±% | |
|---|---|---|---|---|---|
| Conservative | E. Jones* | 1,546 | 38.4 | +5.8 | |
| Labour | F. Done | 1,358 | 33.7 | +0.1 | |
| Liberal | H. Roche | 1,122 | 27.9 | +12.0 | |
| Majority | 188 | 4.7 | +3.6 | ||
| Turnout | 4,026 | ||||
| Conservative hold | Swing | +2.8 | |||
May 1976
| Party | Candidate | Votes | % | ±% | |
|---|---|---|---|---|---|
| Conservative | G. Cleworth | 2,308 | 52.7 | +14.3 | |
| Labour | R. A. Reddington* | 2,068 | 47.3 | +13.6 | |
| Majority | 240 | 5.5 | +0.8 | ||
| Turnout | 4,376 | ||||
| Conservative gain from Labour | Swing | +0.3 | |||
May 1978
| Party | Candidate | Votes | % | ±% | |
|---|---|---|---|---|---|
| Labour | H. T. Lee* | 2,560 | 55.5 | +8.2 | |
| Conservative | N. McHardy | 2,051 | 44.5 | −8.2 | |
| Majority | 509 | 11.0 | +5.5 | ||
| Turnout | 4,611 | 43.0 | |||
| Labour hold | Swing | +8.2 | |||
May 1979
| Party | Candidate | Votes | % | ±% | |
|---|---|---|---|---|---|
| Labour | P. A. Murphy | 4,358 | 55.2 | −0.3 | |
| Conservative | V. E. Clare | 2,787 | 35.3 | −9.2 | |
| Liberal | K. Osbourne | 743 | 9.4 | +9.4 | |
| Majority | 1,571 | 19.9 | +8.9 | ||
| Turnout | 7,888 | 74.8 | +31.8 | ||
| Labour gain from Conservative | Swing | +4.4 | |||
Elections in 1980s
May 1980
| Party | Candidate | Votes | % | ±% | |
|---|---|---|---|---|---|
| Labour | A. D. Kelly | 2,632 | 61.0 | +5.8 | |
| Conservative | G. Cleworth* | 1,459 | 33.8 | −1.5 | |
| Liberal | B. V. Roberts | 224 | 5.2 | −4.2 | |
| Majority | 1,173 | 27.2 | +7.3 | ||
| Turnout | 4,315 | 41.3 | −33.5 | ||
| Labour gain from Conservative | Swing | +3.6 | |||
May 1982
| Party | Candidate | Votes | % | ±% | |
|---|---|---|---|---|---|
| Labour | Paul Murphy* | 2,145 | 44.4 | ||
| Labour | Alison Kelly* | 1,952 | 40.4 | ||
| Labour | Derek Shaw | 1,950 | 40.4 | ||
| Conservative | Albert Bolland | 1,340 | 27.7 | ||
| Conservative | Vincent Clare | 1,333 | 27.6 | ||
| Conservative | Grace Cleworth | 1,315 | 27.2 | ||
| Liberal | Frederick Pinder | 1,184 | 24.5 | ||
| Liberal | James Ashley | 1,168 | 24.2 | ||
| Liberal | Elizabeth Thompson | 1,043 | 21.6 | ||
| Independent | George Croston | 147 | 3.0 | ||
| Majority | 610 | 12.7 | |||
| Turnout | 4,831 | 47.6 | |||
| Labour win (new seat) | |||||
| Labour win (new seat) | |||||
| Labour win (new seat) | |||||
May 1983
| Party | Candidate | Votes | % | ±% | |
|---|---|---|---|---|---|
| Labour | Derek Shaw* | 2,543 | 53.3 | +8.7 | |
| Conservative | Albert Bolland | 1,678 | 35.2 | +7.3 | |
| Liberal | John Cookson | 551 | 11.5 | −13.0 | |
| Majority | 865 | 18.1 | +1.4 | ||
| Turnout | 4,772 | ||||
| Labour hold | Swing | +0.7 | |||
May 1984
| Party | Candidate | Votes | % | ±% | |
|---|---|---|---|---|---|
| Labour | Alison Kelly* | 2,576 | 56.0 | +2.7 | |
| Conservative | Gwendoline Hurley | 1,556 | 33.8 | −1.4 | |
| Liberal | John Cookson | 471 | 10.2 | −1.3 | |
| Majority | 1,020 | 22.2 | +4.1 | ||
| Turnout | 4,603 | ||||
| Labour hold | Swing | +2.0 | |||
May 1986
| Party | Candidate | Votes | % | ±% | |
|---|---|---|---|---|---|
| Labour | K. Franklin | 2,842 | 63.1 | +7.1 | |
| Conservative | J. Bailey | 1,040 | 23.1 | −10.7 | |
| Liberal | D. Porter | 620 | 13.8 | +3.6 | |
| Majority | 1,802 | 40.0 | +17.8 | ||
| Turnout | 4,502 | ||||
| Labour hold | Swing | +8.9 | |||
May 1987
| Party | Candidate | Votes | % | ±% | |
|---|---|---|---|---|---|
| Conservative | Gerry Carey | 2,035 | 38.6 | +15.5 | |
| Labour | Derek Shaw* | 1,855 | 35.2 | −27.9 | |
| Liberal | David Porter | 1,385 | 26.3 | +12.5 | |
| Majority | 180 | 3.4 | −36.6 | ||
| Turnout | 5,275 | ||||
| Conservative gain from Labour | Swing | +21.7 | |||
May 1988
| Party | Candidate | Votes | % | ±% | |
|---|---|---|---|---|---|
| Labour | W. Risby | 2,497 | 50.8 | +15.6 | |
| Conservative | J. A. Smeaton | 1,882 | 38.3 | −0.3 | |
| SLD | D. Porter | 464 | 9.4 | −16.9 | |
| Green | R. Wallace | 72 | 1.5 | +1.5 | |
| Majority | 615 | 12.5 | +9.1 | ||
| Turnout | 4,915 | ||||
| Labour hold | Swing | +7.9 | |||
Elections in 1990s
May 1990
| Party | Candidate | Votes | % | ±% | |
|---|---|---|---|---|---|
| Labour | K. Franklin* | 2,927 | 65.4 | +14.6 | |
| Conservative | A. G. Edwardson | 832 | 18.6 | −19.7 | |
| Liberal Democrats | D. Porter | 489 | 10.9 | +1.5 | |
| Green | G. F. Carter | 226 | 5.1 | +3.6 | |
| Majority | 2,095 | 46.8 | +34.3 | ||
| Turnout | 4,474 | ||||
| Labour hold | Swing | +17.1 | |||
September 1990 (by-election)
| Party | Candidate | Votes | % | ±% | |
|---|---|---|---|---|---|
| Labour | C. M. Inchbold | 1,532 | 55.7 | −9.7 | |
| Conservative | D. Shaw | 874 | 31.8 | +13.2 | |
| Green | G. F. Carter | 174 | 6.3 | +1.2 | |
| Liberal Democrats | C. Turner | 170 | 6.2 | −4.7 | |
| Majority | 658 | 23.9 | −22.9 | ||
| Turnout | 2,750 | ||||
| Labour gain from Ind. Conservative | Swing | ||||
May 1991
| Party | Candidate | Votes | % | ±% | |
|---|---|---|---|---|---|
| Labour | C. M. Inchbold* | 2,081 | 54.3 | −11.1 | |
| Conservative | M. P. Steadman | 1,054 | 27.5 | +8.9 | |
| Liberal Democrats | P. G. Matthews | 700 | 18.3 | +7.4 | |
| Majority | 1,027 | 26.8 | −20.0 | ||
| Turnout | 3,835 | 39.9 | |||
| Labour hold | Swing | -10.0 | |||
May 1992
| Party | Candidate | Votes | % | ±% | |
|---|---|---|---|---|---|
| Labour | W. Risby* | 1,709 | 58.4 | +4.1 | |
| Conservative | M. Steadman | 929 | 31.7 | +4.2 | |
| Liberal Democrats | P. Matthews | 288 | 9.8 | −8.5 | |
| Majority | 780 | 26.7 | −0.1 | ||
| Turnout | 2,926 | ||||
| Labour hold | Swing | -0.0 | |||
May 1994
| Party | Candidate | Votes | % | ±% | |
|---|---|---|---|---|---|
| Labour | K. Franklin* | 2,395 | 75.2 | +16.8 | |
| Conservative | M. Steadman | 413 | 13.0 | −18.7 | |
| Liberal Democrats | D. Gordon | 376 | 11.8 | +2.0 | |
| Majority | 1,982 | 62.2 | +35.5 | ||
| Turnout | 3,184 | ||||
| Labour hold | Swing | +17.7 | |||
May 1995
| Party | Candidate | Votes | % | ±% | |
|---|---|---|---|---|---|
| Labour | Cath Inchbold* | 1,853 | 73.8 | −1.4 | |
| Conservative | Henry Coombes | 344 | 13.7 | +0.7 | |
| Liberal Democrats | David Gordon | 242 | 9.6 | −2.2 | |
| Green | A. Salter | 73 | 2.9 | +2.9 | |
| Majority | 1,509 | 60.1 | −2.1 | ||
| Turnout | 2,512 | ||||
| Labour hold | Swing | -1.0 | |||
May 1996
| Party | Candidate | Votes | % | ±% | |
|---|---|---|---|---|---|
| Labour | William Risby* | 1,757 | 75.8 | +2.0 | |
| Conservative | M. Steadman | 315 | 13.6 | −0.1 | |
| Liberal Democrats | David Gordon | 186 | 8.0 | −1.6 | |
| Green | Philip Maile | 60 | 2.6 | −0.3 | |
| Majority | 1,442 | 62.2 | +2.1 | ||
| Turnout | 2,318 | ||||
| Labour hold | Swing | +1.0 | |||
May 1998
| Party | Candidate | Votes | % | ±% | |
|---|---|---|---|---|---|
| Labour | Kenneth Franklin* | 1,277 | 71.7 | −4.1 | |
| Conservative | William Clapham | 258 | 14.5 | +0.9 | |
| Liberal Democrats | Samantha McCormick | 247 | 13.9 | +5.9 | |
| Majority | 1,019 | 57.2 | −5.0 | ||
| Turnout | 1,782 | ||||
| Labour hold | Swing | -2.5 | |||
May 1999
| Party | Candidate | Votes | % | ±% | |
|---|---|---|---|---|---|
| Labour | Paul Murphy | 1,231 | 71.7 | −0.0 | |
| Conservative | Teresa Skorzewski | 270 | 15.7 | +1.2 | |
| Liberal Democrats | Elsie Slater | 217 | 12.6 | −1.3 | |
| Majority | 961 | 55.9 | −1.3 | ||
| Turnout | 1,718 | 20.1 | |||
| Labour hold | Swing | -0.6 | |||
Elections in 2000s
May 2000
| Party | Candidate | Votes | % | ±% | |
|---|---|---|---|---|---|
| Labour | William Risby* | 987 | 64.6 | −7.1 | |
| Liberal Democrats | David Gordon | 428 | 28.0 | +15.4 | |
| Green | Simon Chislett | 114 | 7.5 | +7.5 | |
| Majority | 559 | 36.6 | −19.3 | ||
| Turnout | 1,529 | 19.2 | −0.9 | ||
| Labour hold | Swing | -11.2 | |||
May 2002
| Party | Candidate | Votes | % | ±% | |
|---|---|---|---|---|---|
| Labour | Kenneth Franklin* | 1,365 | 71.4 | +6.8 | |
| Conservative | Howard Varney | 261 | 13.6 | +13.6 | |
| Liberal Democrats | Kevin Morley | 258 | 13.5 | −14.5 | |
| Green | Matthew Payne | 29 | 1.5 | −6.0 | |
| Majority | 1,104 | 57.7 | +21.1 | ||
| Turnout | 1,913 | 23.0 | +3.8 | ||
| Labour hold | Swing | -3.4 | |||
May 2003
| Party | Candidate | Votes | % | ±% | |
|---|---|---|---|---|---|
| Labour | Paul Murphy* | 1,177 | 70.5 | −0.9 | |
| Liberal Democrats | Stephen Allen | 213 | 12.8 | −0.7 | |
| Conservative | Howard Varney | 198 | 11.9 | −1.7 | |
| Green | Matthew Payne | 82 | 4.9 | +3.4 | |
| Majority | 964 | 57.7 | +0.0 | ||
| Turnout | 1,670 | 20.0 | −3.0 | ||
| Labour hold | Swing | -0.1 | |||
See also
References
- ↑ TORIES' NET GAIN OF TWO SEATS IN MANCHESTER, Manchester Guardian, May 12, 1950, p.8
- ↑ Council graph shows new records, The Guardian, May 24, 1971, p.6
- ↑ Manchester City Council Election Results, 2nd Edition, Swarbrick (1993).
- ↑ "Manchester 2004 council election results". manchester.gov.uk. Archived from the original on 2004-06-26. Retrieved 2012-01-12.
- ↑ "Representation of the People Act 1948: Schedule 1", legislation.gov.uk, The National Archives, 1948 c. 65 (sch. 1), retrieved 27 February 2023
- ↑ "The Parliamentary Constituencies (Manchester) Order 1973", legislation.gov.uk, The National Archives, SI 1973/606, retrieved 26 February 2023
Category: