List of senators
NOTE: The following information was gathered from the Florida Senate website. Only records of senators from 1998–present are kept.
| Portrait |
Name |
Party |
Years of service |
Home city/state |
Notes |
|---|
 |
|
Democratic |
1998–2002 |
|
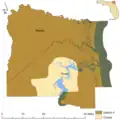
Consisted of Baker, Dixie, Gilchrist, Hamilton, Lafayette, Nassau, Taylor and parts of Alachua, Bradford, Citrus, Columbia, Jefferson, Leon, Levy, Madison, Marion, Suwannee and Union county |
 |
|
Republican |
1998–2006 |
|
|
 |
|
Republican |
2006–2012 |
|
Consisted of parts of Bay, Escambia, Okaloosa, Santa Rosa, Walton counties |
 |
|
Republican |
2012–2022 |
|
|
 |
|
Republican |
2022–Present |
|
Consists of Nassau county and part of Duval county |
Elections
NOTE: The following results were gathered from the Florida Department of State. Uncontested election results are not provided.
1978
Democratic Primary (1978)[1]
| Party |
Candidate |
Votes |
% |
|
Democratic |
Pat Thomas |
68,599 |
85.7% |
|
Democratic |
Lenora Walsh |
11,417 |
14.3% |
| Total votes |
80,016 |
100% |
1982
Democratic Primary (1982)[2]
| Party |
Candidate |
Votes |
% |
|
Democratic |
C. P. "Pat" Brewer |
15,158 |
43.2% |
|
Democratic |
Karen Thurman |
19,935 |
56.8% |
| Total votes |
35,093 |
100% |
General Election (1982)[3]
| Party |
Candidate |
Votes |
% |
|
Democratic |
Karen L. Thurman |
51,983 |
54.4% |
|
Republican |
Thad Lowerey |
43,590 |
45.6% |
| Total votes |
95,573 |
100% |
1986
General Election (1986)[4]
| Party |
Candidate |
Votes |
% |
|
Democratic |
Karen L. Thurman |
77,029 |
61.2% |
|
Republican |
Lewis Dinkins |
48,820 |
38.8% |
| Total votes |
125,849 |
100% |
1990
Republican Primary (1990)[5]
| Party |
Candidate |
Votes |
% |
|
Republican |
Merl Conine |
7,094 |
25.7% |
|
Republican |
Tom Hogan |
20,530 |
74.3% |
| Total votes |
27,624 |
100% |
General Election (1990)[6]
| Party |
Candidate |
Votes |
% |
|
Republican |
Tom Hogan |
59,695 |
41.4% |
|
Democratic |
Karen L. Thurman |
84,661 |
58.6% |
| Total votes |
114,356 |
100% |
1992
Democratic Primary Runoff (1992)[8]
| Party |
Candidate |
Votes |
% |
|
Democratic |
Don Tucker |
26,353 |
45.7% |
|
Democratic |
Charles Williams |
31,340 |
54.3% |
| Total votes |
57,693 |
100% |
1994
Democratic Primary (1994)[9]
| Party |
Candidate |
Votes |
% |
|
Democratic |
Bob Glover |
11,131 |
22.2% |
|
Democratic |
Glenn Jones |
8,160 |
16.2% |
|
Democratic |
Lamar "Poss" Lee |
5,291 |
10.5% |
|
Democratic |
Charles Williams |
25,670 |
51.1% |
| Total votes |
50,252 |
100% |
General Election (1994)[10]
| Party |
Candidate |
Votes |
% |
|
Democratic |
Charles Williams |
67,800 |
60.7% |
|
Republican |
George Onett |
43,988 |
39.3% |
| Total votes |
111,788 |
100% |
1998
Democratic Primary (1998)[11]
| Party |
Candidate |
Votes |
% |
|
Democratic |
Richard Mitchell |
23,146 |
52.7% |
|
Democratic |
Charles D. Williams |
20,733 |
47.3% |
| Total votes |
43,879 |
100% |
2002
Republican Primary (2002)[12]
| Party |
Candidate |
Votes |
% |
|
Republican |
Charlie Clary |
25,135 |
54.5% |
|
Republican |
Jerry Melvin |
20,946 |
45.5% |
| Total votes |
46,081 |
100% |
2012
Republican Primary (2012)[13]
| Party |
Candidate |
Votes |
% |
|
Republican |
Aaron Bean |
31,269 |
64.2% |
|
Republican |
Mike Weinstein |
17,451 |
35.8% |
| Total votes |
48,720 |
100% |
General Election (2012)[14]
| Party |
Candidate |
Votes |
% |
|
Republican |
Aaron Bean |
144,352 |
62.2% |
|
Democratic |
Nancy Soderberg |
87,766 |
37.8% |
|
Write-In |
Kyle Alexander Bedran |
0 |
0.0% |
|
Write-In |
Patrick Dewayne Mency |
0 |
0.0% |
| Total votes |
232,118 |
100% |
2018
Republican Primary (2018)[15]
| Party |
Candidate |
Votes |
% |
|
Republican |
Aaron Bean |
50,275 |
87.4% |
|
Republican |
Carlos E. Slay |
7,274 |
12.6% |
| Total votes |
57,549 |
100% |
General Election (2018)[16]
| Party |
Candidate |
Votes |
% |
|
Republican |
Aaron Bean |
149,347 |
63.4% |
|
Democratic |
Billee Bussard |
80,598 |
34.2% |
|
Libertarian |
Joanna Liberty Tavares |
5,514 |
2.3% |
| Total votes |
235,459 |
100% |
2022
General Election (2022)[17]
| Party |
Candidate |
Votes |
% |
|
Republican |
Clay Yarborough |
149,177 |
67.6% |
|
Democratic |
Sharmin Smith |
71,472 |
32.4% |
| Total votes |
220,649 |
100% |