South Down (UK Parliament constituency)
| South Down | |
|---|---|
| County constituency for the House of Commons | |
 Boundary of South Down in Northern Ireland | |
| District | |
| Major settlements | Downpatrick |
| Current constituency | |
| Created | 1950 |
| Member of Parliament | Chris Hazzard (Sinn Féin) |
| Created from | Down |
| 1885–1922 | |
| Created from | Down |
| Replaced by | Down |
South Down is a parliamentary constituency in the United Kingdom House of Commons. The seat covers the Mourne Mountains, and Downpatrick to the north. It has a short border with the Republic of Ireland to the south. The MP since 2017 is Chris Hazzard of Sinn Féin.
History
The constituency was a predominantly Nationalist area prior to 1922. Although Sinn Féin leader Éamon de Valera was on the ballot at the 1918 general election, he did not campaign, as part of a pact with the Nationalist Party.
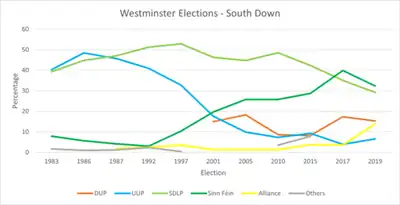
When it was recreated in 1950, the seat had a clear unionist majority, albeit with a strong nationalist minority. However boundary changes, which have wrapped it closer around nationalist heartlands near Downpatrick and the Mournes, have transformed South Down into a safe nationalist seat.
The House of Commons seat was consistently held by the Ulster Unionist Party from its creation until 1987. In the October 1974 general election the former Conservative MP Enoch Powell defended the seat for the UUP, representing a coup for them as they gained the support of a high-profile English politician, offering them a spokesperson to the United Kingdom as a whole.
Powell advocated a policy of integration for Northern Ireland whereby all forms of devolution would be wound up and the province governed as an integral part of the United Kingdom. As part of this, he campaigned for the province to have the same ratio of MPs to population as in the rest of the United Kingdom, rather than fewer, which had previously been justified due to the existence of the devolved Stormont Parliament. Powell was successful in this, but a side effect was that in his own constituency, a significant block of unionist voters were removed, resulting in a nationalist majority. Powell managed to survive for two election cycles due to a split nationalist vote, but at the 1987 general election, he narrowly lost to Eddie McGrady of the SDLP, who held the seat until he retired in 2010.
Since then, the unionist vote has declined further due to boundary changes, which excluded mainly unionist Dromore and Saintfield, and a trend for many unionists to tactically vote for the SDLP at Westminster elections to avoid the seat falling to Sinn Féin. However, in 2017, Sinn Féin gained the constituency for the first time with Chris Hazzard defeating former leader of the SDLP Margaret Ritchie as part of the SDLP's parliamentary wipeout at that year's snap general election.
The winning vote share in 2019 was the smallest of the 650 nationwide; it was just under 1⁄3 of the total votes that were cast.
The area voted to remain in the EU at the 2016 referendum.[1]

Boundaries
From 1801 to 1885, County Down returned two MPs to the House of Commons of the United Kingdom sitting at the Palace of Westminster, with separate representation for the parliamentary boroughs of Downpatrick and Newry. Under the Redistribution of Seats Act 1885, Downpatrick ceased to exist as a parliamentary borough and the parliamentary county was divided into four divisions: North Down, East Down, West Down, and South Down.
Under the Redistribution of Seats (Ireland) Act 1918, Newry ceased to exist as a parliamentary borough, and the parliamentary county gained the additional division of Mid Down.[2] At the 1918 general election, Sinn Féin contested on an election manifesto with an abstentionist pledge that instead of taking its seats at Westminster, it would establish an assembly in Dublin. All MPs elected to Irish seats were invited to participate in the First Dáil convened in January 1919, but no members outside of Sinn Féin did so.[3]
The Government of Ireland Act 1920 established the Parliament of Northern Ireland, which came into operation in 1921. The representation of Northern Ireland in the Parliament of the United Kingdom was reduced from 30 MPs to 13 MPs, taking effect at the 1922 United Kingdom general election. At Westminster, the five divisions of County Down were replaced by a two-member county constituency of Down. An eight-seat constituency of Down was created for the House of Commons of Northern Ireland, which formed the basis in republican theory for representation in the Second Dáil.[4]
| 1885–1918 | The baronies of Iveagh Upper, Lower Half, Lordship of Newry, and Mourne,
and so much of the barony of Iveagh Upper, Upper Half, as comprises the parishes of— Clonallan, Donaghmore, Drumgath, Kilbroney, and Warrenpoint.[5][6] |
| 1918–1922 | The rural district of Newry No. 1; the part of the rural district of Kilkeel which is not included in the East Down division;
and the urban districts of Newcastle, Newry, and Warrenpoint.[7] |
Under the Representation of the People Act 1948, all two-member constituencies were divided. Down was divided into the county constituencies of North Down and South Down. The area was reduced in 1983 as part of an expansion of Northern Ireland's constituencies from 12 to 17 with significant parts of the constituency transferred to Upper Bann and Newry and Armagh.
| 1950–1983 | The urban districts of Banbridge, Downpatrick, Dromore, Kilkeel, Newcastle, Newry and Warrenpoint;
the rural districts of Banbridge, Downpatrick, Kilkeel, Moira and Newry No. 1.[8][9] |
| 1983–1997 | The district of Down;
in Banbridge, the wards of Annaclone, Ballyoolymore, Croob, Dromore, Drumadonnell, Garran, Quilly and Skeagh; in Newry and Mourne, the wards of Annalong, Ballycrossan, Binnian, Clonallan, Cranfield, Donaghmore, Drumgath, Kilkeel, Lisnacree, Rathfriland, Rostrevor, Seaview, and Spelga.[10][11] |
| 1997–2010 | In the district of Down, the wards of Ardglass, Audley's Acre, Ballymaglave, Ballymote, Ballynahinch East, Castlewellan, Cathedral, Crossgar, Donard, Drumaness, Dundrum, Dunmore, Killough, Kilmore, Murlough, Quoile, Seaforde, Shimna, Strangford and Tollymore;
in Banbridge, the wards of Ballyward, Bannside, Katesbridge and Rathfriland; and in the district of Newry and Mourne, the wards of Annalong, Binnian, Burren and Kilbroney, Clonallan, Derryleckagh, Donaghmore, Kilkeel Central, Kilkeel South, Lisnacree, Mayobridge, Rostrevor, Seaview and Spelga.[12] |
| 2010–2024 | In the district of Banbridge, the wards of Ballyward, Bannside, Katesbridge and Rathfriland;
in the district of Down, the wards of Ardglass, Audley’s Acre, Ballymote, Castlewellan, Cathedral, Crossgar, Donard, Drumaness, Dundrum, Dunmore, Killough, Murlough, Quoile, Seaforde, Shimna, Strangford and Tollymore; and in the district of district of Newry and Mourne, the wards of Annalong, Binnian, Burren and Kilbroney, Clonallan, Derryleckagh, Donaghmore, Kilkeel Central, Kilkeel South, Lisnacree, Mayobridge, Rostrevor, Seaview and Spelga.[13] |
| 2024– | In Armagh City, Banbridge and Craigavon, the part of the Banbridge East ward to the east of the eastern boundary of the 2008 Upper Bann constituency, the part of the Gransha ward to the south of the southern boundary of the 2008 Lagan Valley constituency, and the wards of Loughbrickland ward, and Rathfriland;
and in Newry, Mourne and Down, the wards of the Annalong, Ballydugan ward, the part of the Ballyward ward to the south of the Ballyward split line, Binnian, Burren, Castlewellan, Cathedral, Derryleckagh, Donard, Dundrum, Hilltown, Kilkeel, Knocknashinna, Lecale, Lisnacree, Mayobridge, Murlough, the part of the Quoile ward to the south of the Quoile split line, Rostrevor, the relevant area in the Strangford ward, Tollymore, and Warrenpoint.[14] |
Members of Parliament
| Election | Member | Party | |
|---|---|---|---|
| 1885 | Constituency created | ||
| 1885 | John Francis Small | Irish Parliamentary | |
| 1886 | Michael McCartan | ||
| 1892 | Irish National Federation | ||
| 1895 | |||
| 1900 | Irish Parliamentary | ||
| 1902 b | Jeremiah McVeagh | ||
| 1906 | |||
| 1910 (Jan) | |||
| 1910 (Dec) | |||
| 1918 | |||
| 1922 | Constituency abolished – see Down | ||
| 1950 | Constituency re-created from Down | ||
| 1950 | Lawrence Orr | UUP | |
| 1951 | |||
| 1955 | |||
| 1959 | |||
| 1964 | |||
| 1966 | |||
| 1970 | |||
| 1974 (Feb) | |||
| 1974 (Oct) | Enoch Powell | ||
| 1979 | |||
| 1983 | |||
| 1983 b | |||
| 1987 | Eddie McGrady | SDLP | |
| 1992 | |||
| 1997 | |||
| 2001 | |||
| 2005 | |||
| 2010 | Margaret Ritchie | ||
| 2015 | |||
| 2017 | Chris Hazzard | Sinn Féin | |
| 2019 | |||
| 2024 | |||
Elections
Elections in the 2020s
| Party | Candidate | Votes | % | ±% | |
|---|---|---|---|---|---|
| Sinn Féin | Chris Hazzard | 19,698 | 43.5 | +12.7 | |
| SDLP | Colin McGrath | 10,418 | 23.0 | −4.2 | |
| DUP | Diane Forsythe | 7,349 | 16.2 | −1.9 | |
| Alliance | Andrew McMurray | 3,187 | 7.0 | −6.8 | |
| TUV | Jim Wells | 1,893 | 4.2 | New | |
| UUP | Michael O'Loan | 1,411 | 3.1 | −4.6 | |
| Aontú | Rosemary McGlone | 797 | 1.8 | −0.6 | |
| Green (NI) | Declan Walsh | 444 | 1.0 | New | |
| NI Conservatives | Hannah Westropp | 46 | 0.1 | New | |
| Majority | 9,280 | 20.5 | +17.3 | ||
| Turnout | 45,243 | 59.0 | −3.4 | ||
| Registered electors | 76,248 | ||||
| Sinn Féin hold | Swing | ||||
Elections in the 2010s
| Party | Candidate | Votes | % | ±% | |
|---|---|---|---|---|---|
| Sinn Féin | Chris Hazzard | 16,137 | 32.4 | ―7.5 | |
| SDLP | Michael Savage | 14,517 | 29.2 | ―5.9 | |
| DUP | Glyn Hanna | 7,619 | 15.3 | ―2.1 | |
| Alliance | Patrick Brown | 6,916 | 13.9 | +10.3 | |
| UUP | Jill Macauley | 3,307 | 6.6 | +2.7 | |
| Aontú | Paul Brady | 1,266 | 2.5 | New | |
| Majority | 1,620 | 3.2 | ―1.6 | ||
| Turnout | 49,762 | 62.9 | ―4.3 | ||
| Registered electors | 79,113 | ||||
| Sinn Féin hold | Swing | ―0.8 | |||
This seat saw the largest decrease in vote share for the SDLP at the 2019 general election.[19]
| Party | Candidate | Votes | % | ±% | |
|---|---|---|---|---|---|
| Sinn Féin | Chris Hazzard | 20,328 | 39.9 | +11.4 | |
| SDLP | Margaret Ritchie | 17,882 | 35.1 | ―7.2 | |
| DUP | Diane Forsythe | 8,867 | 17.4 | +9.2 | |
| UUP | Harold McKee | 2,002 | 3.9 | ―5.4 | |
| Alliance | Andrew McMurray | 1,814 | 3.6 | ―0.2 | |
| Majority | 2,446 | 4.8 | N/A | ||
| Turnout | 50,893 | 67.2 | +10.4 | ||
| Registered electors | 75,685 | ||||
| Sinn Féin gain from SDLP | Swing | ―9.3 | |||
| Party | Candidate | Votes | % | ±% | |
|---|---|---|---|---|---|
| SDLP | Margaret Ritchie[23] | 18,077 | 42.3 | ―6.2 | |
| Sinn Féin | Chris Hazzard[23] | 12,186 | 28.5 | ―0.2 | |
| UUP | Harold McKee | 3,964 | 9.3 | +2.0 | |
| DUP | Jim Wells | 3,486 | 8.2 | ―0.4 | |
| UKIP | Henry Reilly[23] | 3,044 | 7.1 | New | |
| Alliance | Martyn Todd[23] | 1,622 | 3.8 | +2.5 | |
| NI Conservatives | Felicity Buchan | 318 | 0.7 | New | |
| Majority | 5,891 | 13.8 | ―6.0 | ||
| Turnout | 42,697 | 56.8 | ―3.4 | ||
| Registered electors | 75,220 | ||||
| SDLP hold | Swing | ―2.9 | |||
| Party | Candidate | Votes | % | ±% | |
|---|---|---|---|---|---|
| SDLP | Margaret Ritchie | 20,648 | 48.5 | +1.6 | |
| Sinn Féin | Caitríona Ruane | 12,236 | 28.7 | +1.7 | |
| DUP | Jim Wells | 3,645 | 8.6 | ―7.6 | |
| UCU-NF | John McCallister | 3,093 | 7.3 | ―1.5 | |
| TUV | Ivor McConnell | 1,506 | 3.5 | New | |
| Green (NI) | Cadogan Enright | 901 | 2.1 | New | |
| Alliance | David Griffin | 560 | 1.3 | 0.0 | |
| Majority | 8,412 | 19.8 | +0.8 | ||
| Turnout | 42,589 | 60.2 | ―8.5 | ||
| Registered electors | 70,784 | ||||
| SDLP hold | Swing | ―0.1 | |||
Elections in the 2000s
| Party | Candidate | Votes | % | ±% | |
|---|---|---|---|---|---|
| SDLP | Eddie McGrady | 21,557 | 44.7 | ―1.6 | |
| Sinn Féin | Caitríona Ruane | 12,417 | 25.8 | +6.1 | |
| DUP | Jim Wells | 8,815 | 18.3 | +3.3 | |
| UUP | Dermot Nesbitt | 4,775 | 9.9 | ―7.7 | |
| Alliance | Julian Crozier | 613 | 1.3 | ±0.0 | |
| Majority | 9,140 | 18.9 | ―7.7 | ||
| Turnout | 48,177 | 65.4 | ―5.4 | ||
| Registered electors | 73,175 | ||||
| SDLP hold | Swing | ―3.8 | |||
| Party | Candidate | Votes | % | ±% | |
|---|---|---|---|---|---|
| SDLP | Eddie McGrady | 24,136 | 46.3 | ―6.6 | |
| Sinn Féin | Mick Murphy | 10,278 | 19.7 | +9.3 | |
| UUP | Dermot Nesbitt | 9,173 | 17.6 | ―15.2 | |
| DUP | Jim Wells | 7,802 | 15.0 | New | |
| Alliance | Betty Campbell | 685 | 1.3 | ―2.2 | |
| Majority | 13,858 | 26.6 | +6.5 | ||
| Turnout | 52,074 | 70.8 | 0.0 | ||
| Registered electors | 73,519 | ||||
| SDLP hold | Swing | ―8.0 | |||
Elections in the 1990s
| Party | Candidate | Votes | % | ±% | |
|---|---|---|---|---|---|
| SDLP | Eddie McGrady | 26,181 | 52.9 | +1.7 | |
| UUP | Dermot Nesbitt | 16,248 | 32.8 | −8.1 | |
| Sinn Féin | Mick Murphy | 5,127 | 10.4 | +7.4 | |
| Alliance | Julian Crozier | 1,711 | 3.5 | +1.0 | |
| Natural Law | Rosaleen McKeon | 219 | 0.4 | New | |
| Majority | 9,933 | 20.1 | +9.8 | ||
| Turnout | 49,486 | 70.8 | −10.1 | ||
| Registered electors | 69,977 | ||||
| SDLP hold | Swing | −0.3 | |||
| Party | Candidate | Votes | % | ±% | |
|---|---|---|---|---|---|
| SDLP | Eddie McGrady | 31,523 | 51.2 | +4.2 | |
| UUP | Drew Nelson | 25,181 | 40.9 | −4.8 | |
| Sinn Féin | Sean Fitzpatrick | 1,843 | 3.0 | −1.2 | |
| Alliance | Michael Healey | 1,542 | 2.5 | +0.6 | |
| NI Conservatives | Stephanie McKenzie-Hill | 1,488 | 2.4 | New | |
| Majority | 6,342 | 10.3 | +9.0 | ||
| Turnout | 61,577 | 80.9 | +1.5 | ||
| Registered electors | 76,186 | ||||
| SDLP hold | Swing | ||||
Elections in the 1980s
| Party | Candidate | Votes | % | ±% | |
|---|---|---|---|---|---|
| SDLP | Eddie McGrady | 26,579 | 47.0 | +7.7 | |
| UUP | Enoch Powell | 25,848 | 45.7 | +5.4 | |
| Sinn Féin | Geraldine Ritchie | 2,363 | 4.2 | −3.7 | |
| Alliance | Siobhan Laird | 1,069 | 1.9 | −1.7 | |
| Workers' Party | Des O'Hagan | 675 | 1.2 | −0.5 | |
| Majority | 731 | 1.3 | N/A | ||
| Turnout | 56,534 | 79.4 | +1.7 | ||
| Registered electors | 71,235 | ||||
| SDLP gain from UUP | Swing | ||||
| Party | Candidate | Votes | % | ±% | |
|---|---|---|---|---|---|
| UUP | Enoch Powell | 24,963 | 48.4 | +8.1 | |
| SDLP | Eddie McGrady | 23,121 | 44.8 | +5.5 | |
| Sinn Féin | Hugh McDowell | 2,963 | 5.7 | −2.2 | |
| Workers' Party | Sean Magee | 522 | 1.0 | −0.7 | |
| Majority | 1,842 | 3.6 | +2.6 | ||
| Turnout | 51,569 | 73.8 | −3.9 | ||
| Registered electors | 69,843 | ||||
| UUP hold | Swing | ||||
| Party | Candidate | Votes | % | ±% | |
|---|---|---|---|---|---|
| UUP | Enoch Powell | 20,693 | 40.3 | −9.7 | |
| SDLP | Eddie McGrady | 20,145 | 39.3 | +2.0 | |
| Sinn Féin | Patrick Fitzsimmons | 4,074 | 7.9 | New | |
| DUP | Cecil Harvey | 3,743 | 7.3 | New | |
| Alliance | Patrick Forde | 1,823 | 3.6 | −5.2 | |
| Workers' Party | Margaret Magee | 851 | 1.7 | New | |
| Majority | 548 | 1.0 | −11.7 | ||
| Turnout | 51,329 | 77.7 | +5.7 | ||
| Registered electors | 66,923 | ||||
| UUP hold | Swing | ||||
Elections in the 1970s
| Party | Candidate | Votes | % | ±% | |
|---|---|---|---|---|---|
| UUP | Enoch Powell | 32,254 | 50.0 | −0.8 | |
| SDLP | Eddie McGrady | 24,033 | 37.3 | −8.1 | |
| Alliance | Patrick Forde | 4,407 | 6.8 | New | |
| Irish Independence | John Markey | 1,853 | 2.9 | New | |
| Republican Clubs | Des O'Hagan | 1,682 | 2.6 | −0.9 | |
| Inter-Dependence Party | Francis Rice | 216 | 0.3 | New | |
| Reform | Peter Courtney | 31 | 0.1 | New | |
| Majority | 8,221 | 12.7 | +7.3 | ||
| Turnout | 64,476 | 72.0 | −0.4 | ||
| Registered electors | 89,562 | ||||
| UUP hold | Swing | ||||
| Party | Candidate | Votes | % | ±% | |
|---|---|---|---|---|---|
| UUP | Enoch Powell | 33,614 | 50.8 | −1.3 | |
| SDLP | Sean Hollywood | 30,047 | 45.4 | +2.6 | |
| Republican Clubs | Gerard Oliver O'Hanlon | 2,327 | 3.5 | −1.6 | |
| Marxist–Leninist | David Vipond | 152 | 0.2 | New | |
| Majority | 3,567 | 5.4 | −4.0 | ||
| Turnout | 66,140 | 72.4 | +7.4 | ||
| Registered electors | 91,354 | ||||
| UUP hold | Swing | ||||
| Party | Candidate | Votes | % | ±% | |
|---|---|---|---|---|---|
| UUP | Lawrence Orr | 31,088 | 52.1 | −2.2 | |
| SDLP | Sean Hollywood | 25,486 | 42.8 | New | |
| Republican Clubs | Hugh Golding | 3,046 | 5.1 | New | |
| Majority | 5,602 | 9.4 | −11.2 | ||
| Turnout | 59,620 | 65.0 | −9.0 | ||
| Registered electors | 91,792 | ||||
| UUP hold | Swing | ||||
| Party | Candidate | Votes | % | ±% | |
|---|---|---|---|---|---|
| UUP | Lawrence Orr | 34,894 | 54.3 | −9.7 | |
| Unity | Hugh Golding | 21,676 | 33.7 | New | |
| Ulster Liberal | John Quinn | 7,747 | 12.1 | −6.6 | |
| Majority | 13,218 | 20.6 | −24.7 | ||
| Turnout | 64,317 | 74.0 | +8.2 | ||
| Registered electors | 87,079 | ||||
| UUP hold | Swing | ||||
Elections in the 1960s
| Party | Candidate | Votes | % | ±% | |
|---|---|---|---|---|---|
| UUP | Lawrence Orr | 32,876 | 64.0 | +5.0 | |
| Ulster Liberal | John Quinn | 9,586 | 18.7 | +8.6 | |
| Ind. Republican | George Mussen | 8,917 | 17.4 | −2.4 | |
| Majority | 23,290 | 45.3 | +6.1 | ||
| Turnout | 51,379 | 65.8 | −6.3 | ||
| Registered electors | 78,096 | ||||
| UUP hold | Swing | ||||
| Party | Candidate | Votes | % | ±% | |
|---|---|---|---|---|---|
| UUP | Lawrence Orr | 32,922 | 59.0 | −26.4 | |
| Ind. Republican | George Mussen | 11,031 | 19.8 | New | |
| NI Labour | Samuel Thompson | 6,260 | 11.2 | New | |
| Ulster Liberal | Hamilton Gooding | 5,610 | 10.1 | New | |
| Majority | 21,891 | 39.2 | −31.6 | ||
| Turnout | 55,823 | 72.1 | +16.5 | ||
| Registered electors | 77,391 | ||||
| UUP hold | Swing | ||||
Elections in the 1950s
| Party | Candidate | Votes | % | ±% | |
|---|---|---|---|---|---|
| UUP | Lawrence Orr | 36,875 | 85.6 | +19.7 | |
| Sinn Féin | Kevin O'Rourke | 6,928 | 14.4 | −19.7 | |
| Majority | 30,577 | 71.2 | +39.4 | ||
| Turnout | 43,803 | 56.4 | −17.5 | ||
| Registered electors | 77,627 | ||||
| UUP hold | Swing | ||||
| Party | Candidate | Votes | % | ±% | |
|---|---|---|---|---|---|
| UUP | Lawrence Orr | 37,921 | 65.9 | +7.5 | |
| Sinn Féin | Kevin O'Rourke | 19,624 | 34.1 | New | |
| Majority | 18,297 | 31.8 | +15.0 | ||
| Turnout | 57,545 | 73.9 | −8.1 | ||
| Registered electors | 77,832 | ||||
| UUP hold | Swing | ||||
| Party | Candidate | Votes | % | ±% | |
|---|---|---|---|---|---|
| UUP | Lawrence Orr | 37,789 | 58.4 | −5.1 | |
| Ind. Republican | Gerald Annesley | 26,976 | 41.6 | New | |
| Majority | 10,813 | 16.8 | −10.2 | ||
| Turnout | 64,765 | 82.0 | +5.3 | ||
| Registered electors | 79,001 | ||||
| UUP hold | Swing | ||||
| Party | Candidate | Votes | % | ±% | |
|---|---|---|---|---|---|
| UUP | Lawrence Orr | 38,508 | 63.5 | N/A | |
| Irish Labour | Jack MacGougan | 22,176 | 36.5 | N/A | |
| Majority | 16,332 | 27.0 | N/A | ||
| Turnout | 60,684 | 76.7 | N/A | ||
| Registered electors | 79,125 | ||||
| UUP win (new seat) | |||||
Elections in the 1910s
| Party | Candidate | Votes | % | ±% | |
|---|---|---|---|---|---|
| Irish Parliamentary | Jeremiah McVeagh | 8,756 | 54.7 | 0.0 | |
| Irish Unionist | John Alexander Weir Johnston | 5,573 | 45.3 | 0.0 | |
| Independent | Alexander Fisher | 436 | 2.9 | New | |
| Sinn Féin | Éamon de Valera | 33 | 0.2 | New | |
| Majority | 3,183 | 21.4 | +12.0 | ||
| Turnout | 14,798 | 86.5 | 0.0 | ||
| Registered electors | 18,708 | ||||
| Irish Parliamentary hold | Swing | +6.1 | |||
Éamon de Valera was also elected unopposed for East Clare and elected in a contested election in East Mayo.
| Party | Candidate | Votes | % | ±% | |
|---|---|---|---|---|---|
| Irish Parliamentary | Jeremiah McVeagh | 3,668 | 54.7 | +0.2 | |
| Irish Unionist | John Alexander Weir Johnston | 3,040 | 45.3 | −0.2 | |
| Majority | 635 | 9.4 | +0.4 | ||
| Turnout | 6,708 | 86.5 | −3.7 | ||
| Registered electors | 7,753 | ||||
| Irish Parliamentary hold | Swing | +0.2 | |||
| Party | Candidate | Votes | % | ±% | |
|---|---|---|---|---|---|
| Irish Parliamentary | Jeremiah McVeagh | 3,815 | 54.5 | 0.0 | |
| Irish Unionist | Lynden Macassey | 3,180 | 45.5 | 0.0 | |
| Majority | 635 | 9.0 | 0.0 | ||
| Turnout | 6,995 | 90.2 | +1.0 | ||
| Registered electors | 7,753 | ||||
| Irish Parliamentary hold | Swing | 0.0 | |||
Elections in the 1900s
| Party | Candidate | Votes | % | ±% | |
|---|---|---|---|---|---|
| Irish Parliamentary | Jeremiah McVeagh | 3,910 | 54.5 | N/A | |
| Irish Unionist | Peter Kerr-Smiley | 3,262 | 45.5 | New | |
| Majority | 648 | 9.0 | N/A | ||
| Turnout | 7,172 | 89.2 | N/A | ||
| Registered electors | 8,036 | ||||
| Irish Parliamentary hold | Swing | N/A | |||
| Party | Candidate | Votes | % | ±% | |
|---|---|---|---|---|---|
| Irish Parliamentary | Jeremiah McVeagh | Unopposed | |||
| Registered electors | |||||
| Irish Parliamentary hold | |||||
| Party | Candidate | Votes | % | ±% | |
|---|---|---|---|---|---|
| Irish Parliamentary | Michael McCartan | Unopposed | |||
| Registered electors | |||||
| Irish Parliamentary hold | |||||
Elections in the 1890s
| Party | Candidate | Votes | % | ±% | |
|---|---|---|---|---|---|
| Irish National Federation | Michael McCartan | 4,057 | 54.6 | +1.2 | |
| Liberal Unionist | Thomas Rowan | 3,378 | 45.4 | −0.7 | |
| Majority | 679 | 9.2 | +1.9 | ||
| Turnout | 7,435 | 85.3 | +0.9 | ||
| Registered electors | 8,715 | ||||
| Irish National Federation hold | Swing | +1.0 | |||
| Party | Candidate | Votes | % | ±% | |
|---|---|---|---|---|---|
| Irish National Federation | Michael McCartan | 4,207 | 53.4 | −2.2 | |
| Liberal Unionist | John Walker Craig | 3,636 | 46.1 | +1.7 | |
| Irish National League | Eiver Magenis | 42 | 0.5 | N/A | |
| Majority | 571 | 7.3 | −3.9 | ||
| Turnout | 7,885 | 84.4 | +1.2 | ||
| Registered electors | 9,342 | ||||
| Irish National Federation gain from Irish Parliamentary | Swing | -2.0 | |||
Elections in the 1880s
| Party | Candidate | Votes | % | ±% | |
|---|---|---|---|---|---|
| Irish Parliamentary | Michael McCartan | 4,786 | 55.6 | −1.6 | |
| Liberal Unionist | Robert Swan Corbitt | 3,816 | 44.4 | +1.6 | |
| Majority | 970 | 11.2 | −3.2 | ||
| Turnout | 8,602 | 83.2 | −1.3 | ||
| Registered electors | 10,335 | ||||
| Irish Parliamentary hold | Swing | -1.6 | |||
| Party | Candidate | Votes | % | ±% | |
|---|---|---|---|---|---|
| Irish Parliamentary | John Francis Small | 4,995 | 57.2 | ||
| Irish Conservative | William Henry Kisbey | 3,743 | 42.8 | ||
| Majority | 1,252 | 14.4 | |||
| Turnout | 8,738 | 84.5 | |||
| Registered electors | 10,335 | ||||
| Irish Parliamentary win (new seat) | |||||
See also
References
- 1 2 "Down South: Seat Details". Electoral Calculus.
- ↑ Representation of the People Bill 1917: redistribution of seats: report. Boundary Commission (Ireland). 1917.
- ↑ "3. An Rolla". Dáil Debates (in Irish). F (1). Houses of the Oireachtas. 21 January 1919. Retrieved 6 September 2025.
- ↑ "Appendix 19: Dáil Éireann: Extract from Minutes of Meeting on 16th August 1921: Copy of Roll". Dáil Debates. T (17). Houses of the Oireachtas.
- ↑ "Redistribution of Seats Act 1885 (48 & 49 Vict. c. 23), s. 8 and Seventh Schedule, Part III" (PDF). legislation.gov.uk.
- ↑ Maps of baronies at "Down Maps". Sabhal Mòr Ostaig. 24 December 2007. Retrieved 6 September 2025.
- ↑ "Redistribution of Seats (Ireland) Act 1918 (7 & 8 Geo. 5. c. 65), Fourth Schedule, Part I" (PDF). legislation.gov.uk.
- ↑ First Schedule, Part IV (Northern Ireland), (a) County constituencies, "Representation of the People Act 1948 (11 & 12 Geo. 6, Ch. 65)" (PDF). legislation.gov.uk. The National Archives.
- ↑ "The Parliamentary Constituencies (Northern Ireland) Order 1970 (No. 1678)" (PDF). legislation.gov.uk. The National Archives.
- ↑ Schedule (a) County constituencies, "The Parliamentary Constituencies (Northern Ireland) Order 1982 (No. 1838)" (PDF). legislation.gov.uk. The National Archives. 22 December 1982.
- ↑ Crewe, Ivor (1983). British Parliamentary Constituencies – a Statistical Compendium. Faber and Faber. ISBN 0-571-13236-7.
- ↑ "Parliamentary Constituencies (Northern Ireland) Order 1995: Schedule", legislation.gov.uk, The National Archives, 23 November 1995, SI 1995/2992 (sch.)
- ↑ "Parliamentary Constituencies (Northern Ireland) Order 2008: Schedule", legislation.gov.uk, The National Archives, 11 June 2008, SI 2008/1486 (sch.)
- ↑ "Parliamentary Constituencies Order 2023: Schedule 2", legislation.gov.uk, The National Archives, 15 November 2023, SI 2023/1230 (sch. 2)
- ↑ "General election for the constituency of South Down on 4 July 2024". UK Parliament.
- ↑ "Statement of Persons Nominated and Notice of Poll". Electoral Office for Northern Ireland. 7 June 2024. Retrieved 7 June 2024.
- ↑ "South Down results". BBC. 4 July 2024. Retrieved 5 July 2024.
- ↑ "South Down Parliamentary constituency". BBC News. Retrieved 18 November 2019.
- ↑ "2019 general election: results and analysis" (PDF) (second ed.). House of Commons Library. p. 25.
- ↑ "Election of a Member of Parliament for the SOUTH DOWN Constituency – Statement of Persons Nominated and Notice of Poll". Electoral Office of Northern Ireland. 11 May 2017. Retrieved 16 May 2017.
- ↑ "Election Data 2015". Electoral Calculus. Archived from the original on 17 October 2015. Retrieved 17 October 2015.
- ↑ "The Electoral Office of Northern Ireland – EONI". eoni.org.uk.
- 1 2 3 4 "Candidates to be MP for South Down". Archived from the original on 5 March 2016. Retrieved 3 March 2015.
- ↑ "Election Data 2010". Electoral Calculus. Archived from the original on 26 July 2013. Retrieved 17 October 2015.
- ↑ "Election Data 2005". Electoral Calculus. Archived from the original on 15 October 2011. Retrieved 18 October 2015.
- ↑ "Election Data 2001". Electoral Calculus. Archived from the original on 15 October 2011. Retrieved 18 October 2015.
- ↑ "Election Data 1997". Electoral Calculus. Archived from the original on 15 October 2011. Retrieved 18 October 2015.
- ↑ "Election Data 1992". Electoral Calculus. Archived from the original on 15 October 2011. Retrieved 18 October 2015.
- ↑ "Election Data 1987". Electoral Calculus. Archived from the original on 15 October 2011. Retrieved 18 October 2015.
- ↑ "By-election Result". United Kingdom Election Results.
- ↑ "Election Data 1983". Electoral Calculus. Archived from the original on 15 October 2011. Retrieved 18 October 2015.
- 1 2 3 4 5 6 7 8 9 Walker, B.M., ed. (1978). Parliamentary Election Results in Ireland, 1801-1922. Dublin: Royal Irish Academy. pp. 344, 387. ISBN 0901714127.
- ↑ "Election intelligence". The Times. No. 36696. London. 20 February 1902. p. 10.
Further reading
- Guardian Unlimited Politics (Election results from 1992 to the present)
- http://www.psr.keele.ac.uk/ (Election results from 1951 to the present)
- Leigh Rayment's Historical List of MPs – Constituencies beginning with "D" (part 3)
- Walker, Brian M., ed. (1978). Parliamentary Election Results in Ireland, 1801–1922. Dublin: Royal Irish Academy. ISBN 0901714127.
- Stenton, M.; Lees, S., eds. (1978). Who's Who of British members of parliament: Volume II 1886–1918. The Harvester Press.
- Stenton, M.; Lees, S., eds. (1979). Who's Who of British members of parliament: Volume III 1919–1945. The Harvester Press.
- F. W. S. Craig, British Parliamentary Election Results 1950 – 1970
- The Liberal Year Book For 1917, Liberal Publication Department
- The Constitutional Year Book For 1912, Conservative Central Office
- The Constitutional Year Book For 1894, Conservative Central Office
External links
- Politics Resources (Election results from 1922 onwards)
- Electoral Calculus (Election results from 1955 onwards)
- 2017 Election House of Commons Library 2017 Election report
- A Vision Of Britain Through Time (Constituency elector numbers)
- South Down UK Parliament constituency (boundaries April 2010 – May 2024) at MapIt UK
- South Down UK Parliament constituency (boundaries from June 2024) at MapIt UK
- Politics of County Down
- Westminster constituencies in County Down (historic)
- Dáil constituencies in Northern Ireland (historic)
- Constituencies of the Parliament of the United Kingdom established in 1885
- Constituencies of the Parliament of the United Kingdom disestablished in 1922
- Constituencies of the Parliament of the United Kingdom established in 1950
- Westminster Parliamentary constituencies in Northern Ireland
- 1885 establishments in Ireland
- 1950 establishments in Northern Ireland